Upgrade to Pro — share decks privately, control downloads, hide ads and more …

"Introduction to Google Earth Engine", Jessica Walker, USGS

"Introduction to Google Earth Engine", Jessica Walker, USGS

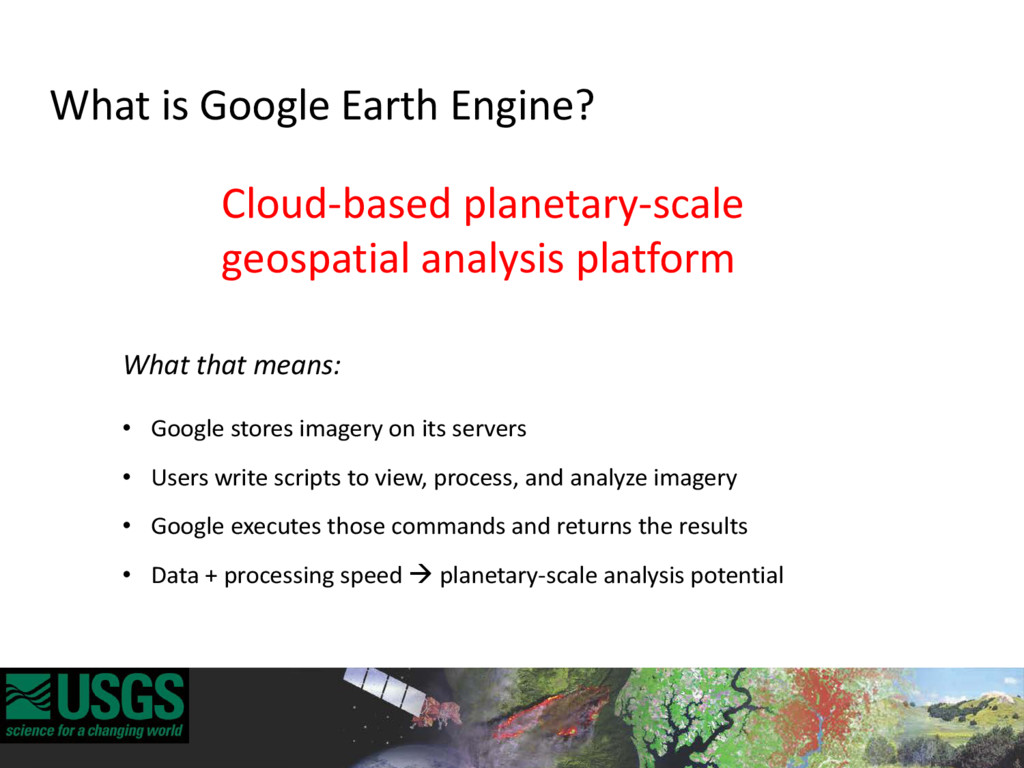
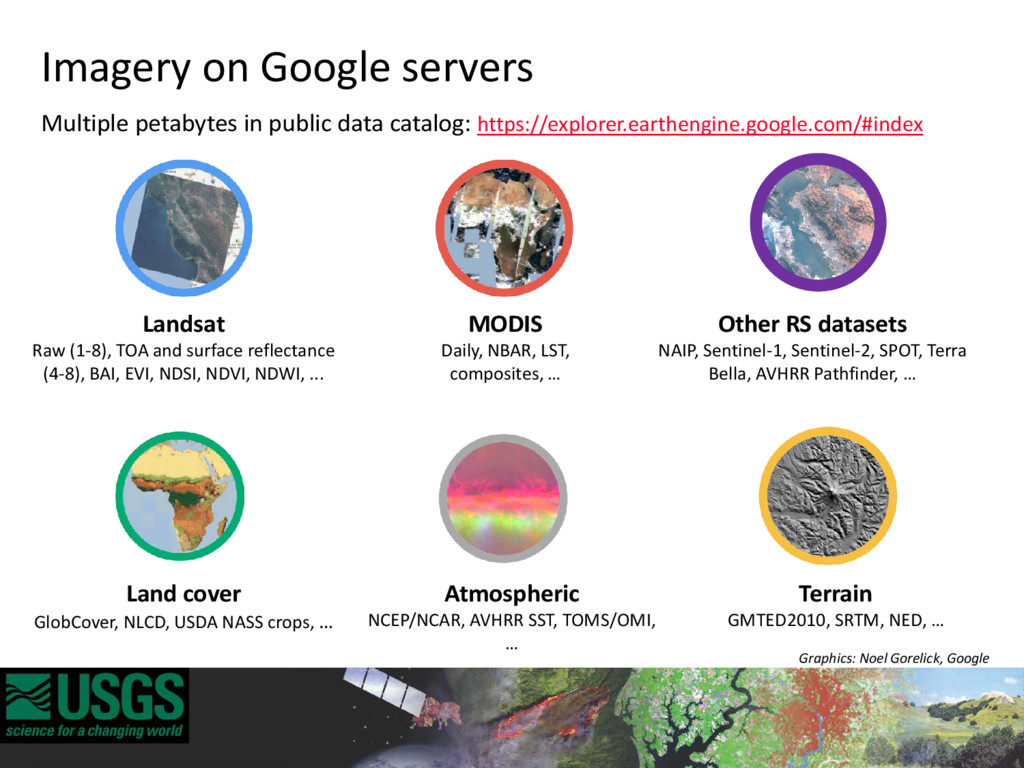
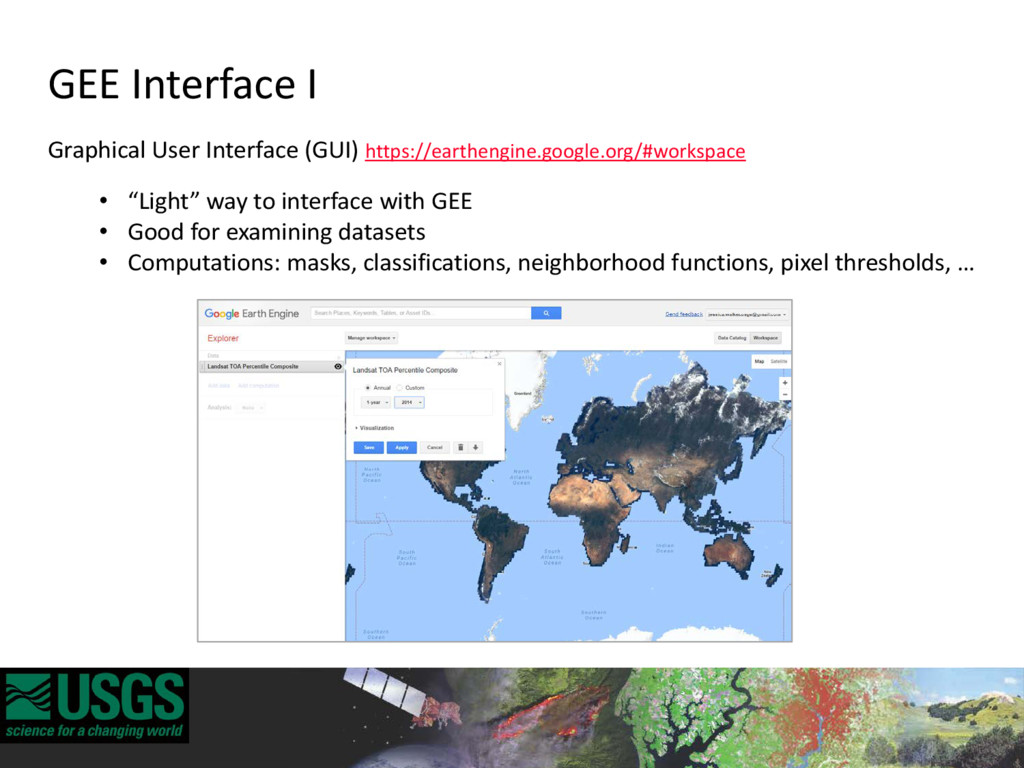
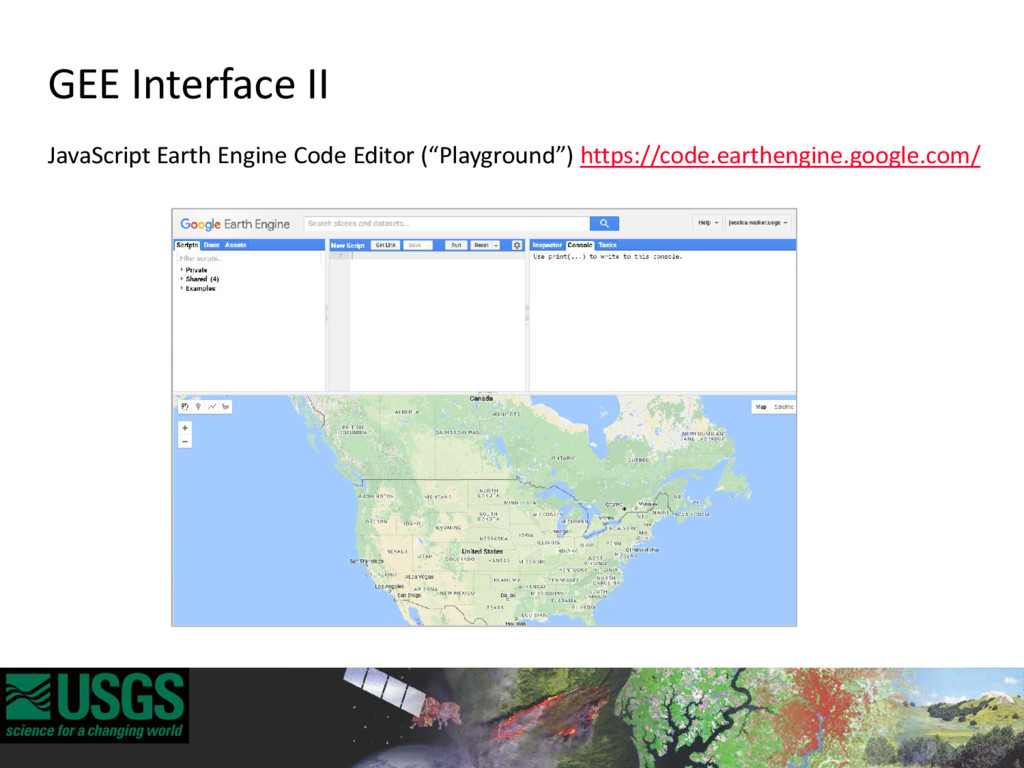
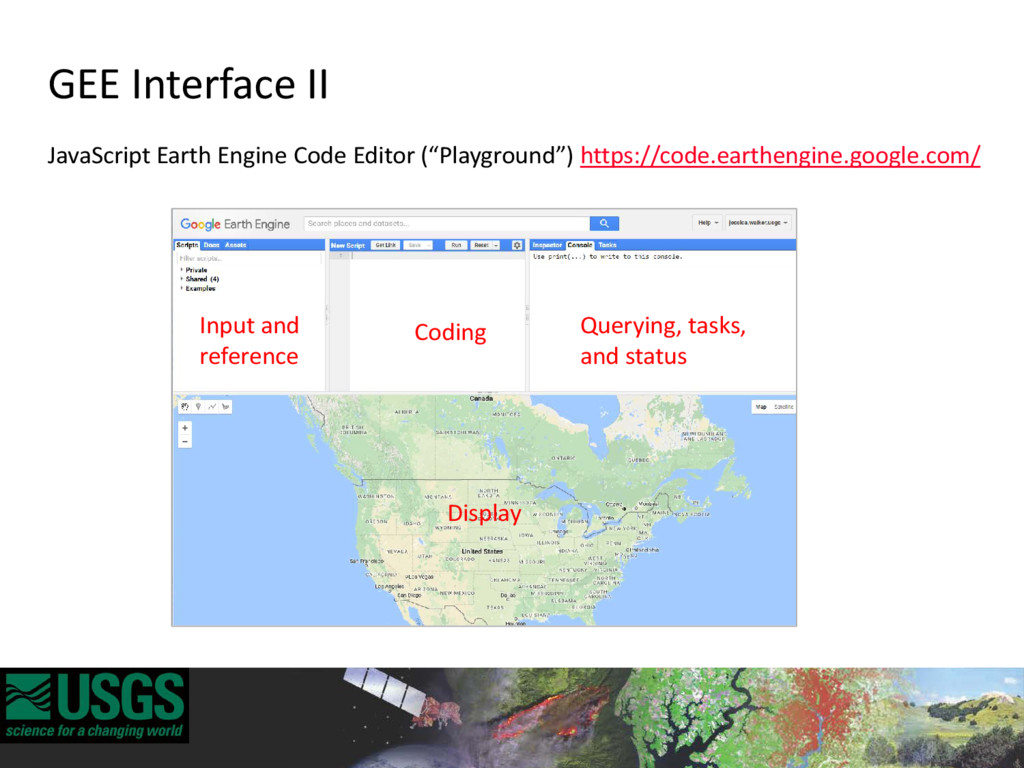
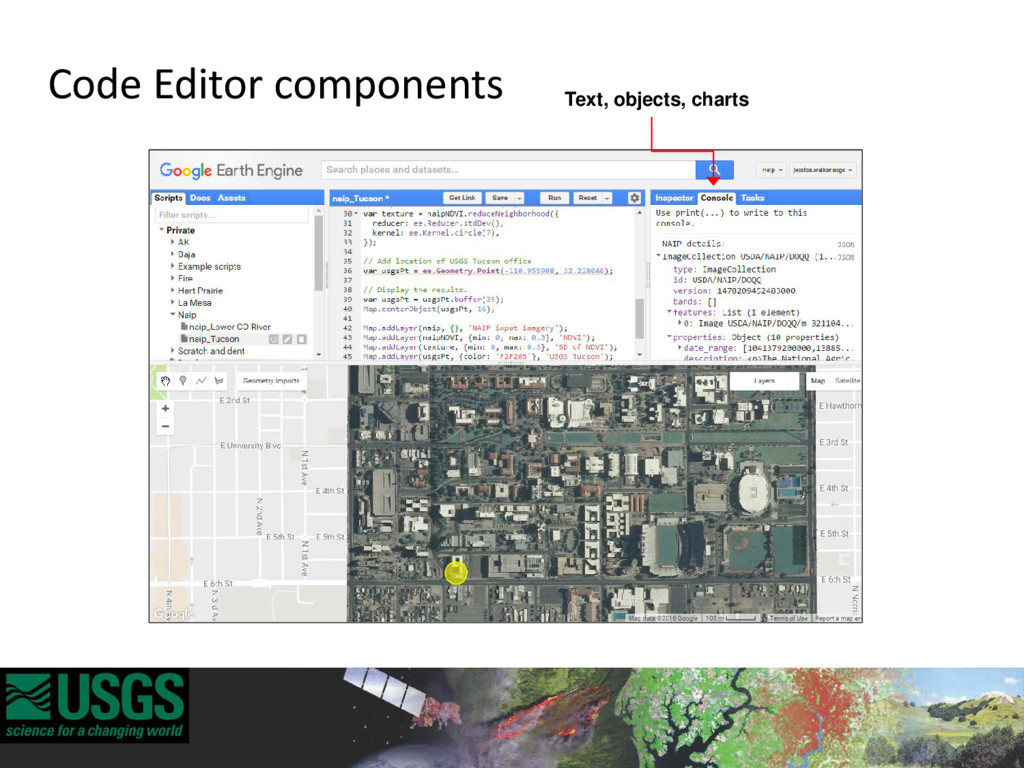
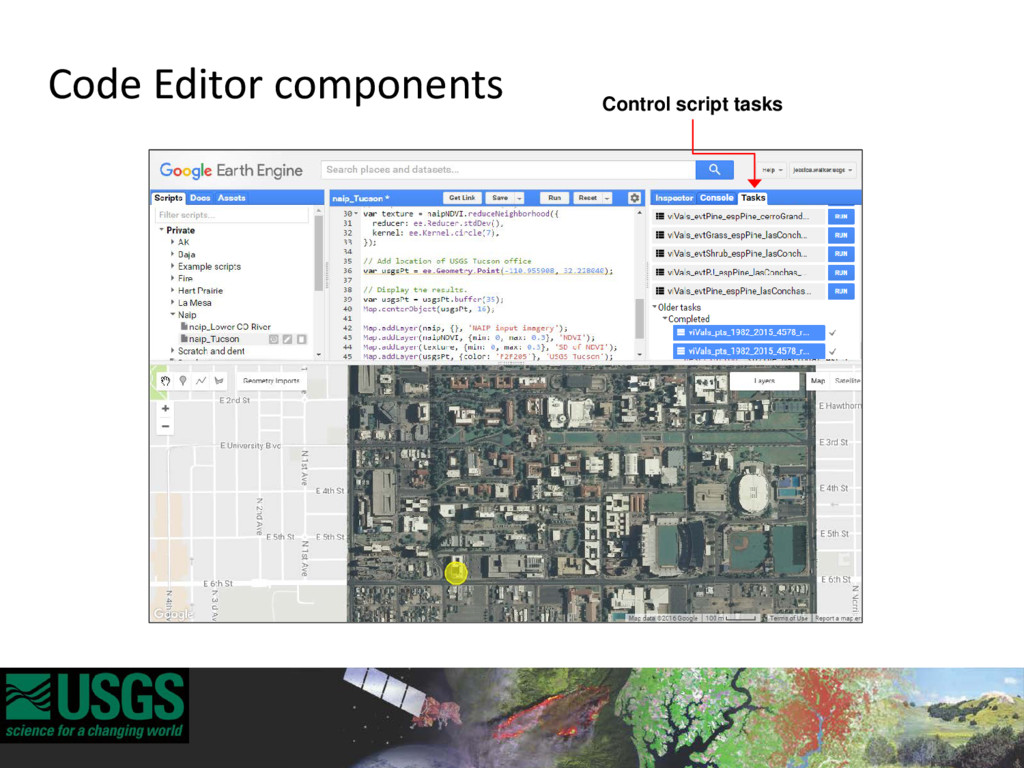
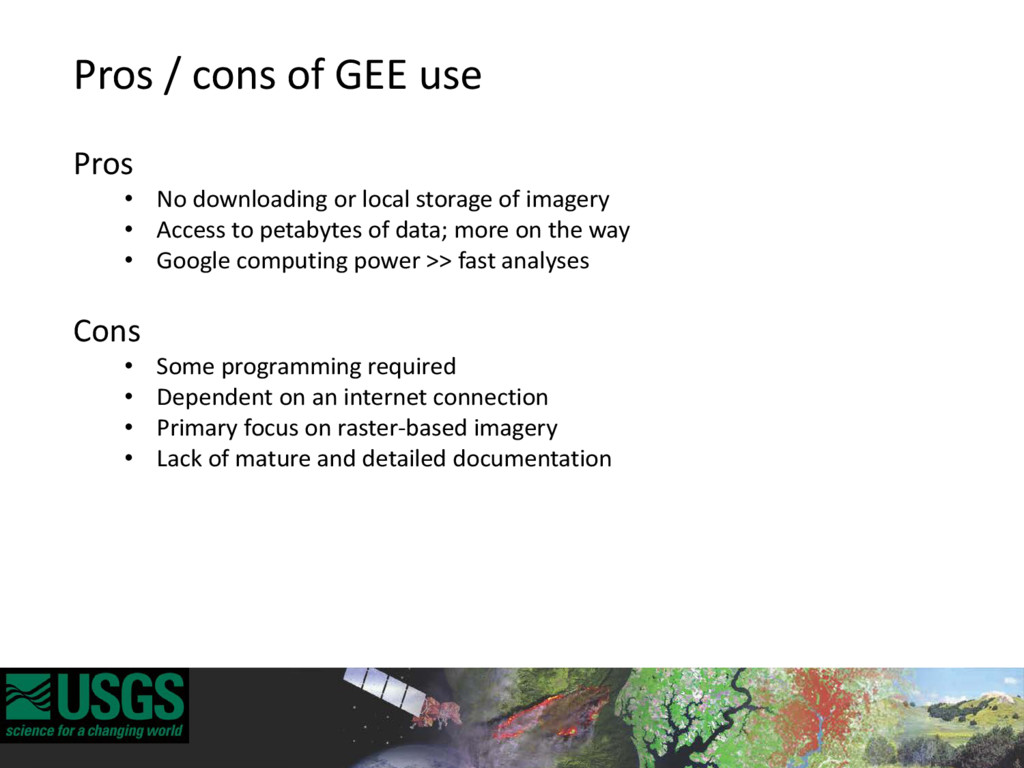
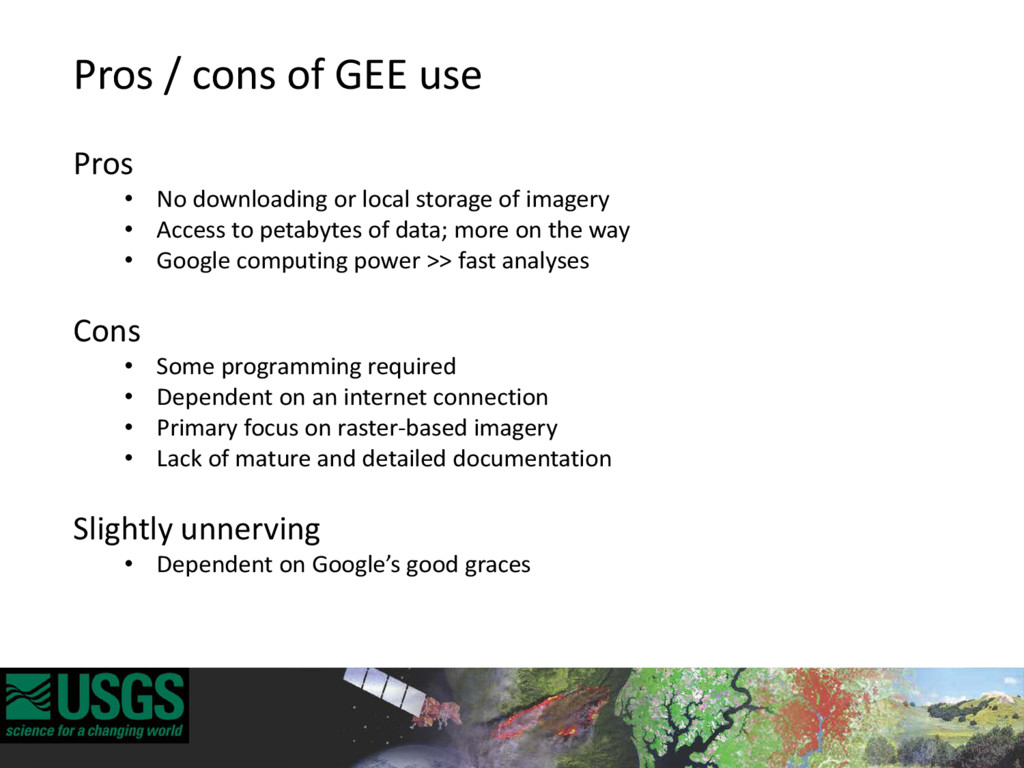
Summary: Google Earth Engine is a cloud-based geospatial processing platform that unites multiple petabytes of publicly accessible imagery and a massive computational infrastructure with a web-based integrated development environment (IDE). Users can harness the unprecedented combination of data and computing resources to conduct complex geospatial analyses on planetary scales.

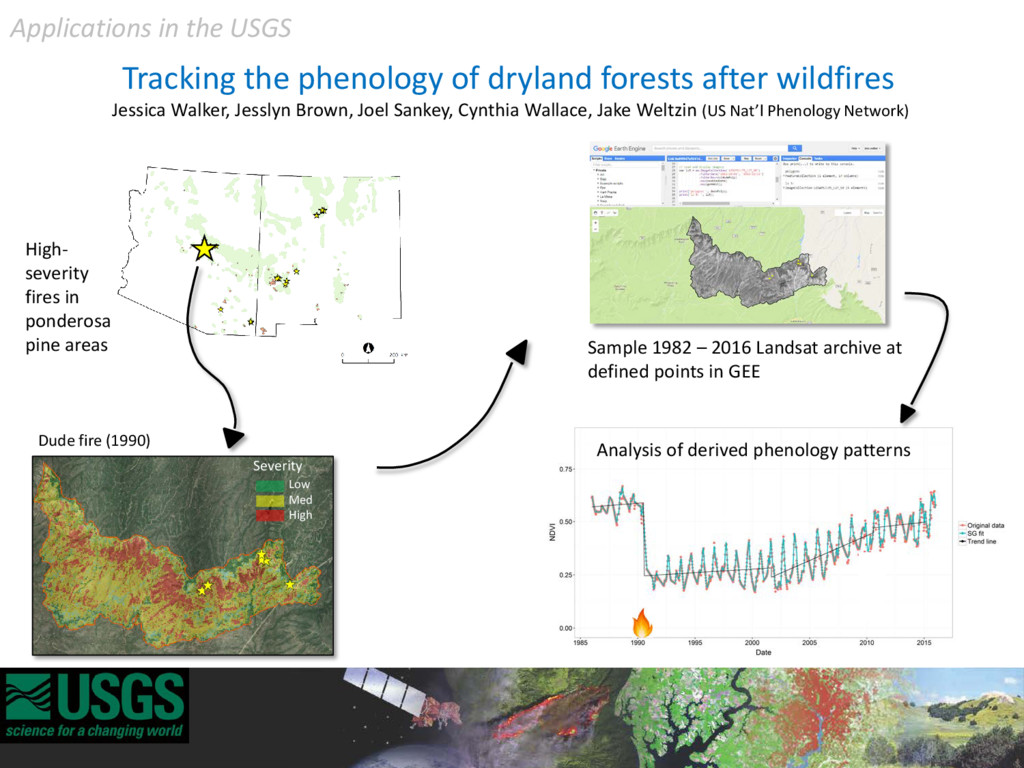
Speaker: Jessica Walker is a postdoctoral researcher with the USGS Western Geographic Science Center in Tucson, AZ. Her research investigates the recovery of post-wildfire landscapes in Alaska and across the southwestern US using time series of remote sensing imagery

ESIP Federation

January 19, 2017
Tweet

More Decks by ESIP Federation

Other Decks in Technology

Transcript

  1. Overview • What is Google Earth Engine (GEE)? • Examples

    of applications and ongoing projects • How to start using GEE
  2. Cloud-based planetary-scale geospatial analysis platform What is Google Earth Engine?

    What that means: • Google stores imagery on its servers • Users write scripts to view, process, and analyze imagery • Google executes those commands and returns the results • Data + processing speed  planetary-scale analysis potential
  3. Imagery on Google servers Multiple petabytes in public data catalog:

    https://explorer.earthengine.google.com/#index Landsat Raw (1-8), TOA and surface reflectance (4-8), BAI, EVI, NDSI, NDVI, NDWI, ... MODIS Daily, NBAR, LST, composites, … Other RS datasets NAIP, Sentinel-1, Sentinel-2, SPOT, Terra Bella, AVHRR Pathfinder, … Atmospheric NCEP/NCAR, AVHRR SST, TOMS/OMI, … Terrain GMTED2010, SRTM, NED, … Land cover GlobCover, NLCD, USDA NASS crops, … Graphics: Noel Gorelick, Google
  4. Imagery wish list Datasets are continually added. Users can submit

    requests for desired datasets: https://code.google.com/a/google.com/p/ee-testers-external/issues/list
  5. Integrating private data in GEE Users can upload their own

    raster or vector datasets • Rasters: 10 GB individual file size limit • Vectors: 250 Mb; 500,000 record limit • 15 GB free across all Google drives • Google Drive, Gmail, Google Photos …but more space available • Files can be shared publicly or privately
  6. GEE Interface I Graphical User Interface (GUI) https://earthengine.google.org/#workspace • “Light”

    way to interface with GEE • Good for examining datasets • Computations: masks, classifications, neighborhood functions, pixel thresholds, …
  7. Choice of APIs: JavaScript or Python • Same EE backend,

    same API protocols • JavaScript • More support and use of  better coding assistance • Deeply integrated with Playground  faster algorithm testing • No module support  hard to organize long code • Python • Recommended only for development of operational apps • Fewer users  less coding assistance • Better support for task and asset management • Good for statistics, data analysis, plotting with python packages • Matlab replacement (scientific libraries: numpy, scipy, etc.)
  8. Parallel distributed system: analyses run simultaneously on many CPUs across

    many computers Test case: • Retrieve all available Landsat images for a given location (1982 – 2016) • Mask cloud/shadow/water • Compute multiple VIs • Return .csv file of values at sampled locations Time: ~ 9 minutes After caching: ~ 3 minutes Photo: https://www.wired.com/wp-content/uploads/blogs/wiredenterprise/wp-content/uploads/2012/10/ff_googleinfrastructure2_large.jpg Google server room in Council Bluffs, IA GEE processing capability
  9. Global Forest Cover Change http://earthenginepartners.appspot.com/science-2013-global-forest • Forest extent, loss, and

    gain at 30m scale, 2000 – 2012 • ~ 143 billion pixels; 654,178 Landsat images • Worked closely with GEE personnel Hansen et al., 2013. High-resolution global maps of 21st-century forest cover change. Science, 342 (6160), p. 850-853. doi: 10.1126/science.1244693 Planetary-scale demonstration
  10. Google • Timelapse world.time.com/timelapse Research • Multitemporal settlement and population

    mapping1 • Mapping woody vegetation change2 • Distribution and dynamics of mangrove forests in S Asia3 • Assessment of fire effects on meadows in Yosemite4 • Detecting industrial oil palm plantations on Landsat5 • Earth’s surface water change over the past 30 years6 • Tracking changes in critical tiger habitat7 1. Patel et al., 2015. http://dx.doi.org/10.1016/j.jag.2014.09.005 2. Johansen et al., 2015. http://dx.doi.org/10.1016/j.rsase.2015.06.002 3. Giri et al., 2015. http://dx.doi.org/10.1016/j.jenvman.2014.01.020 4. Soulard et al., 2016. http://dx.doi.org/10.3390/rs8050371 5. Lee et al., 2016; http://dx.doi.org/10.1016/j.rsase.2016.11.003 6. Donchyts et al., 2016. http://dx.doi.org/10.1038/nclimate3111 7. Joshi et al., 2016. http://dx.doi.org/10.1126/sciadv.1501675 Growing number of diverse applications
  11. Assessment of burn severity and vegetation conditions on the San

    Carlos Apache Reservation Roy Petrakis, Zhuoting Wu, Miguel Villarreal, Robert Hetzler (BIA), Barry Middleton, Laura Norman  Using GEE to quantify burn severity and multitemporal vegetation conditions in areas which experienced various fuel treatments and fire  GEE script to produce the differenced Normalized Burn Ratio (dNBR) and Multitemporal Kauth Thomas (MKT) transformation rasters  For MKT, each band for two stacked dates is summed by the values of the other bands, which are multiplied by coefficients  Each script uses Landsat 8 surface reflectance imagery provided within GEE Creek Fire – Extended dNBR Applications in the USGS
  12. A forward-looking, national-scale remote sensing-based methodology for quantifying tidal marsh

    biomass Kristin Byrd1, Laurel Ballanti1, Dung Nguyen1, Marc Simard2, Nathan Thomas2, Lisamarie Windham-Myers1 1USGS, Menlo Park, CA, [email protected]; 2NASA JPL, Pasadena, CA; Vegetation sampled in 6 estuaries: SF Bay; Puget Sound; Chesapeake Bay; Mississippi Delta; Cape Cod; Everglades GEE usage: - Landsat 5, 7, 8 surface reflectance - for each plot: - extract pixel spectral bands, cfmask, QA bands for images taken ±16 days of sample date - append metadata (Landsat scene date, row, path; LEDAPS version) - calculate vegetation indices - export output as CSV file (~12400 rows) Post-processing of GEE output in relational database: - to overcome drawbacks of GEE: erratic response time, random server-side failures - filter out pixels whose cfmasks or QA bands indicate the presence of clouds, cloud shadows, or snow - where multiple pixels (from different scenes) were available for a single plot sampling, filter out redundancy based on estuary-specific criteria Applications in the USGS
  13. Assessing vegetation recovery at abandoned oil and gas pads across

    the Colorado Plateau Eric Waller, Miguel Villarreal, Travis Poitras, Michael Duniway, Travis Nauman • 510 well sites in CO, NM, UT • Creation of Landsat 5 imagery time series (1984 – 2011), including data quality assurance, landcover masking, buffer delineation, and vegetation index calculation • Extraction of values at well pad and reference areas Applications in the USGS
  14. Tracking the phenology of dryland forests after wildfires Jessica Walker,

    Jesslyn Brown, Joel Sankey, Cynthia Wallace, Jake Weltzin (US Nat’l Phenology Network) Dude fire (1990) Low Med High Severity Sample 1982 – 2016 Landsat archive at defined points in GEE High- severity fires in ponderosa pine areas Analysis of derived phenology patterns Applications in the USGS
  15. Mapping for Water Use and Availability Using Google Earth Engine

     Evapotranspiration (ET) is a major water budget component in the hydrologic cycle  Landsat mapping techniques enable crop water use estimates across landscapes and through time  The Earth Engine API enables broad-scale Landsat ET modeling development in an efficient, operational processing capacity in support of National Water Census objectives. Team Gabriel Senay (Co-I), USGS James Verdin (Co-I), USGS Mac Friedrichs, SGT, Inc. Justin Huntington, DRI Charles Morton, DRI Earth Resources Observation and Science (EROS) Center Applications in the USGS
  16. Imperial, NE irrigation 2015 Total Actual ET from Landsat (Preliminary)

    Simplified Surface Energy Balance (SSEBop) Model ET Applications in the USGS Mapping for Water Use and Availability, cont’d
  17. Global Crop Map Prasad Thenkabail, Jun Xiong Applications in the

    USGS https://croplands.org Temporal and spatial analysis of Landsat and MODIS data to classify the world’s croplands: • Cropland/non-cropland • Irrigated/rainfed • Crop type • Cropping intensity
  18. Global Hyperspectral Imaging Spectral-Library of Agricultural Crops (GHISA) to Characterize,

    Model, Map, and Monitor the Eight Leading Agricultural Crops of the World Itiya Aneece*, Prasad Thenkabail, Terrance Slonekar, Alfredo Huete *Mendenhall Postdoc, [email protected]  Using GEE to  Preprocess Hyperion Imagery  Extract spectra from known crop locations  Spectrally subset imagery  Calculate vegetation indices to estimate crop characteristics  Establishing methods of hyperspectral data analysis to address global food security  Global Hyperspectral Imaging Spectral-Library of Agricultural Crops (GHISA)  Overcoming data redundancy by choosing most informative and unique bands  Comparing hyperspectral narrowbands and multispectral broadbands in estimating crop characteristics Applications in the USGS
  19. Pros / cons of GEE use Pros • No downloading

    or local storage of imagery • Access to petabytes of data; more on the way • Google computing power >> fast analyses
  20. Pros / cons of GEE use Pros • No downloading

    or local storage of imagery • Access to petabytes of data; more on the way • Google computing power >> fast analyses Cons • Some programming required • Dependent on an internet connection • Primary focus on raster-based imagery • Lack of mature and detailed documentation
  21. Pros / cons of GEE use Pros • No downloading

    or local storage of imagery • Access to petabytes of data; more on the way • Google computing power >> fast analyses Cons • Some programming required • Dependent on an internet connection • Primary focus on raster-based imagery • Lack of mature and detailed documentation Slightly unnerving • Dependent on Google’s good graces
  22. Why is Google doing this? Organize the world’s scientific information

    and make it universally accessible and useful • Remove access and capacity barriers • Foster open science • Promote transparency, reproducibility, and collaboration http://geotrendr.ceoas.oregonstate.edu/2015/02/08/googles-noel-gorelick-public-lecture/
  23. How to start using GEE Register for an account: https://earthengine.google.com/signup

    Signing up with an @usgs.gov account limits access to GEE forum and vector file integration (fusion tables) Create a GEE/work-specific gmail account (e.g., <your name>[email protected])
  24. General overview: https://earthengine.google.com/faq/ More detailed introduction: https://developers.google.com/earth-engine/ (Don’t miss the

    “How Earth Engine works” section at the bottom) Fusion tables: https://support.google.com/fusiontables#topic Developers forum: https://groups.google.com/forum/#!forum/google-earth-engine-developers USGS GEE forum: https://groups.google.com/forum/#!forum/gee-users-forum GEE User Summit 2016 Training Sessions: https://www.youtube.com/playlist?list=PLWw80tqUZ5J9_3E_9C_bK8zt0mGHfvOrj Resources