Upgrade to Pro — share decks privately, control downloads, hide ads and more …

Time Series Classification Based on Visualization of Recurrence Plots

Exactpro
PRO
November 08, 2019

Time Series Classification Based on Visualization of Recurrence Plots

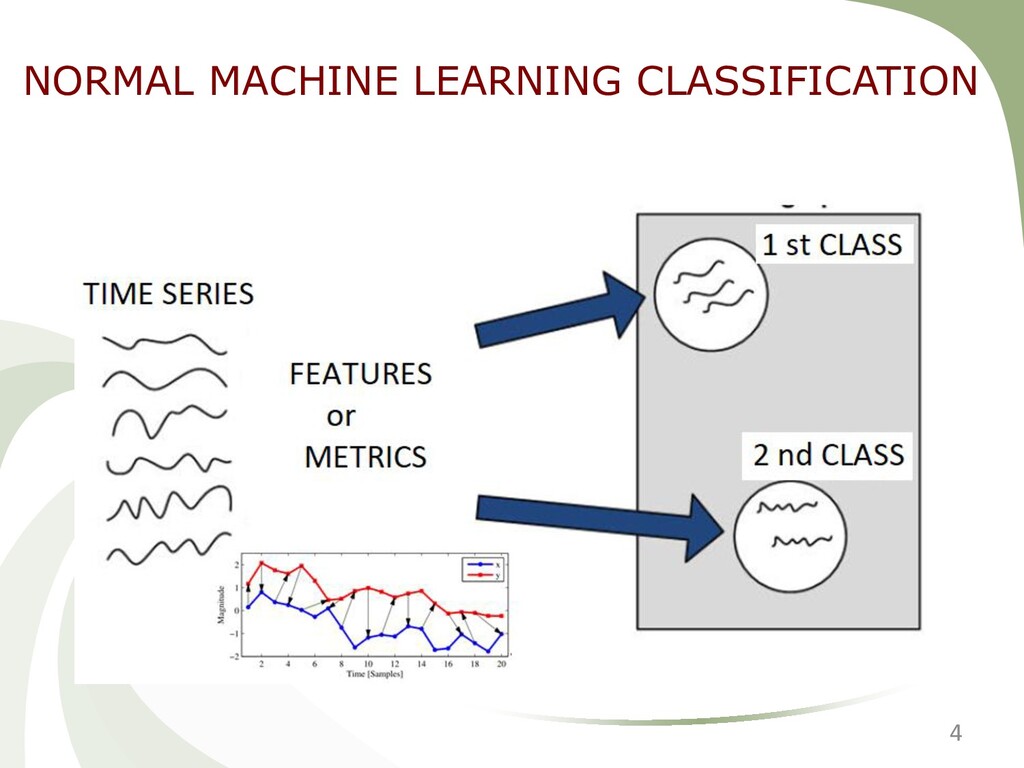
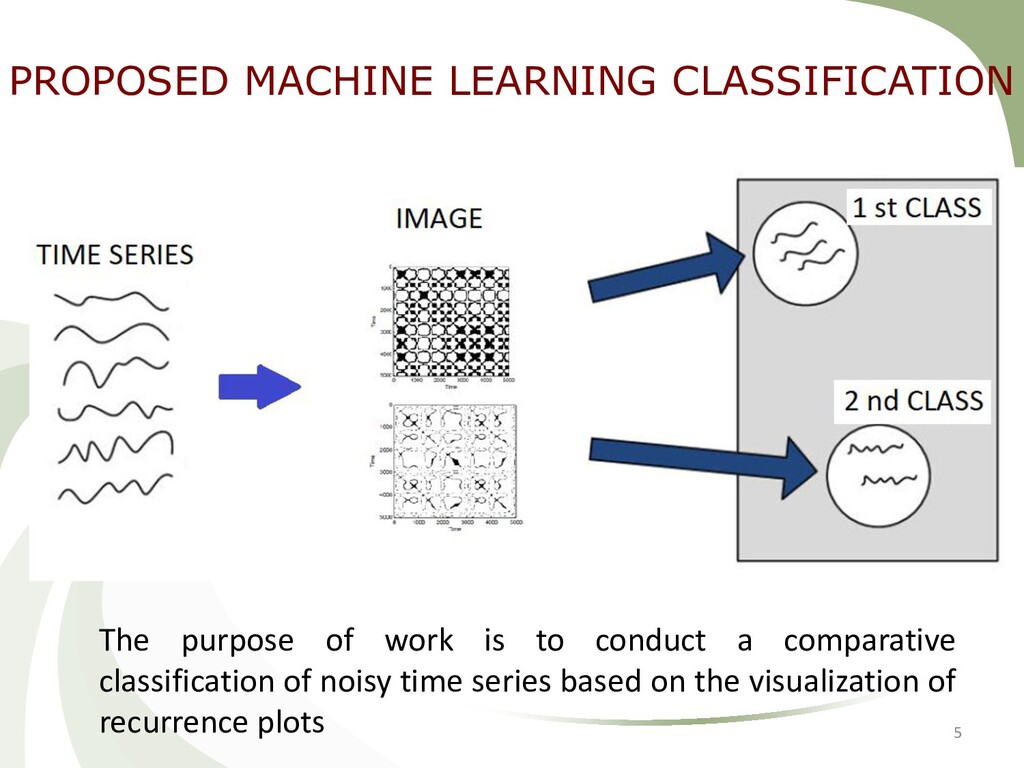
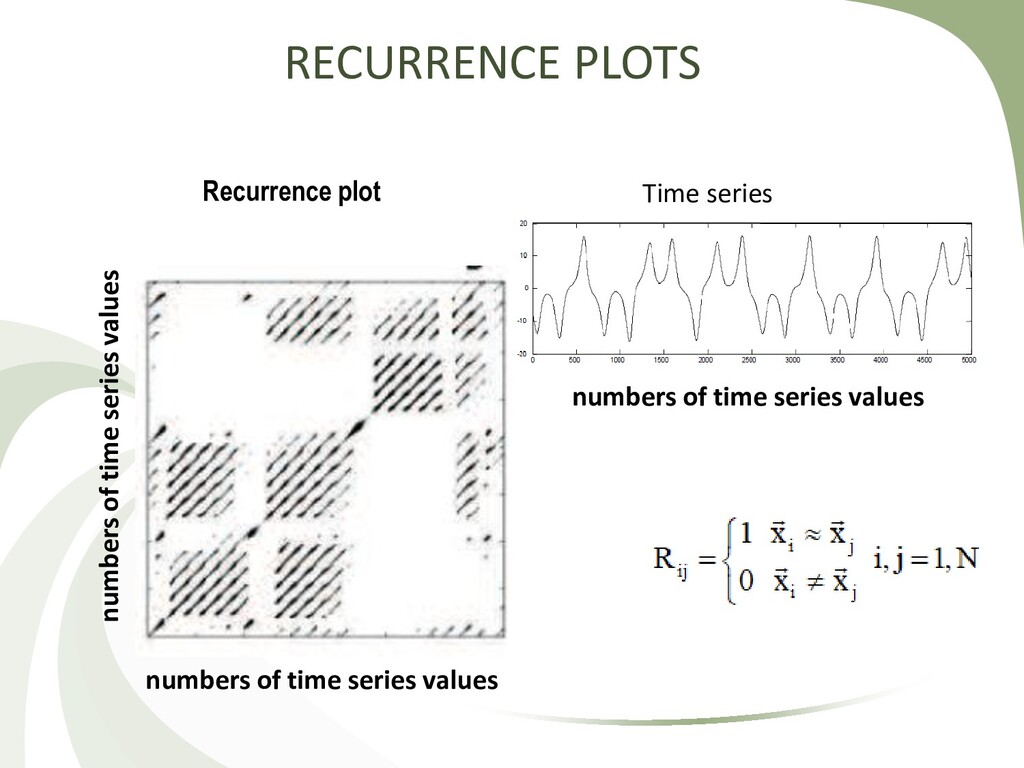
Lyudmyla Kirichenko and Petro Zinchenko

International Conference on Software Testing, Machine Learning and Complex Process Analysis (TMPA-2019)
7-9 November 2019, Tbilisi

Video: https://youtu.be/V5JYJmEzSog

TMPA Conference website https://tmpaconf.org/
TMPA Conference on Facebook https://www.facebook.com/groups/tmpaconf/

Exactpro
PRO

November 08, 2019
Tweet

More Decks by Exactpro

Other Decks in Technology

Transcript

  1. Time series classification based on
    visualization of recurrence plots
    Lyudmyla Kirichenko, Petro Zinchenko
    Kharkiv National University of Radio Electronics, Kharkiv, Ukraine

    View Slide

  2. OUTLINE
    1. TASK OF TIME SERIES CLASSIFICATION
    2. CLASSIFICATION BY RECURRENCE PLOTS
    3. DESCRIPTION OF THE EXPERIMENT
    4. RESULTS OF CLASSIFICATION
    5. APPLICATION TO DETECT DDOS ATTACKS
    2

    View Slide

  3. TIME SERIES:CLASSIFICATION TASK
    2000 4000 6000 8000
    250
    500
    750
    1000
    1250
    1500
    Medical and biological signals Financial time series
    Network traffic
    Geophysical signals
    3

    View Slide

  4. 4
    NORMAL MACHINE LEARNING CLASSIFICATION

    View Slide

  5. 5
    The purpose of work is to conduct a comparative
    classification of noisy time series based on the visualization of
    recurrence plots
    PROPOSED MACHINE LEARNING CLASSIFICATION

    View Slide

  6. RECURRENCE PLOTS
    Time series
    Recurrence plot
    numbers of time series values
    numbers of time series values
    numbers of time series values

    View Slide

  7. RECURRENCE PLOTS
    Simple sinusoid realization

    View Slide

  8. Complex oscillating realizations
    RECURRENCE PLOTS

    View Slide

  9. RECURRENCE PLOTS
    Noise realizations

    View Slide

  10. 10
    The convolutional neural network is a class of deep learning neural
    networks. CNNs represent a huge breakthrough in image recognition.
    They are most commonly used to analyze visual imagery
    EXPERIMENT

    View Slide

  11. EXPERIMENT
    11
    Python with libraries that implement machine learning
    methods was used. The training of models for each class
    was conducted on 200 (100 and 100 for every class)
    examples of time series and tested on 50 test cases. The
    classification was performed for time series with
    different lengths, the main attention was paid to the
    series of length 256 values.
    For each time series, recurrence plots were constructed
    that were the input of the neural network.

    View Slide

  12. EXPERIMENT: NEURAL NETWORK
    12
    The ReLU non-linearity is applied to the output of every convolutional and fully-
    connected layer. For training the network was used Adam is an adaptive learning
    rate optimization algorithm
    Our convolutional neural network

    View Slide

  13. INPUT DATA: TIME SERIES
    13
    Time realization is sum of a sinusoid and noise component:
    (t) (t) z(t)
    X Y
      ,
    where Y(t) is time series, z(t) – additive noise.
    As a value characterizing the ratio of signal to noise, the coefficient Snr was used
    [Y(t)]/ [z(t)]
    Snr S S
     ,
    where S is standard deviation.

    View Slide

  14. 14
    The input time series were split into two classes. The first class consisted of sinus-
    oids, for which the frequencies varied in the range 2
    f fR
     , for the second class the
    frequency range was 2
    f fR
     . The frequency choice to the sine wave from the ranges
    1
    f fR
     and 2
    f fR
     was carried out randomly. The values 1
    f , 2
    f , fR , and
    1 2
    Fdist f f
      varied during the experiment.
    INPUT DATA: TIME SERIES

    View Slide

  15. 15
    INPUT DATA: TIME SERIES
    1st class
    2nd class
    1
    Snr  0.7
    Snr  0.4
    Snr 

    View Slide

  16. 16
    INPUT DATA: RECURRENCE PLOTS

    View Slide

  17. 17
    EXPERIMENT
    Example of part of sample recurrence plots

    View Slide

  18. 18
    Noise level Snr Accuracy Number of
    epochs
    Without noise 0.9999 8
    1 0.992 10
    0.7 0.967 14
    0.6 0.945 17
    0.5 0.778 24
    0.4 0.66 29
    EXPERIMENT: RESULTS

    View Slide

  19. 19
    2 classes: normal traffic and
    attacked traffic
    Binary classification task:
    DDoS attacks detection

    View Slide

  20. 20
    ( ) ( ) ( )*
    A A
    T t T t A t level
     
    DATA: ATTACKED AND NORMAL TRAFFICS
    Attacked traffic is sum of
    normal traffic and attack:

    View Slide

  21. 21
    RECURRENCE PLOTS of ATTACKED AND
    NORMAL TRAFFICS

    View Slide

  22. RESULTS
    22
    Attack level Accuracy
    20% 0.84
    30% 0.92
    40% 0.97
    Dependence on attack level

    View Slide

  23. • Method for classifying time series based on the construction
    of recurrence plots using the simple architecture of a
    convolutional neural network have been investigated.
    • A comparative analysis of the classification of noisy time
    series was carried out.
    • The results showed that the considered method has a fairly
    high classification accuracy even with a large degree of noise.
    • The results of the work can be used for the classification of
    time series of stochastic type by machine learning methods.
    23
    CONCLUSION

    View Slide

  24. Thanks for your attention
    24

    View Slide