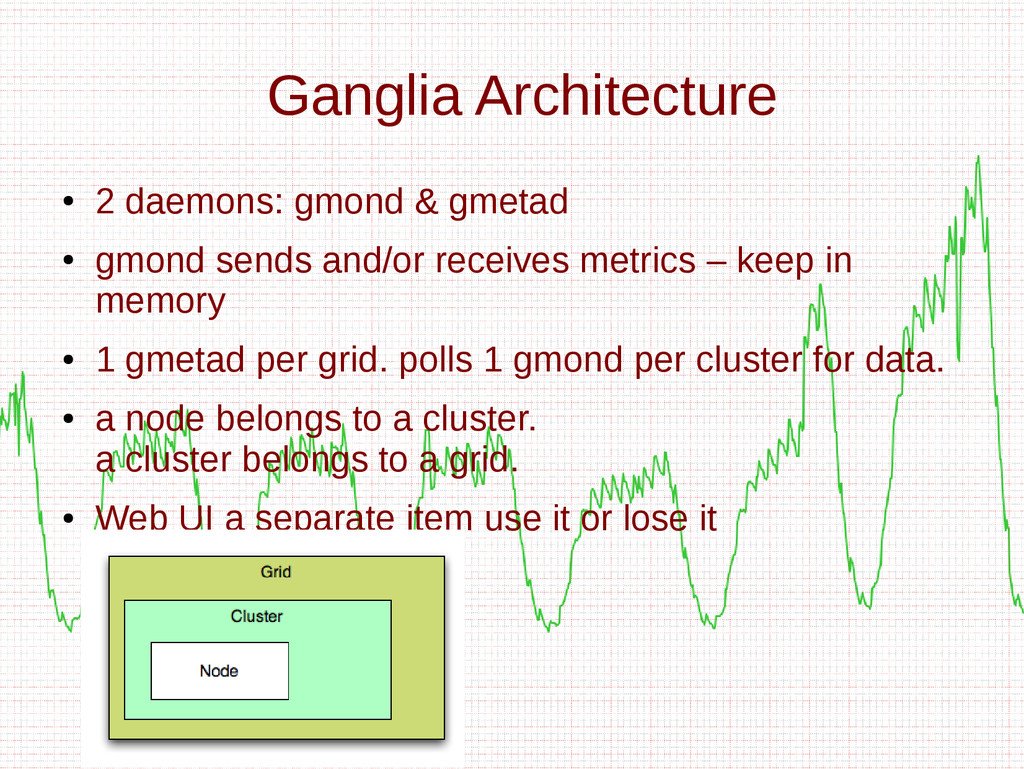
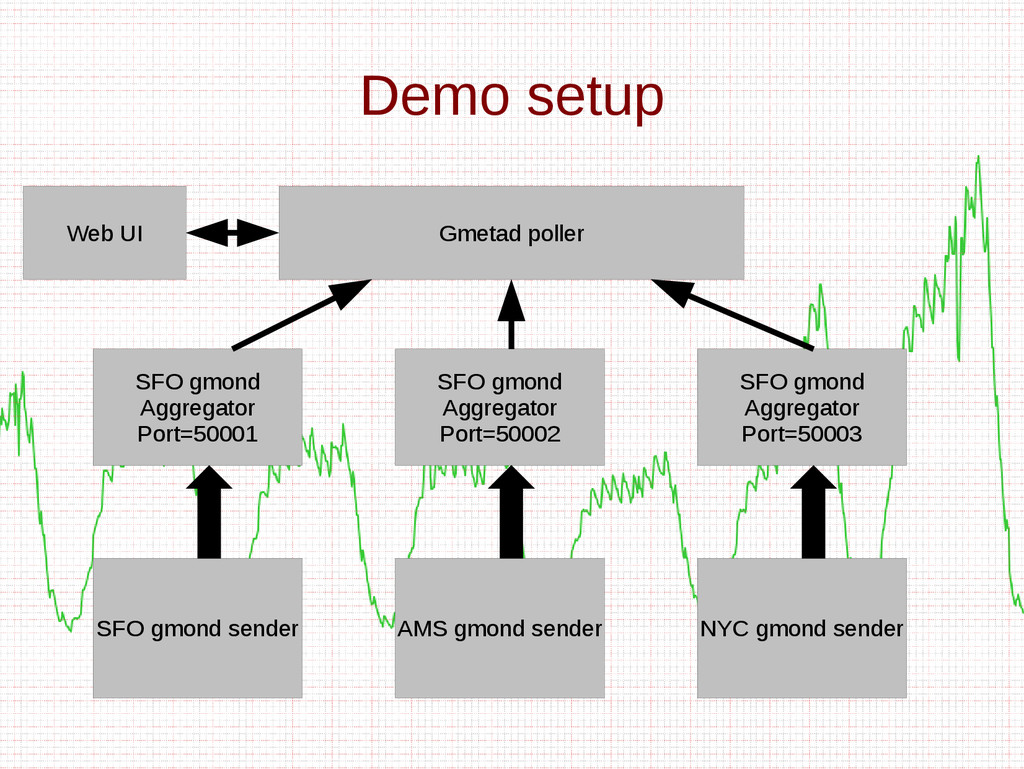
June 24, 2014. At Velocity 2014, Fastly engineer Vladimir Vuksan gave an intro to Ganglia concepts (grid, clusters, hosts) as well as an installation of a sample monitoring grid. He also goes through the following commonly used visualization tools and how they may aid in detecting issues, identifying causes, and taking corrective action:
- Cluster/Grid Views
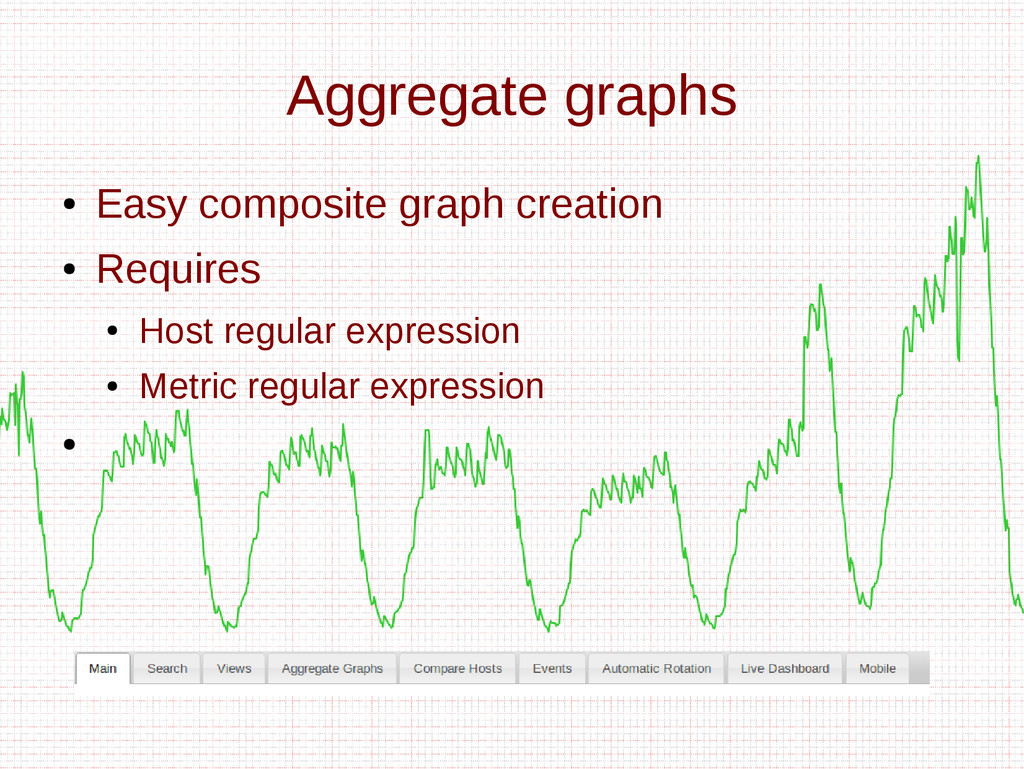
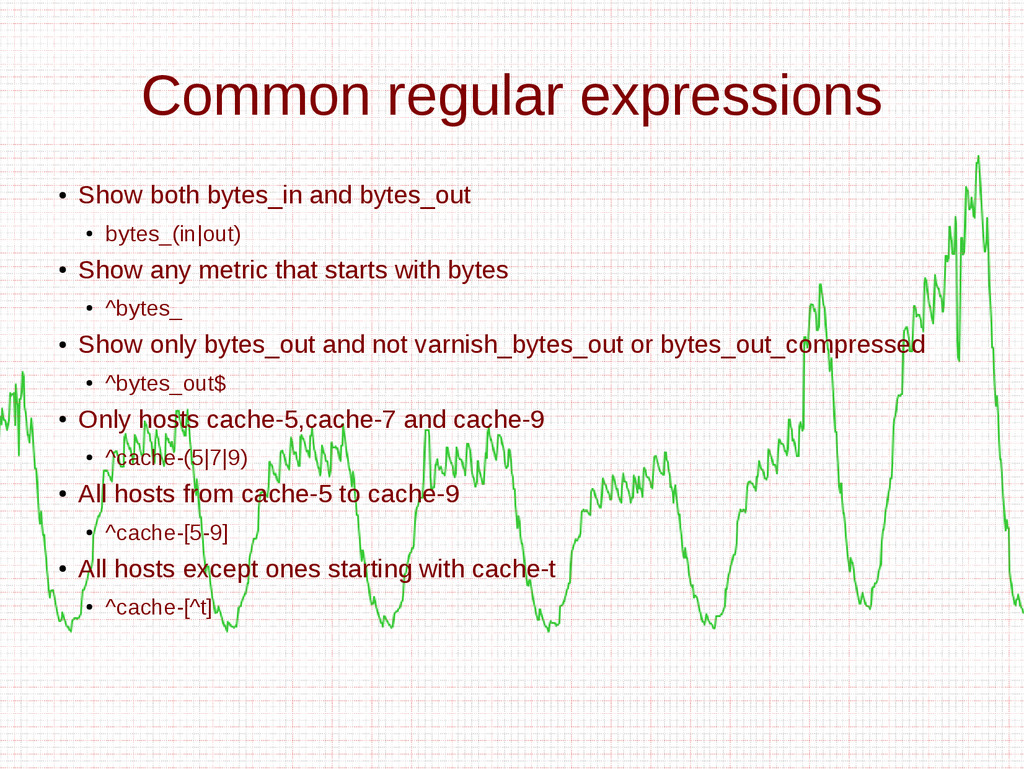
- Aggregate graphs
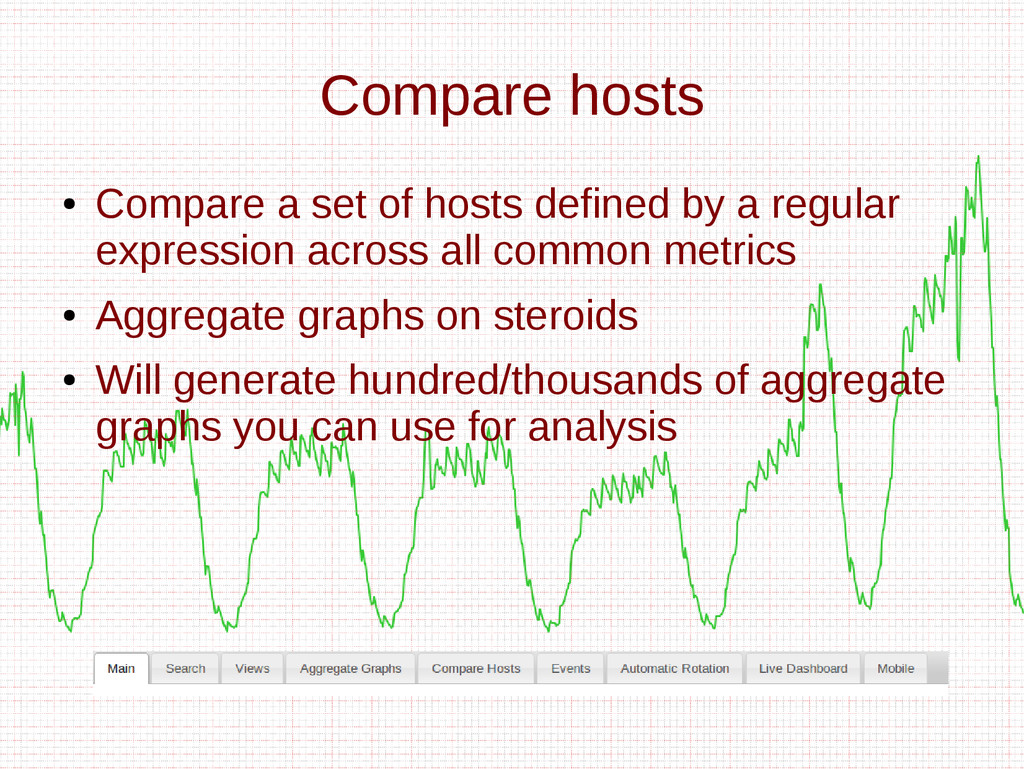
- Compare Hosts
- Custom graph functionality
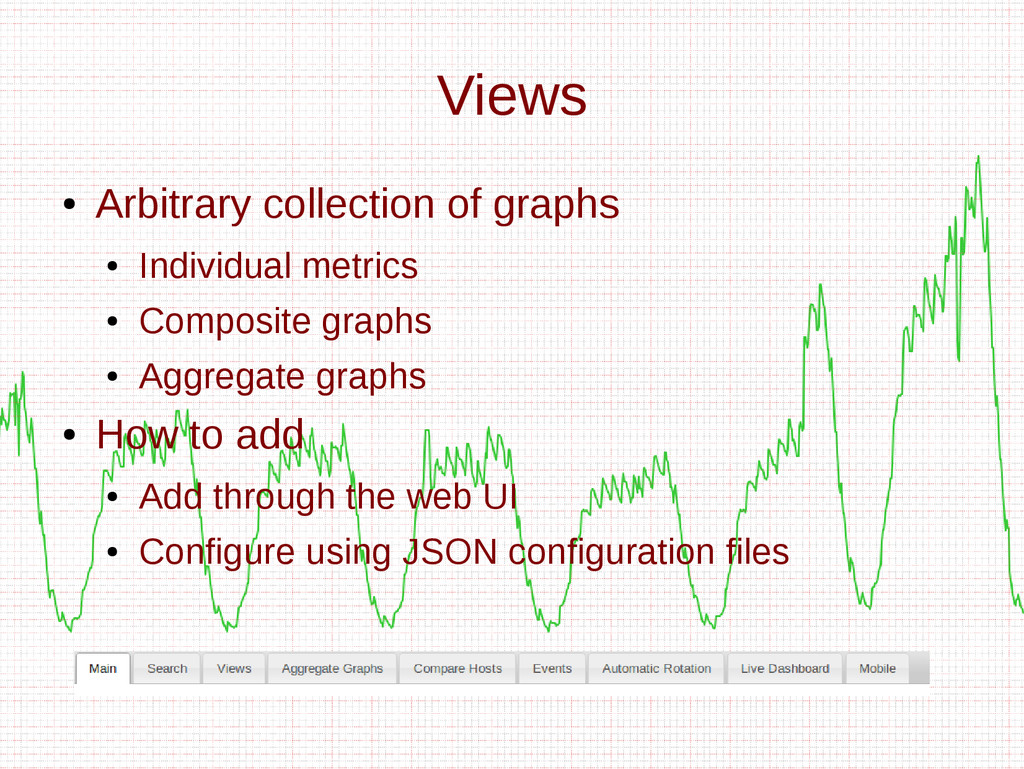
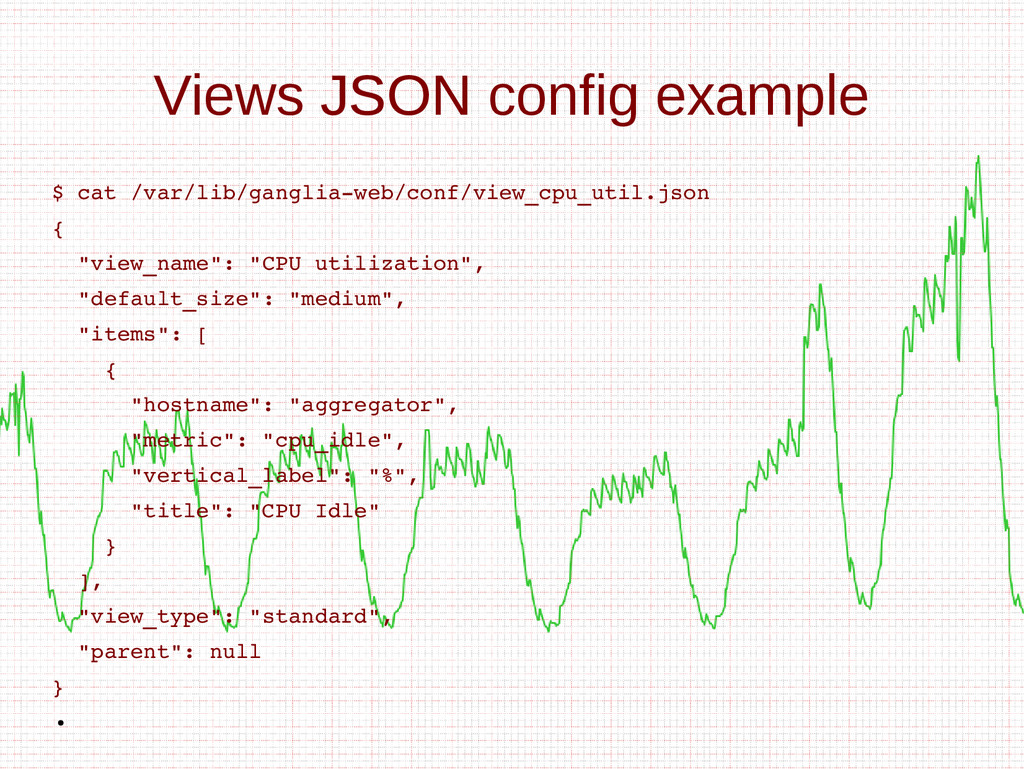
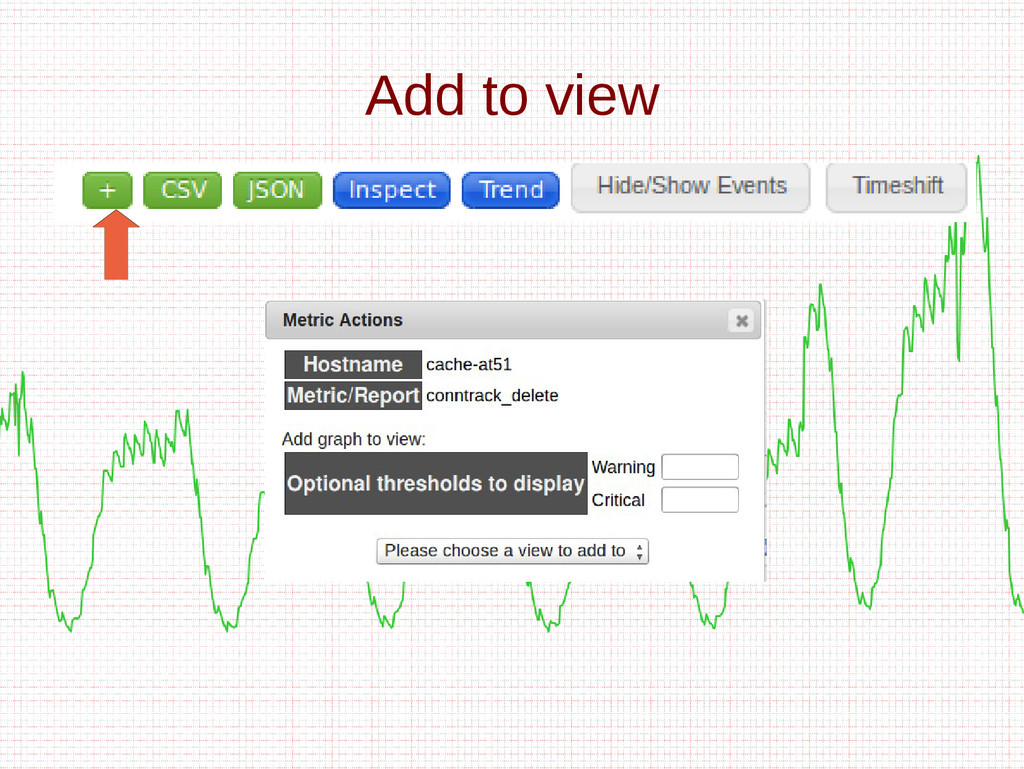
- Views
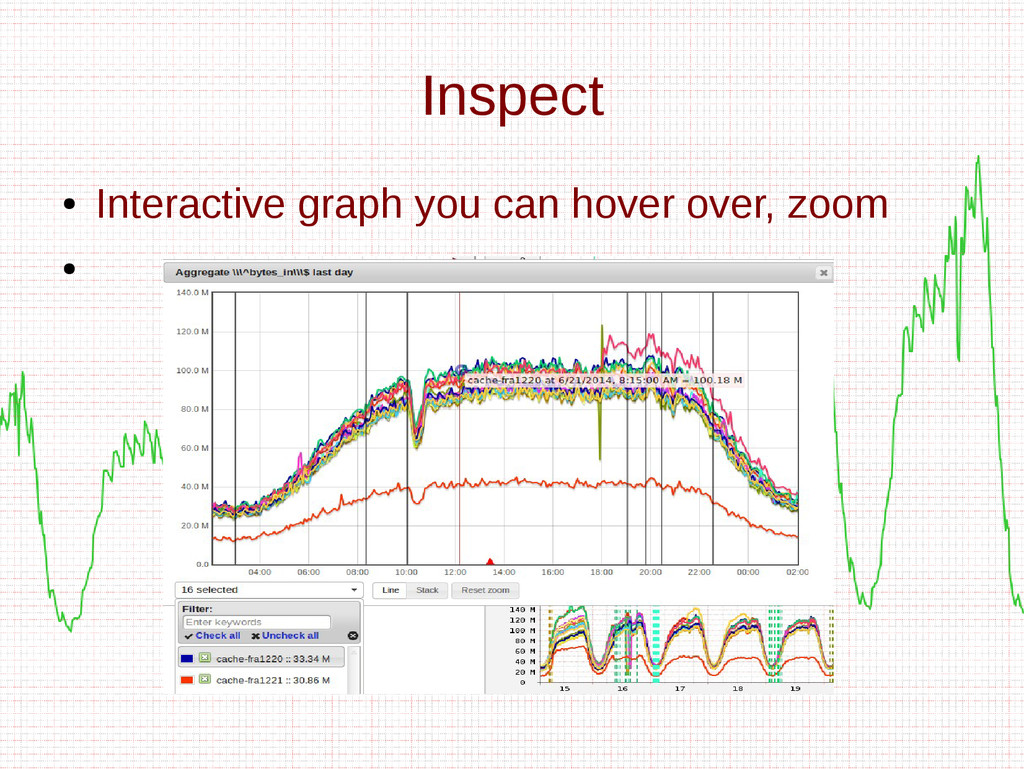
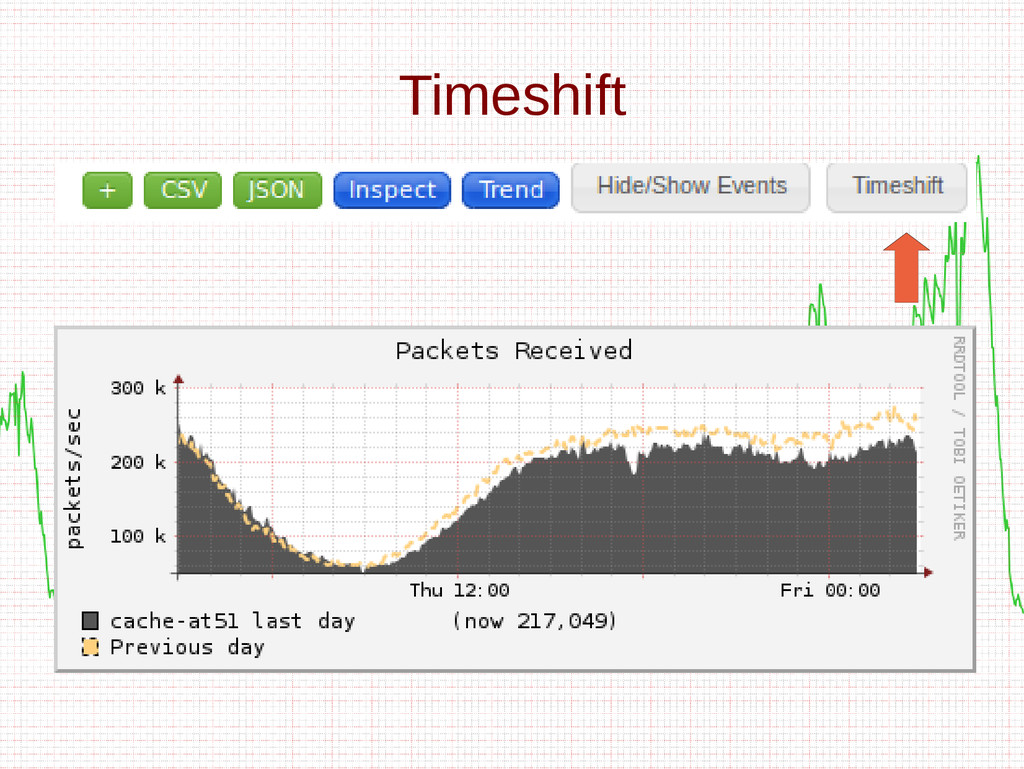
- Interactive graphs
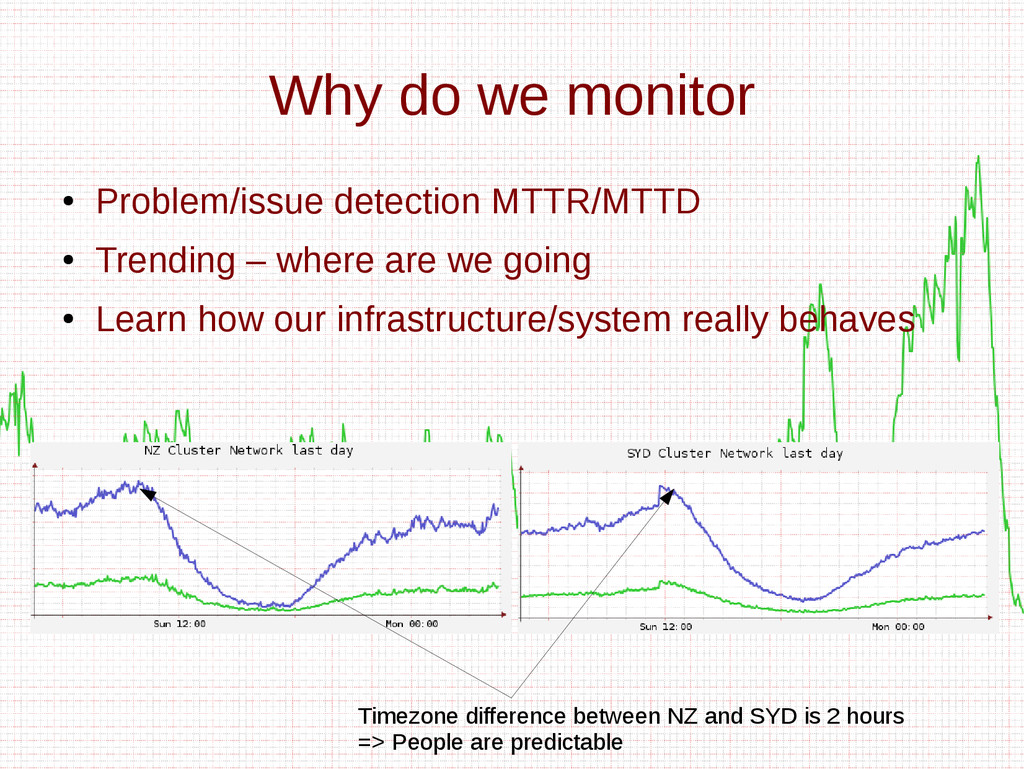
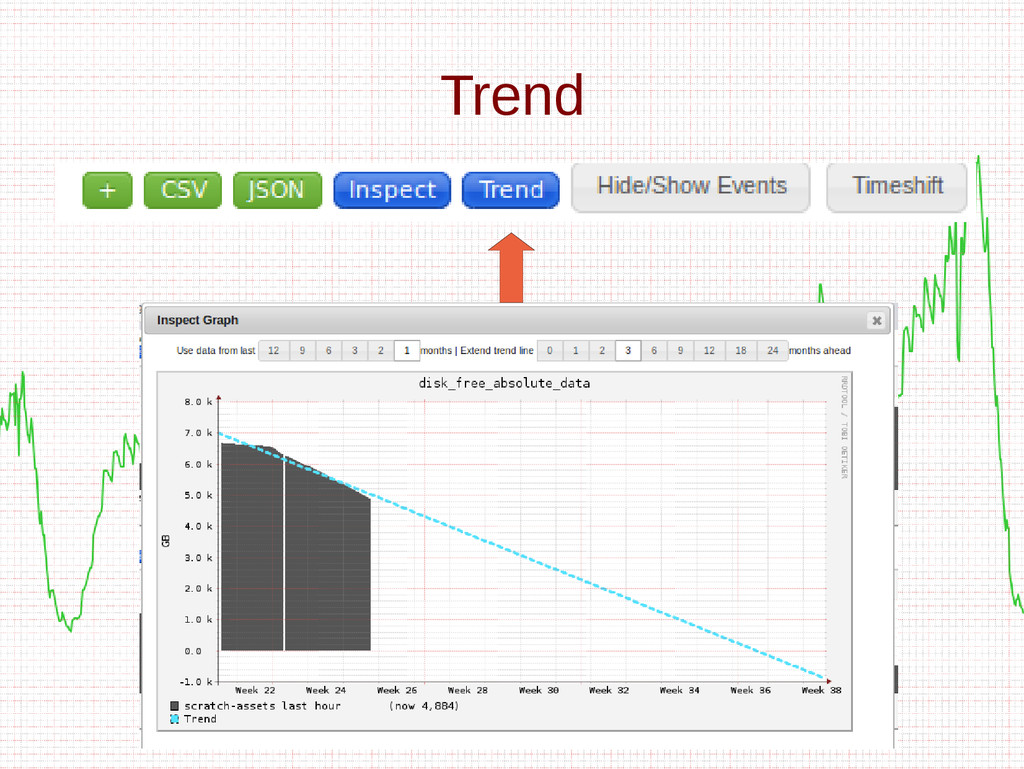
- Trending
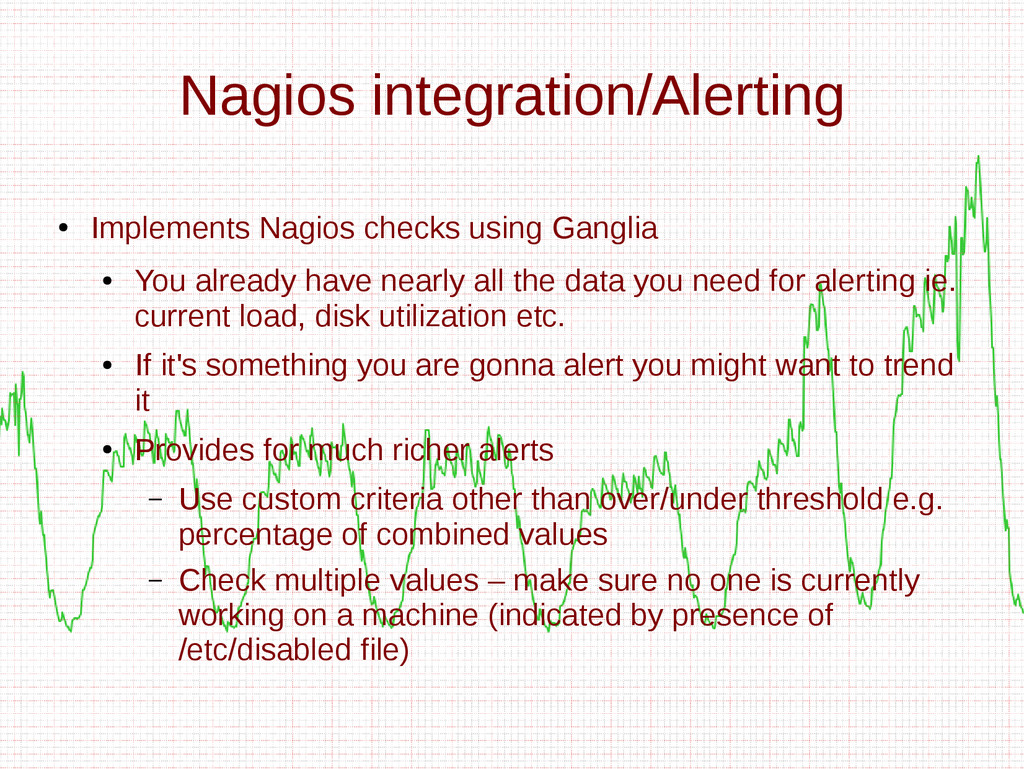
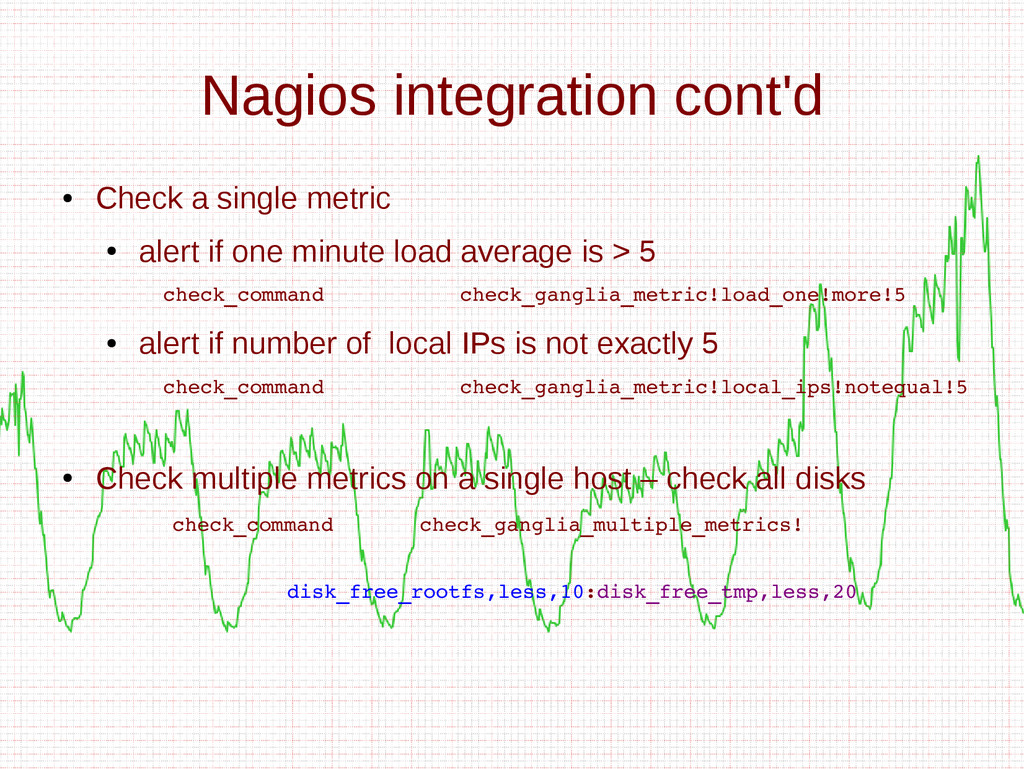
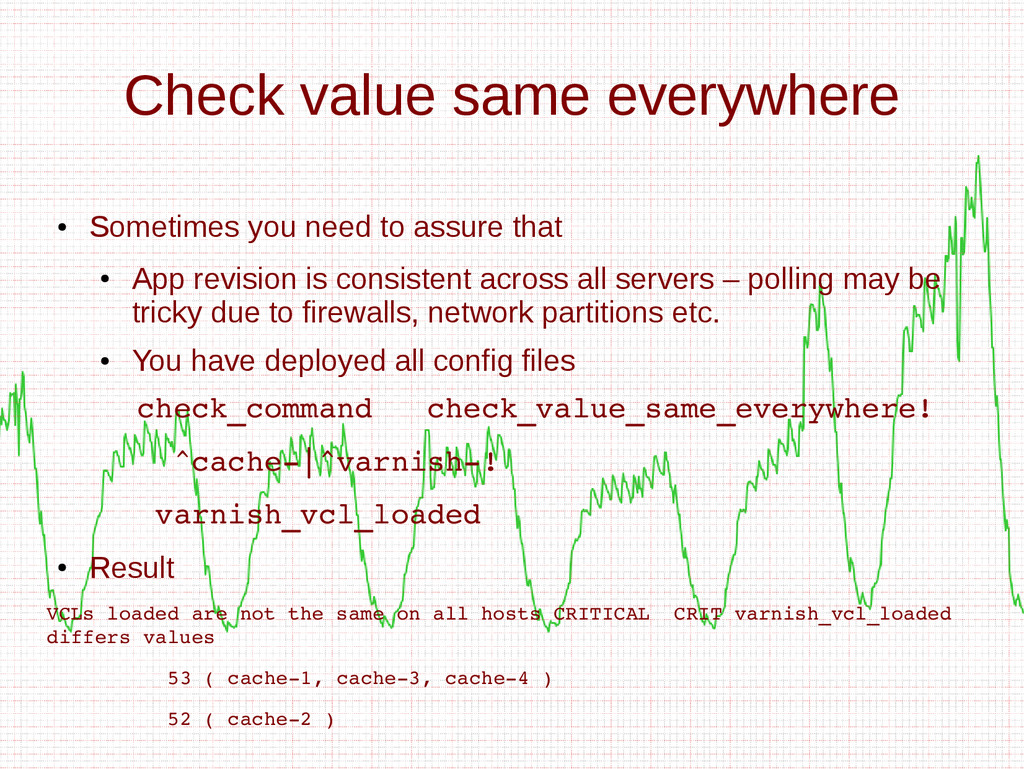
- Nagios/Alerting system integration
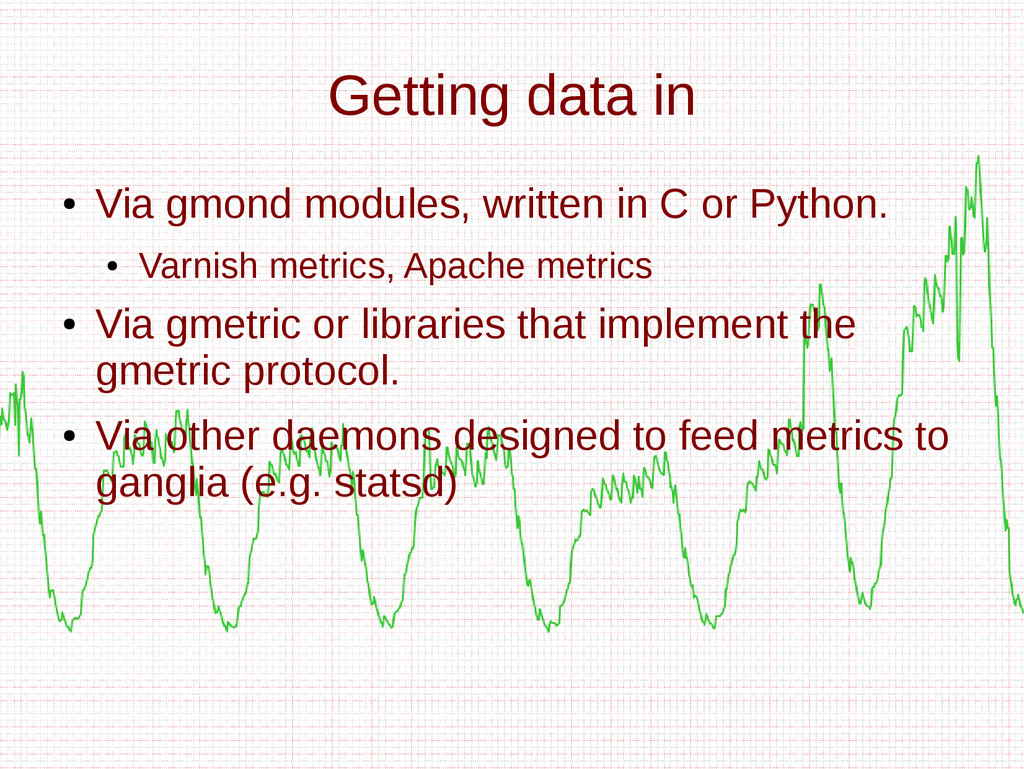
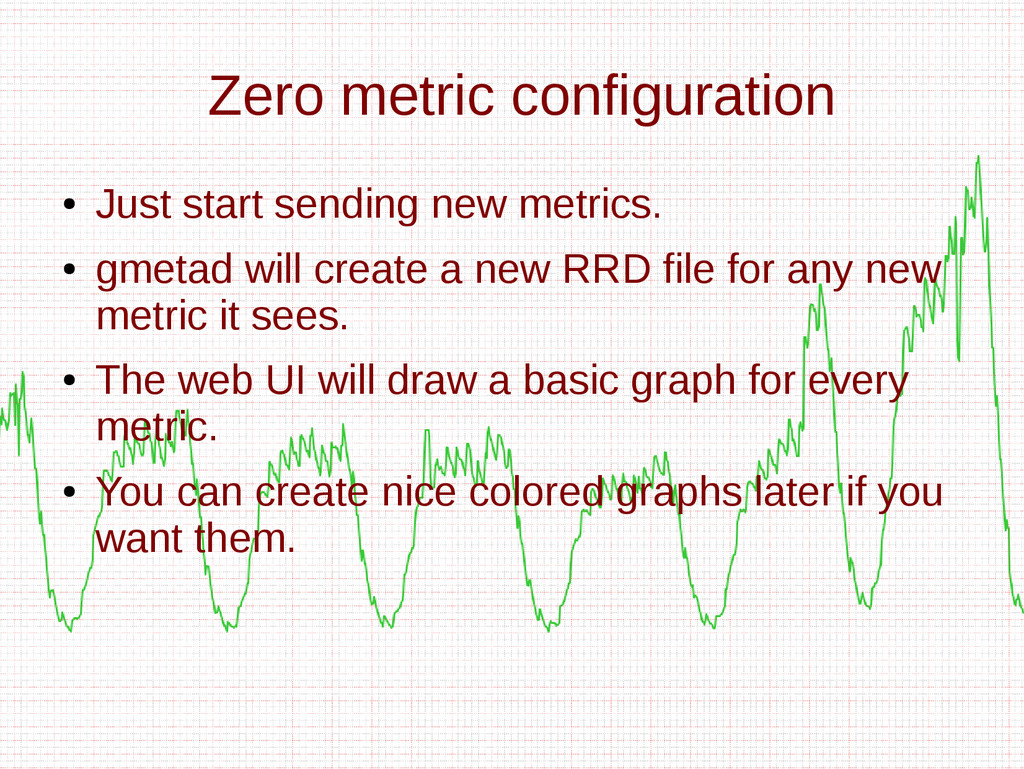
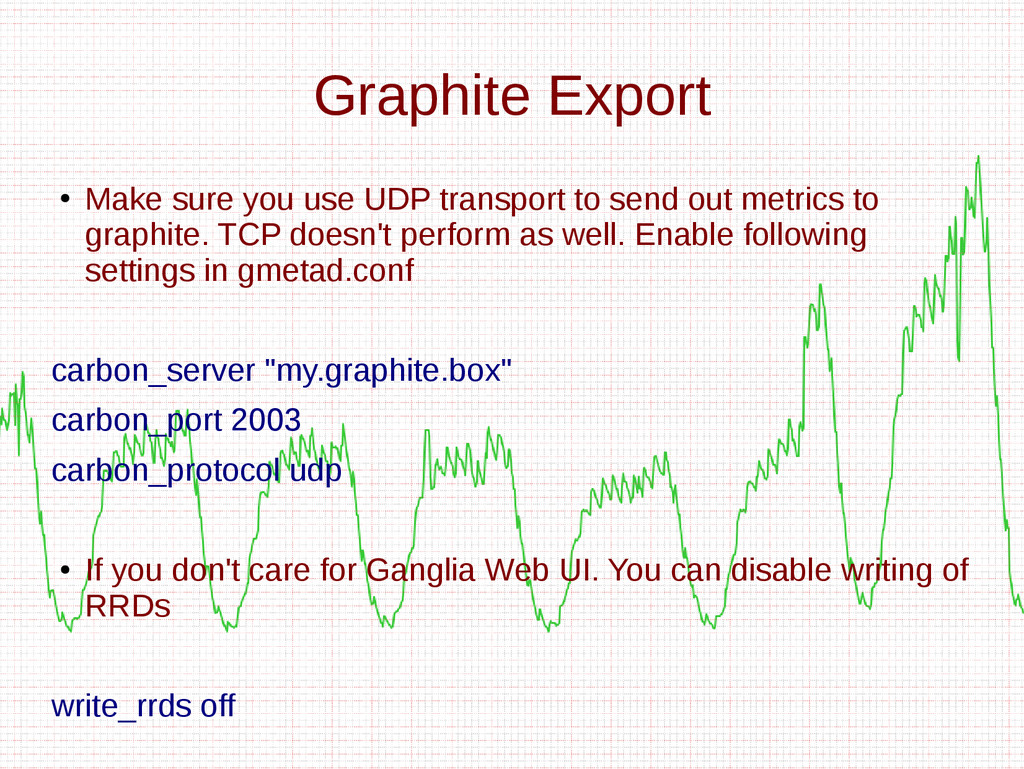
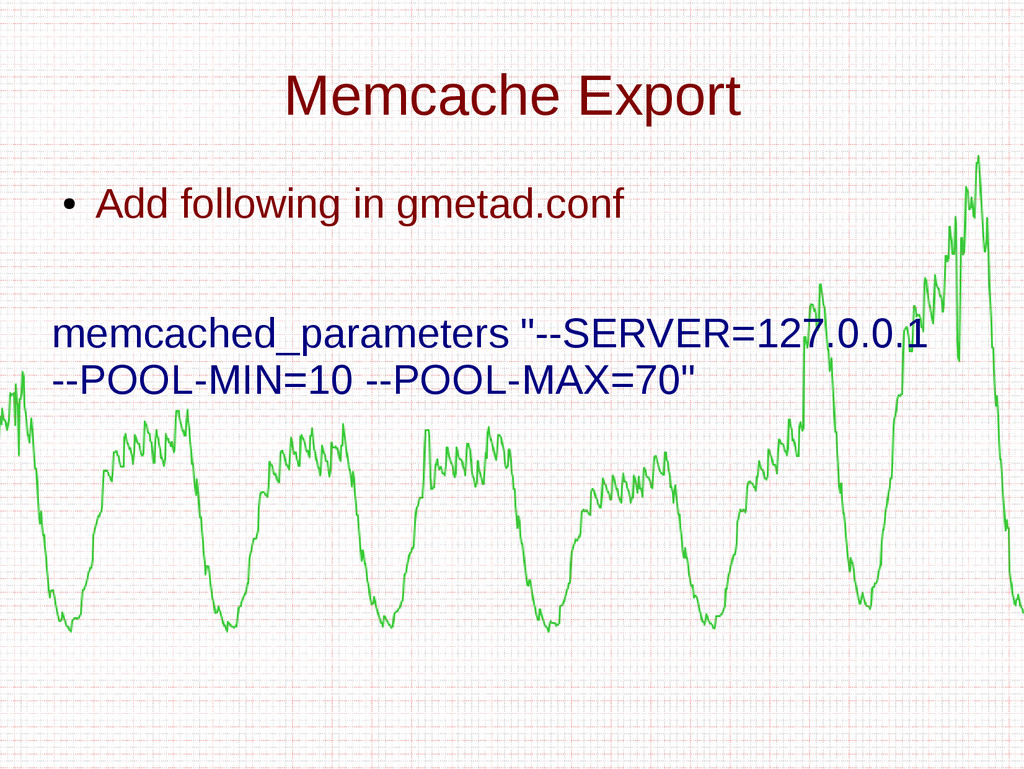
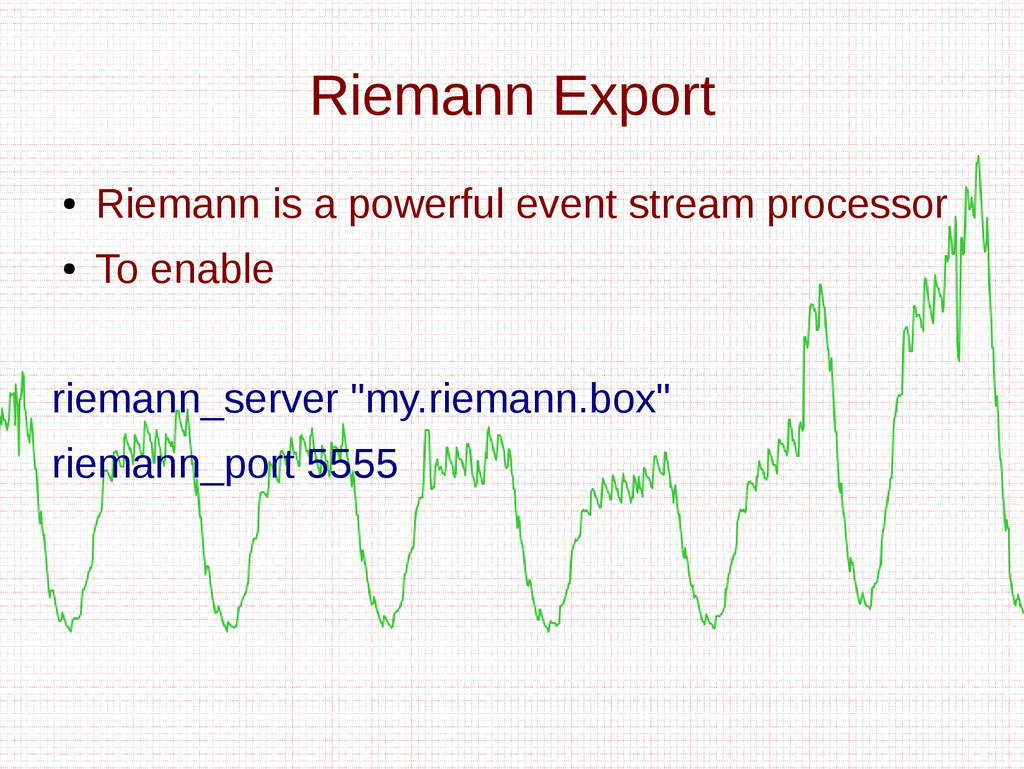
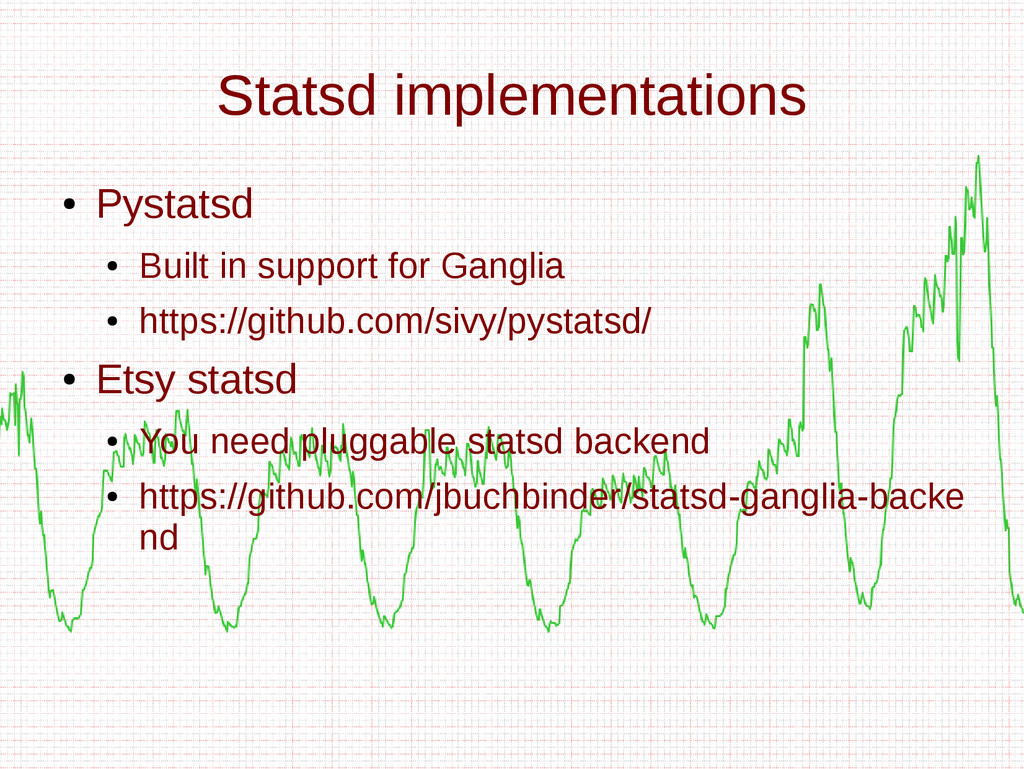
- How to add metrics to Ganglia
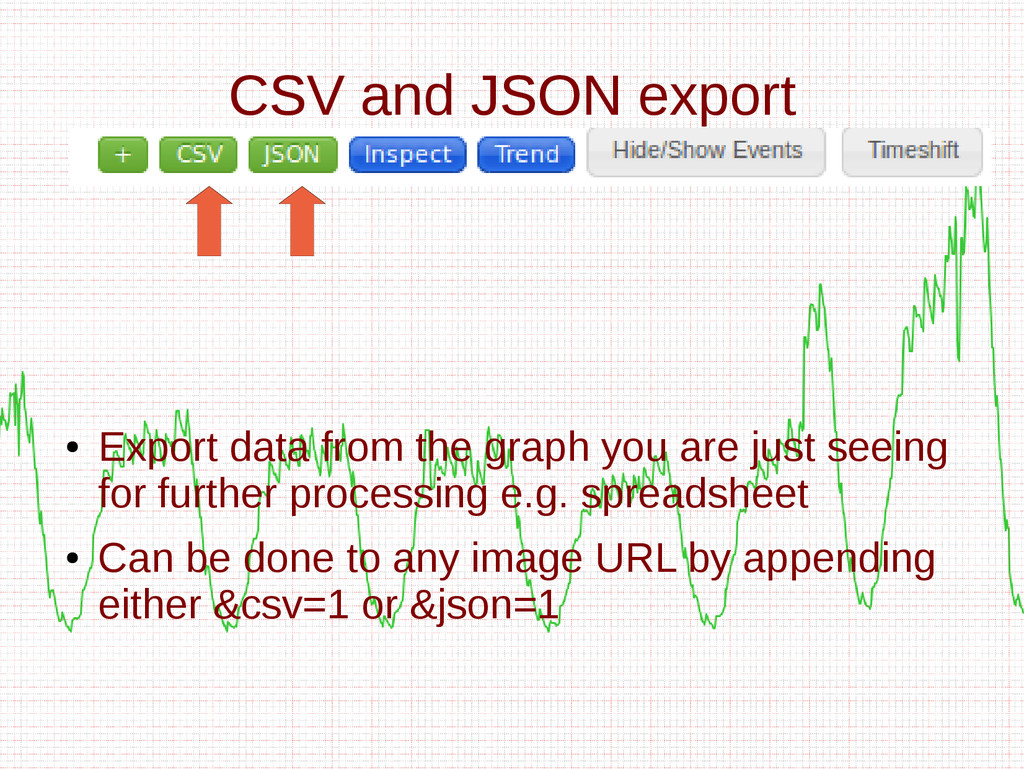
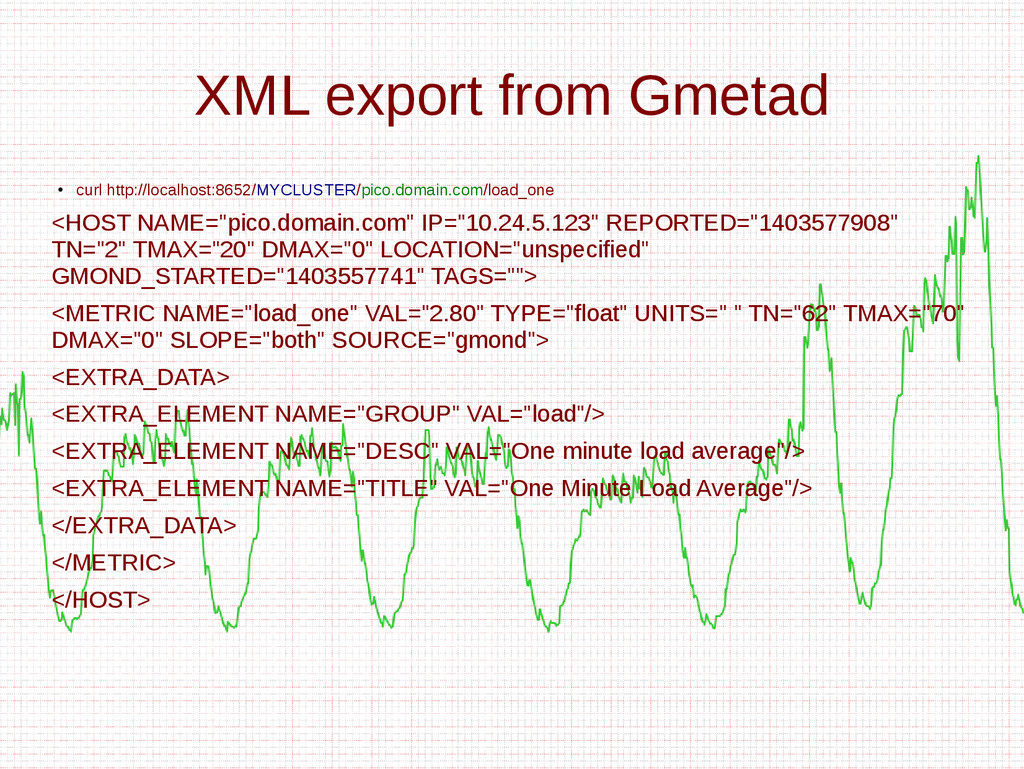
- Different export formats such as JSON, CSV, and XML
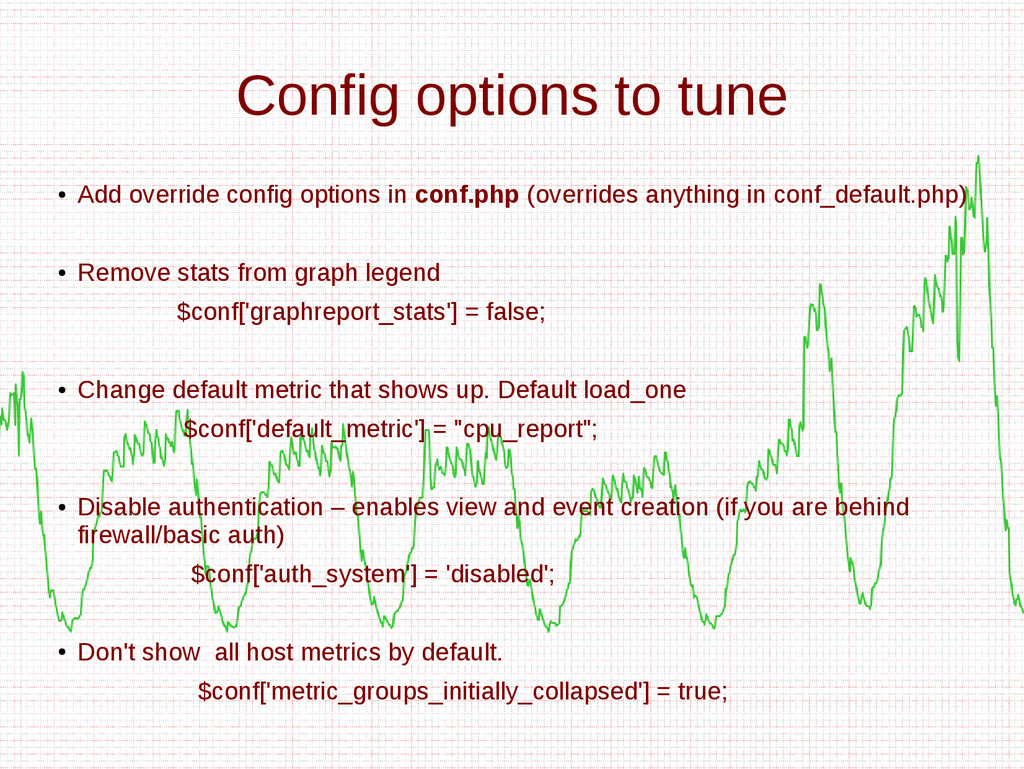
![Config options to tune • Change default time ranges $conf['time_ranges']](https://files.speakerdeck.com/presentations/2edafeb02a6101328ca732fecbd8e6ce/slide_64.jpg)