Доклад технического директора компании «Флант» (http://flant.ru/) Дмитрия Столярова на RootConf 2018 (фестиваль РИТ++) про мониторинг кластеров Kubernetes с использованием Prometheus.
* Текстовый обзор доклада: https://habr.com/company/flant/blog/412901/
* Видео с выступления: https://youtu.be/zj6SlzzBRaA
* Анонс доклада на сайте конференции: http://rootconf.ru/moscow-rit/2018/abstracts/3507
![PromQL Execute http_requests_total{host=”bar.io”, status=”2xx”}[2m] T1 T2 T3 T4 {host=”bar.io”, status=”2xx”}](https://files.speakerdeck.com/presentations/66ede28d84b84199a37c7c21a1877fe7/slide_214.jpg)
![PromQL Execute http_requests_total{host=”bar.io”, status=”2xx”}[2m] T1 T2 T3 T4 {host=”bar.io”, status=”2xx”}](https://files.speakerdeck.com/presentations/66ede28d84b84199a37c7c21a1877fe7/slide_215.jpg)
![2 min PromQL Execute http_requests_total{host=”bar.io”, status=”2xx”}[2m] T1 T2 T3 T4](https://files.speakerdeck.com/presentations/66ede28d84b84199a37c7c21a1877fe7/slide_216.jpg)
![2 min PromQL Execute http_requests_total{host=”bar.io”, status=”2xx”}[2m] T1 T2 T3 T4](https://files.speakerdeck.com/presentations/66ede28d84b84199a37c7c21a1877fe7/slide_217.jpg)
![2 min PromQL Execute http_requests_total{host=”bar.io”, status=”2xx”}[2m] T1 T2 T3 T4](https://files.speakerdeck.com/presentations/66ede28d84b84199a37c7c21a1877fe7/slide_218.jpg)
![PromQL Execute http_requests_total{host=”bar.io”, status=”2xx”}[2m] T1 T2 T3 T4 {host=”bar.io”, status=”2xx”}](https://files.speakerdeck.com/presentations/66ede28d84b84199a37c7c21a1877fe7/slide_219.jpg)
![PromQL Execute http_requests_total{host=”bar.io”, status=”2xx”}[2m] T1 T2 T3 T4 {host=”bar.io”, status=”2xx”}](https://files.speakerdeck.com/presentations/66ede28d84b84199a37c7c21a1877fe7/slide_220.jpg)
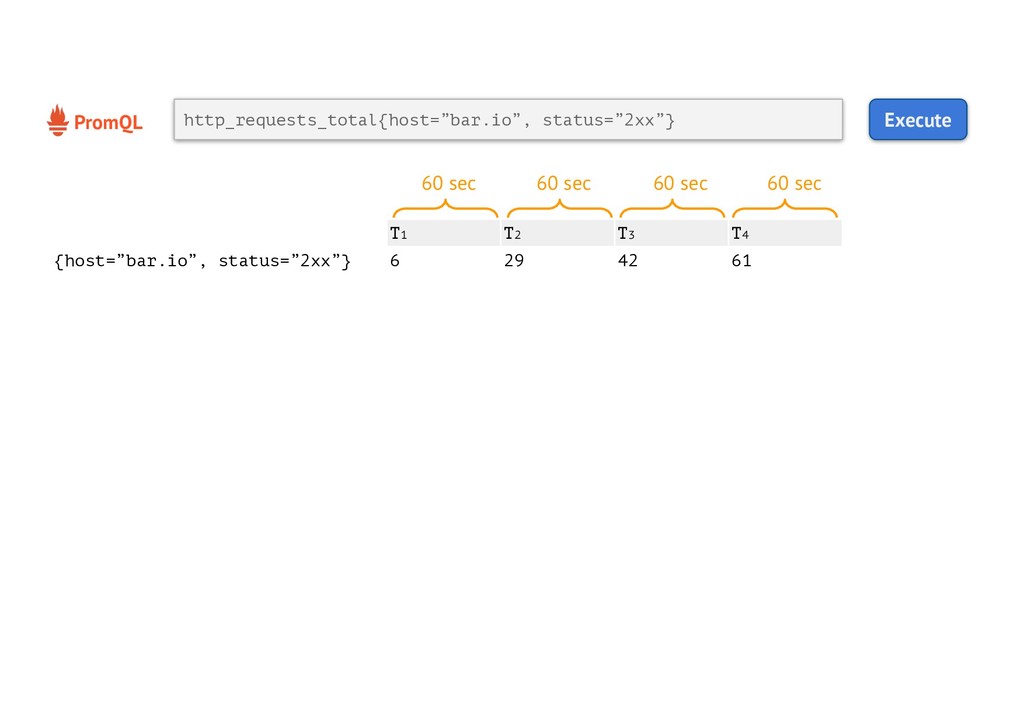
![PromQL Execute http_requests_total{host=”bar.io”, status=”2xx”}[2m] T1 T2 T3 T4 {host=”bar.io”, status=”2xx”}](https://files.speakerdeck.com/presentations/66ede28d84b84199a37c7c21a1877fe7/slide_221.jpg)
![PromQL Execute increase(http_requests_total{host=”bar.io”, status=”2xx”}[2m]) T1 T2 T3 T4 {host=”bar.io”, status=”2xx”}](https://files.speakerdeck.com/presentations/66ede28d84b84199a37c7c21a1877fe7/slide_222.jpg)
![PromQL Execute increase(http_requests_total{host=”bar.io”, status=”2xx”}[2m]) T1 T2 T3 T4 {host=”bar.io”, status=”2xx”}](https://files.speakerdeck.com/presentations/66ede28d84b84199a37c7c21a1877fe7/slide_223.jpg)
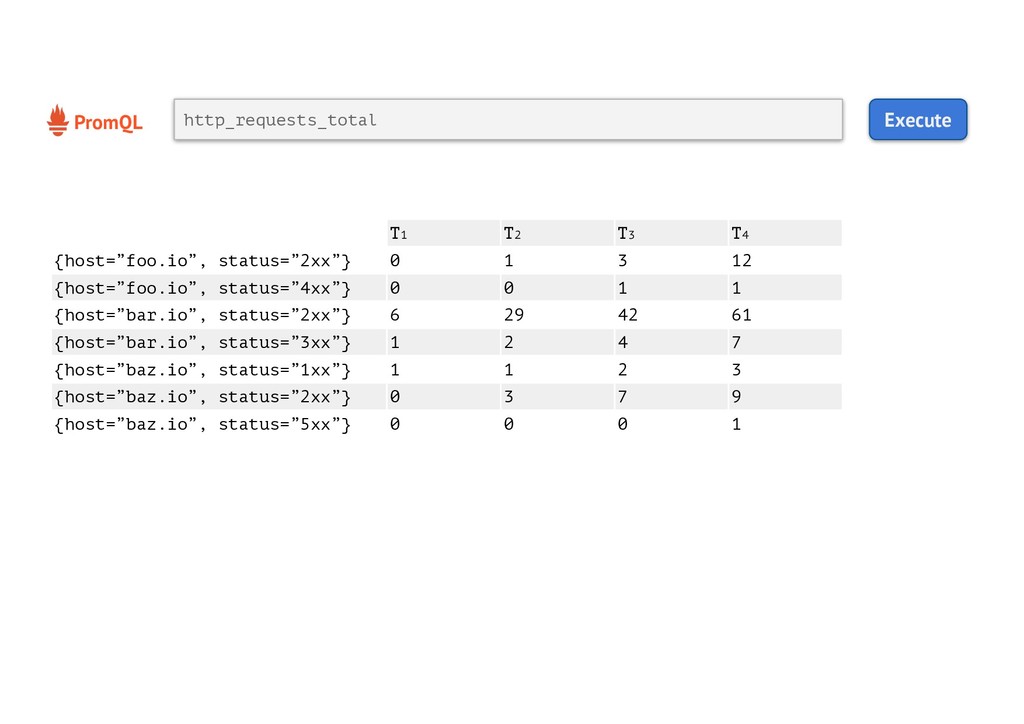
![PromQL Execute increase(http_requests_total[2m]) T1 T2 T3 T4 {host=”foo.io”, status=”2xx”} nil](https://files.speakerdeck.com/presentations/66ede28d84b84199a37c7c21a1877fe7/slide_226.jpg)
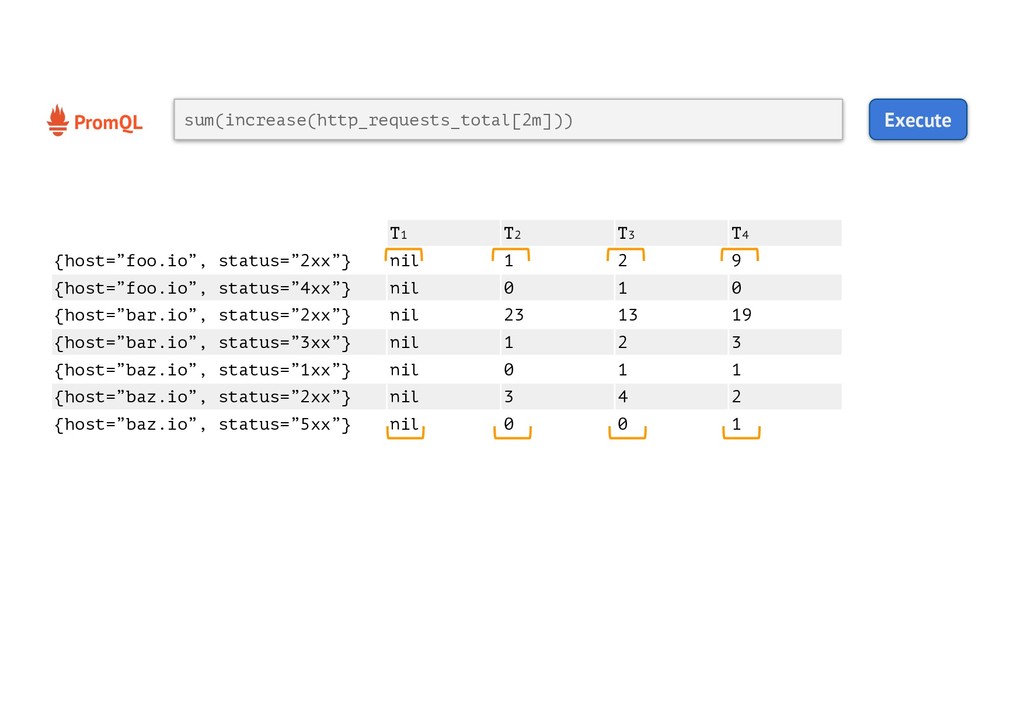
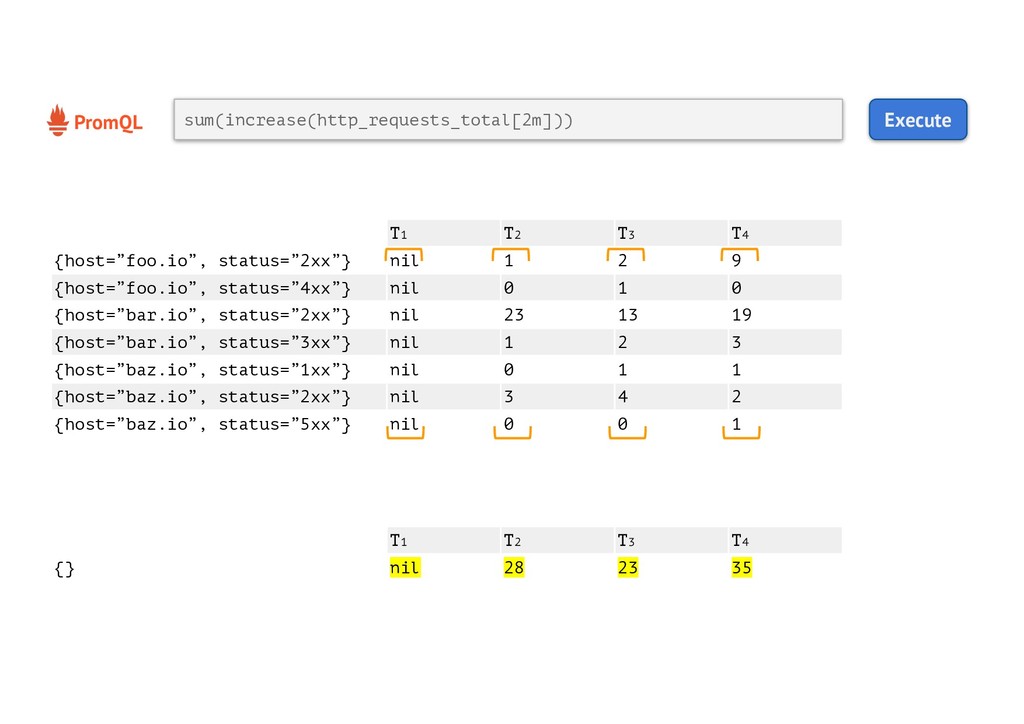
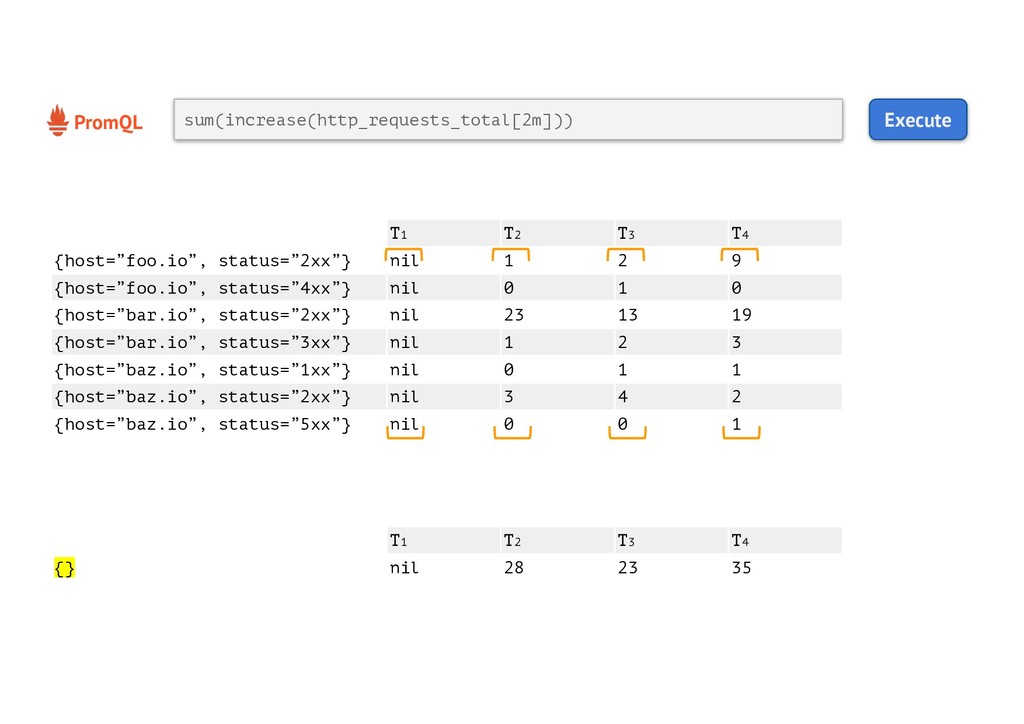
![PromQL Execute sum(increase(http_requests_total[2m])) T1 T2 T3 T4 {host=”foo.io”, status=”2xx”} nil](https://files.speakerdeck.com/presentations/66ede28d84b84199a37c7c21a1877fe7/slide_227.jpg)
![PromQL Execute sum(increase(http_requests_total[2m])) by (host)](https://files.speakerdeck.com/presentations/66ede28d84b84199a37c7c21a1877fe7/slide_231.jpg)
![PromQL Execute sum(increase(http_requests_total[2m])) by (host) T1 T2 T3 T4 {host=”foo.io”}](https://files.speakerdeck.com/presentations/66ede28d84b84199a37c7c21a1877fe7/slide_232.jpg)
![PromQL Execute sum(increase(http_requests_total[2m])) by (host) T1 T2 T3 T4 {host=”foo.io”}](https://files.speakerdeck.com/presentations/66ede28d84b84199a37c7c21a1877fe7/slide_233.jpg)
![PromQL Execute sum(increase(http_requests_total[2m])) by (status) T1 T2 T3 T4 {status=”1xx”}](https://files.speakerdeck.com/presentations/66ede28d84b84199a37c7c21a1877fe7/slide_234.jpg)
![PromQL Execute sum(increase(http_requests_total[2m])) by (status) T1 T2 T3 T4 {status=”1xx”}](https://files.speakerdeck.com/presentations/66ede28d84b84199a37c7c21a1877fe7/slide_235.jpg)
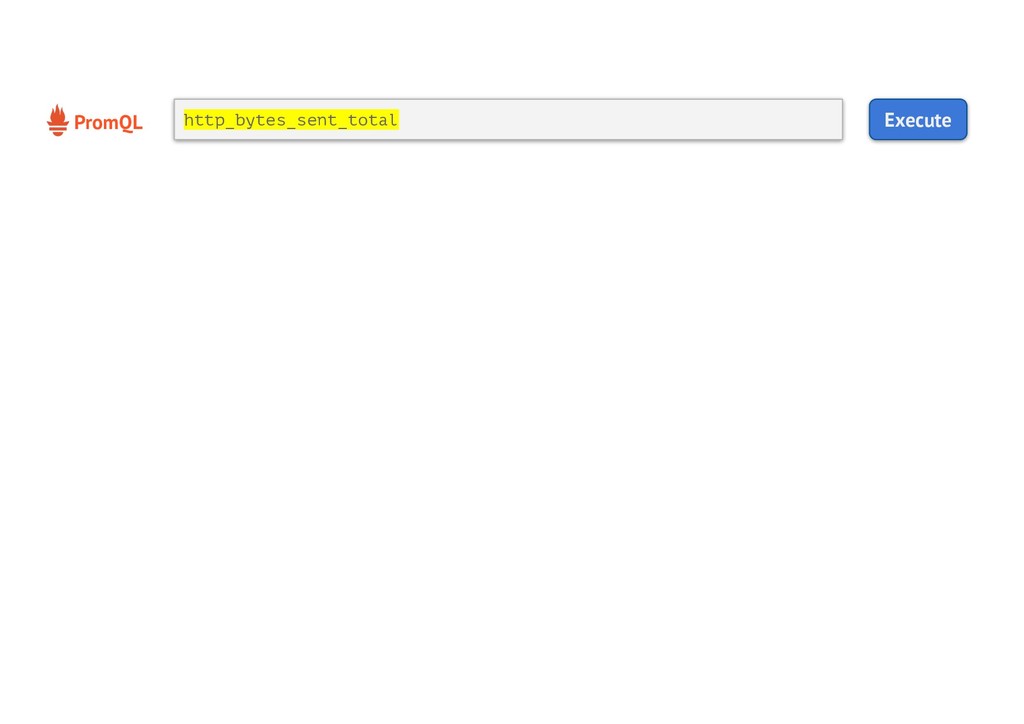
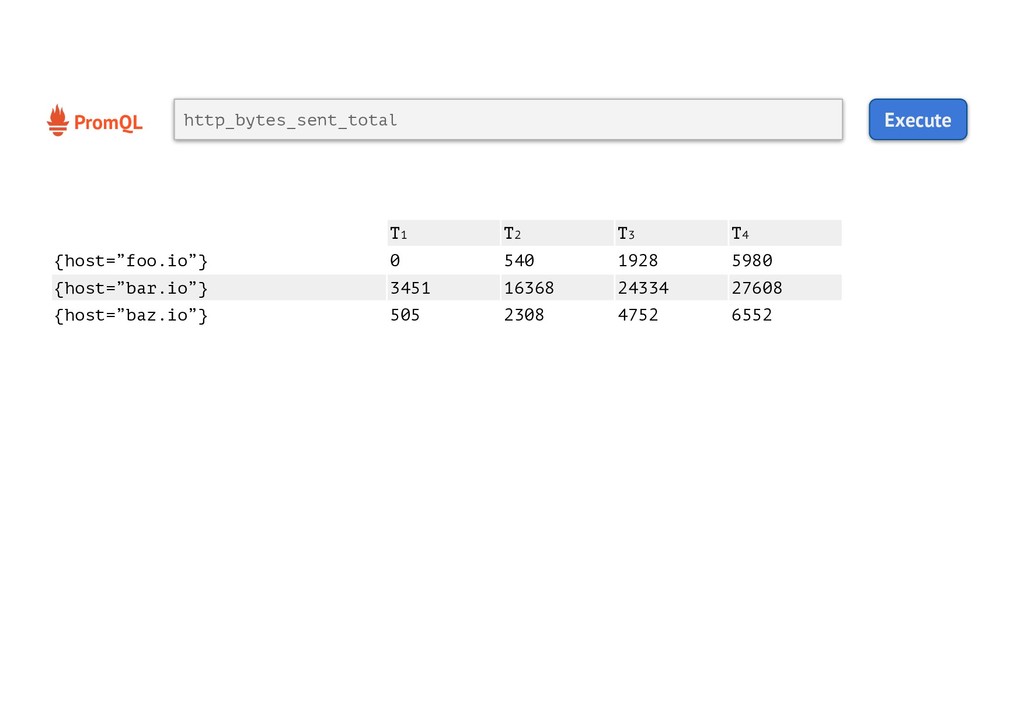
![PromQL Execute increase(http_bytes_sent_total[2m]) T1 T2 T3 T4 {host=”foo.io”} nil 540](https://files.speakerdeck.com/presentations/66ede28d84b84199a37c7c21a1877fe7/slide_238.jpg)
![PromQL Execute increase(http_bytes_sent_total[2m]) / sum(increase(http_requests_total[2m])) by (host) T1 T2 T3](https://files.speakerdeck.com/presentations/66ede28d84b84199a37c7c21a1877fe7/slide_239.jpg)
![PromQL Execute increase(http_bytes_sent_total[2m]) / sum(increase(http_requests_total[2m])) by (host) T1 T2 T3](https://files.speakerdeck.com/presentations/66ede28d84b84199a37c7c21a1877fe7/slide_240.jpg)
![PromQL Execute increase(http_bytes_sent_total[2m]) / sum(increase(http_requests_total[2m])) by (host) T1 T2 T3](https://files.speakerdeck.com/presentations/66ede28d84b84199a37c7c21a1877fe7/slide_241.jpg)
![PromQL Execute increase(http_bytes_sent_total[2m]) / sum(increase(http_requests_total[2m])) by (host) T1 T2 T3](https://files.speakerdeck.com/presentations/66ede28d84b84199a37c7c21a1877fe7/slide_242.jpg)
![PromQL Execute increase(http_bytes_sent_total[2m]) / sum(increase(http_requests_total[2m])) by (host) T1 T2 T3](https://files.speakerdeck.com/presentations/66ede28d84b84199a37c7c21a1877fe7/slide_243.jpg)
![PromQL Execute increase(http_bytes_sent_total[2m]) / sum(increase(http_requests_total[2m])) by (host) T1 T2 T3](https://files.speakerdeck.com/presentations/66ede28d84b84199a37c7c21a1877fe7/slide_244.jpg)
![Наши Docker-проекты github.com/flant/dapp github.com/flant/loghouse Дмитрий Столяров [email protected] linkedin.com/in/distol github.com/distol Всем](https://files.speakerdeck.com/presentations/66ede28d84b84199a37c7c21a1877fe7/slide_343.jpg)