a data and analytics company who specialise in data visualisation, predictive analytics, enterprise reporting and data engineering. We use our skill, experience and know-how to work with organisations across the world to interpret their data. We enable the business, the consumers, the data providers and IT to work towards a common goal, delivering innovative and cost-effective solutions based on our core values of thought leadership, hard work and honesty. We work across multiple verticals on projects that range from mature, large scale implementations to proofs of concept and can provide skills in development, architecture, delivery, training and support.
•Migrating to the Cloud •Importing Data Sources •Mode 1 and Mode 2 Overview •Report Writing •Oracle DV •Mashups, Dataflow and OAC Integration •Advanced Analytics / Machine Learning Course Agenda
to): ‣ Oracle Cloud ‘My Services’ - Used to create instances (similar to SSI’s in OBIEE 12c) ‣ Oracle Analytics Cloud Console - Used to manage datasources - Manage Users - Manage Backups/Restores via snapshots ‣ Enterprise Reporting (BICS) - OBI Data Models (RPD) - BI Publisher - OBIEE Analysis/Dashboards ‣ Oracle Data Visualiser - Data Discovery, Visualisation and Storyboarding - Mashups - Data preparation Oracle Analytics Cloud Service Functionality
and drop attributes and measures •Quickly create visualisations to distribute to other users •Use custom data sources, e.g. spreadsheets or database •Also includes Data Visualiser Desktop OAC Oracle Data Visualiser
Analytics Cloud Services managed by Oracle: Backup & Recovery Service Monitoring Patching & Upgrades Test & Production instances Based on Oracle Cloud Infrastructure (OCI) Services managed by You: Based on Oracle Cloud Infrastructure Classic
Lake Edition Standard Edition Data Discovery Data Preparation What-If Planning Big Data Storage Data Transformation via Apache Spark Data Lake Connectivity Enterprise Analysis & Dashboarding Published Reporting Day by Day
As You Go Based on Universal Credits model No minimum tenure Payments made in arrears Based on consumption Suitable for: Rapid Prototyping Testing & Sampling Elastic Scalable Based on Universal Credits model 12 month minimum tenure Payments made in advance Unused credits are forfeited Suitable for: Predictable, production workloads Long running platforms
Oracle Compute Units (OCPU’s) shapes to satisfy different requirements • The shape can be altered after service creation ‣ Flex capacity up (or down) based on immediate need Several Shape Options
App ‣ All DV projects will auto-render on mobile devices ‣ The heritage mobile app supports all OAC content • Synopsis Mobile App ‣ Automatic Excel/CSV ingestion & analysis ‣ Extending to all DV supported sources • Day by Day ‣ Included within Enterprise Edition ‣ Search driven analytics ‣ Voice recognition allows you to verablise questions ‣ Embedded learning enables a tailored experience Mobile Options
access cloud via SSH ‣ Specific access rules can be configured Security & Access • Users & Roles in OAC can be managed via two methods: ‣ Embedded Weblogic LDAP server ‣ Oracle Identity Cloud Service (IDCS) - Shared model across all cloud services - Supports SSO - Enables AD integration ‣ IDCS only relevant for Universal Credit
‣ Data held in Oracle Database Cloud Service (DBCS) ‣ ETL via Oracle Data Integration Platform Cloud (DIPC) • Data acquisition from Cloud Applications: ‣ BI Cloud Connector ‣ Goldengate ‣ OAC’s new Data Replication features • Data acquisition from on-premises applications: ‣ Data Sync ‣ APEX Data Loader ‣ SQL Developer tools ‣ Data Pump
Frequently a staging post for full migration • Data access via Remote Data Connector ‣ Runs on dedicated application server (WLS/Tomcat) ‣ Secure connectivity via public/private SSL key ‣ Supports Oracle, DB2, Teradata, SQL Server • Beware performance challenges ‣ Potential latency due to network bandwidth ‣ Check network capacity and test carefully
‣ Spread investment across different cloud environments ‣ Mix private and public cloud workloads • Data Sets have a broad support for connectivity ‣ Relational, Big Data, Semi-structured & proprietry • Data Model supports fewer options (via RDC) ‣ Oracle, DB2, Terdata, SQL Server
Analytics Cloud Services managed by Oracle: Backup & Recovery Service Monitoring Patching & Upgrades Test & Production instances Based on Oracle Cloud Infrastructure (OCI) Services managed by You: Based on Oracle Cloud Infrastructure Classic
•No need to involve internal IT and slow processes •Scale up and down as needed •Pay as you go – down to hourly basis •No capital expenses, only operating expenses! •“Fight for budget” a lot smoother Why to move to cloud
client modeller ‣Less dependency on skilled staff ‣Free up skilled staff for core tasks ‣Leave common tasks to super users ‣RPD and Admin Tool still there ‣Leverage existing know-how! Why to move to cloud
straight forwards ‣ The method depends on your starting point… Migration Options From BICS Create BAR File * Upload Based on Oracle Cloud Infrastructure Classic 11g Run the Migration Tool Deploy Import Bundle to OAC Minimum OBIEE 11.1.1.7 Does not apply to Autonomous version Manual Identity Store configuration 12c Create 12c BAR file Upload Snapshot to OAC or Manually upload Data Model Archive/Unarchive Web Catalog
BICS and DVCS not sold anymore ‣ Must be migrated at some point • OAC/OACC to on-premises ‣ On-premises won’t go away ‣ Allow for easier / cheaper on-boarding and development • OACC has full accessibility • Supports all devops and lifecycle technologies known from OBIEE Migration Options
a lot more permissive and fuzzy on certain rules •Clean on-premises means fluid migration •Fix-in-cloud often a lot harder •Review and reconsider your security •Eliminate legacy burdens •Trim unused excess •Institute standards Migration Considerations
the cloud or on premise (depending on licensing) •Some examples of data sources are: ‣Oracle Database ‣Oracle Essbase ‣Hive ‣Impala ‣MySQL ‣SQL Server ‣Amazon Redshift ‣ODBC ‣and many more! Oracle Analytics Cloud Data Sources
through the Oracle Analytics Cloud Dashboard •Uses a Wizard to create the data sources, and then are available for use by anyone who has access Oracle Analytics Cloud Data Sources
source, you can create a Data Set. Which can be: ‣A Database Object (Table, View, etc) ‣File (Excel, CSV, etc) ‣Essbase Application ‣SQL Statements •Data Sets can be filtered to remove data that is not required •Data Sets are managed within Visual Analyzer Oracle Analytics Cloud Data Sets
Business Intelligence Cloud Service Remote Data Connector (BICS RDC) enables querying data residing in on-premises relational sources without moving data to cloud. ‣Requires a Weblogic/Tomcat Server to host application •Oracle BICS Data Sync ‣Oracle Business Intelligence Cloud Service Data Sync supports loading data from files, on premise and cloud sources into schema provisioned on Oracle Business Intelligence Cloud Service. ‣Java based service that is installed on a server. Oracle Analytics Cloud Data Sets
database objects we can choose and search through •We can also add individual columns •Data Sets are saved as objects in the OAC Dashboard Example Connection & Dataset: Step 7
• Hypothesis testing • Why did this happen • Detailed analysis • Learning from data • Analysis follows data Oracle Analytics Cloud Data Visualization Explanation: • Consolidated data • Certainty • Hypothesis confirmation • What happened • High level metrics • Teaching with data • Data guides analysis
(Data mashups) • Uncertainty (Quick to build new charts, save analysis paths) • Hypothesis testing (Individual uses to test a theory) • Why did this happen (Look for patterns behind the trends) • Detailed analysis (Track multiple analysis paths) • Learning from data (fast workflow promotes creativity) • Analysis follows data (Try many things, save false starts, unlimited filter combos) Oracle Analytics Cloud Data Visualization Answers (Explain): • Consolidated data (RPD) • Certainty (Format dashboards to convey known information) • Hypothesis confirmation (Company gets the single source of truth) • What happened (Show tiles of KPIs) • High level metrics (Present the most relevant information quickly) • Teaching with data (Slower workflow promotes best practice presentation) • Data guides analysis (Dashboard creator guides users with selective use of drill down and filtering)
is automatically connected • Filtering ‣Global filters affect all charts • Brushing ‣Highlighting data points in one visualization highlights them in all visualizations • Drilling ‣Drilling on one visualization automatically filters the others Oracle Analytics Cloud Data Visualization
options for chart creation based on the grammar of graphics • A grammar of graphics is a tool that enables users to concisely describe the components of a graphic Oracle Analytics Cloud Data Visualization
and an attribute from the subject area onto the canvas Note: Hold the ctrl key to select both at the same time • VA will automatically generate a chart for your single measure • Time attributes automatically generate line charts Oracle Analytics Cloud Data Visualization
additional measure or attributes to the data exploration bar to modify the chart’s properties • Add filters by dropping columns into the filter bar • Modify the filter to limit values Oracle Analytics Cloud Data Visualization
dropped to create different layouts • Each visualization will automatically adjust its size to fill its new placement Oracle Analytics Cloud Data Visualization
referred to as “mash-up” •Data mashups provide the ability to introduce out of band or personal data into a governed data environment. •The expectation is to continue to maintain the self-service model •The goal is to enable the behaviors with a minimum amount of intervention. •Add your own data to analyze on its own. •Add your own data as an extension to an existing subject area. Concepts
be added and manipulated as before •Select measures and attributes from both subject areas then drag and drop to the visualisation and data element area: Combine External and Enterprise Data
that the newer spreadsheet file contains a sheet with the same name as the original one •The sheet must contain the same columns that are already matched with the subject area. •In the Data Sources pane, or the Subject Areas pane, right-click the data that you want to refresh. •Reload Data Data Refresh
project right-click the data that you want to remove. •Select remove from Project •To permanently delete a data source right-click the data that you want to remove. •Select delete to erase the data from storage. Remove and Delete Data
‘curated’ Data Sets ‣ Manipulate data sets to add additional columns ‣ Join Data Sets together ‣ Filter Data Sets ‣ Sentiment Analysis ‣ Machine Learning Training ‣ Create Essbase Cubes Data Flows
to the data set you imported at the beginning to add a new step to your data flow ‣This will raise a context menu for the different types of steps you can use: Creating a New Data Flow: Step 4
an output point to your data set ‣Data can be stored either in the cloud data storage or back to a database that you have created a connection too: Creating a New Data Flow: Step 6
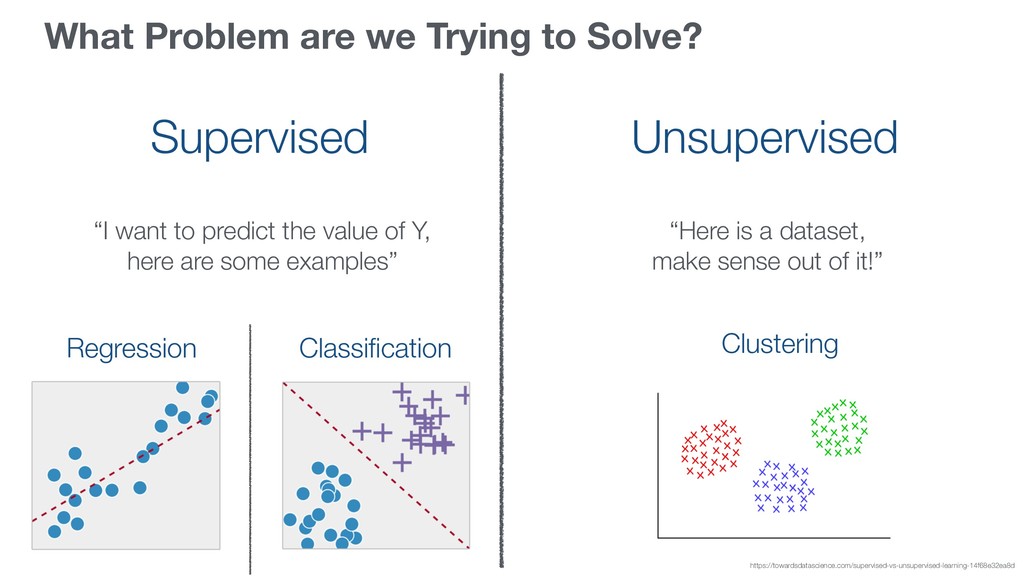
want to predict the value of Y, here are some examples” “Here is a dataset, make sense out of it!” Classification Regression https://towardsdatascience.com/supervised-vs-unsupervised-learning-14f68e32ea8d Clustering
![[email protected] www.rittmanmead.com @rittmanmead Oracle Analytics Cloud Workshop AnD Summit 2019](https://files.speakerdeck.com/presentations/fd3139e35bb04169bdf329691fe60922/slide_0.jpg)
![[email protected] www.rittmanmead.com @rittmanmead !2 Francesco Tisiot BI Tech Lead at](https://files.speakerdeck.com/presentations/fd3139e35bb04169bdf329691fe60922/slide_1.jpg)
![[email protected] www.rittmanmead.com @rittmanmead About Rittman Mead !3 Rittman Mead is](https://files.speakerdeck.com/presentations/fd3139e35bb04169bdf329691fe60922/slide_2.jpg)
![[email protected] www.rittmanmead.com @rittmanmead !4 •OAC Overview •Versions, Licensing and Provisioning](https://files.speakerdeck.com/presentations/fd3139e35bb04169bdf329691fe60922/slide_3.jpg)
![[email protected] www.rittmanmead.com @rittmanmead INTRO 101 - OAC Overview and Features](https://files.speakerdeck.com/presentations/fd3139e35bb04169bdf329691fe60922/slide_4.jpg)
![[email protected] www.rittmanmead.com @rittmanmead !6 •OAC Product Overview •OAC Key Components](https://files.speakerdeck.com/presentations/fd3139e35bb04169bdf329691fe60922/slide_5.jpg)
![[email protected] www.rittmanmead.com @rittmanmead !7 •Analytics “Platform” •Fully scalable •Can be](https://files.speakerdeck.com/presentations/fd3139e35bb04169bdf329691fe60922/slide_6.jpg)
![[email protected] www.rittmanmead.com @rittmanmead !8 • Functionality includes (but not limited](https://files.speakerdeck.com/presentations/fd3139e35bb04169bdf329691fe60922/slide_7.jpg)
![[email protected] www.rittmanmead.com @rittmanmead !9 •Used to manage the platform •Track](https://files.speakerdeck.com/presentations/fd3139e35bb04169bdf329691fe60922/slide_8.jpg)
![[email protected] www.rittmanmead.com @rittmanmead !10 •Web based management tool ‣Manages: -DV](https://files.speakerdeck.com/presentations/fd3139e35bb04169bdf329691fe60922/slide_9.jpg)
![[email protected] www.rittmanmead.com @rittmanmead !11 •OBIEE in the cloud •Lift and](https://files.speakerdeck.com/presentations/fd3139e35bb04169bdf329691fe60922/slide_10.jpg)
![[email protected] www.rittmanmead.com @rittmanmead !12 •Dynamically visualise data as you drag](https://files.speakerdeck.com/presentations/fd3139e35bb04169bdf329691fe60922/slide_11.jpg)
![[email protected] www.rittmanmead.com @rittmanmead !13 •Import Data from Files or Database](https://files.speakerdeck.com/presentations/fd3139e35bb04169bdf329691fe60922/slide_12.jpg)
![[email protected] www.rittmanmead.com @rittmanmead !14 Two Service Options Analytics Cloud Classic](https://files.speakerdeck.com/presentations/fd3139e35bb04169bdf329691fe60922/slide_13.jpg)
![[email protected] www.rittmanmead.com @rittmanmead !15 Three Edition Options Enterprise Edition Data](https://files.speakerdeck.com/presentations/fd3139e35bb04169bdf329691fe60922/slide_14.jpg)
![[email protected] www.rittmanmead.com @rittmanmead !16 Two Purchasing Options Monthly Flex Pay](https://files.speakerdeck.com/presentations/fd3139e35bb04169bdf329691fe60922/slide_15.jpg)
![[email protected] www.rittmanmead.com @rittmanmead !17 • OAC instances are provisioned in](https://files.speakerdeck.com/presentations/fd3139e35bb04169bdf329691fe60922/slide_16.jpg)
![[email protected] www.rittmanmead.com @rittmanmead !18 • Mobile Web & BI Mobile](https://files.speakerdeck.com/presentations/fd3139e35bb04169bdf329691fe60922/slide_17.jpg)
![[email protected] www.rittmanmead.com @rittmanmead !19 • Secure Access ‣ Remote hosts](https://files.speakerdeck.com/presentations/fd3139e35bb04169bdf329691fe60922/slide_18.jpg)
![dimensionality.ch [email protected] [email protected] Architectural Options](https://files.speakerdeck.com/presentations/fd3139e35bb04169bdf329691fe60922/slide_19.jpg)
![dimensionality.ch [email protected] [email protected] !21 Oracle Cloud • Simplest integration architecture:](https://files.speakerdeck.com/presentations/fd3139e35bb04169bdf329691fe60922/slide_20.jpg)
![dimensionality.ch [email protected] [email protected] !22 Hybrid • Database remains on-premises ‣](https://files.speakerdeck.com/presentations/fd3139e35bb04169bdf329691fe60922/slide_21.jpg)
![dimensionality.ch [email protected] [email protected] !23 Multi-Cloud • Commonly adopted cloud strategy](https://files.speakerdeck.com/presentations/fd3139e35bb04169bdf329691fe60922/slide_22.jpg)
![[email protected] www.rittmanmead.com @rittmanmead Getting Started With Your First Instance](https://files.speakerdeck.com/presentations/fd3139e35bb04169bdf329691fe60922/slide_23.jpg)
![[email protected] www.rittmanmead.com @rittmanmead !25 Two Service Options Analytics Cloud Classic](https://files.speakerdeck.com/presentations/fd3139e35bb04169bdf329691fe60922/slide_24.jpg)
![[email protected] www.rittmanmead.com @rittmanmead !26 Analytics Cloud (OAC)](https://files.speakerdeck.com/presentations/fd3139e35bb04169bdf329691fe60922/slide_25.jpg)
![[email protected] www.rittmanmead.com @rittmanmead !27 Analytics Cloud (OAC)](https://files.speakerdeck.com/presentations/fd3139e35bb04169bdf329691fe60922/slide_26.jpg)
![[email protected] www.rittmanmead.com @rittmanmead !28 Real Provisioning Example - OAC](https://files.speakerdeck.com/presentations/fd3139e35bb04169bdf329691fe60922/slide_27.jpg)
![[email protected] www.rittmanmead.com @rittmanmead !29 Real Provisioning Example - OAC](https://files.speakerdeck.com/presentations/fd3139e35bb04169bdf329691fe60922/slide_28.jpg)
![[email protected] www.rittmanmead.com @rittmanmead !30 Real Provisioning Example - OAC Choose](https://files.speakerdeck.com/presentations/fd3139e35bb04169bdf329691fe60922/slide_29.jpg)
![[email protected] www.rittmanmead.com @rittmanmead !31 Real Provisioning Example - OAC](https://files.speakerdeck.com/presentations/fd3139e35bb04169bdf329691fe60922/slide_30.jpg)
![[email protected] www.rittmanmead.com @rittmanmead !32 Real Provisioning Example - OAC](https://files.speakerdeck.com/presentations/fd3139e35bb04169bdf329691fe60922/slide_31.jpg)
![[email protected] www.rittmanmead.com @rittmanmead !33 Real Provisioning Example - OAC](https://files.speakerdeck.com/presentations/fd3139e35bb04169bdf329691fe60922/slide_32.jpg)
![[email protected] www.rittmanmead.com @rittmanmead !34 Real Provisioning Example - OACC Provisioning](https://files.speakerdeck.com/presentations/fd3139e35bb04169bdf329691fe60922/slide_33.jpg)
![[email protected] www.rittmanmead.com @rittmanmead !35 Real Provisioning Example - OACC -](https://files.speakerdeck.com/presentations/fd3139e35bb04169bdf329691fe60922/slide_34.jpg)
![[email protected] www.rittmanmead.com @rittmanmead !36 Choose Region Real Provisioning Example -](https://files.speakerdeck.com/presentations/fd3139e35bb04169bdf329691fe60922/slide_35.jpg)
![[email protected] www.rittmanmead.com @rittmanmead !37 Real Provisioning Example - OACC -](https://files.speakerdeck.com/presentations/fd3139e35bb04169bdf329691fe60922/slide_36.jpg)
![[email protected] www.rittmanmead.com @rittmanmead !38 Choose Backup Options Real Provisioning Example](https://files.speakerdeck.com/presentations/fd3139e35bb04169bdf329691fe60922/slide_37.jpg)
![[email protected] www.rittmanmead.com @rittmanmead !39 Real Provisioning Example - OACC -](https://files.speakerdeck.com/presentations/fd3139e35bb04169bdf329691fe60922/slide_38.jpg)
![[email protected] www.rittmanmead.com @rittmanmead !40 Real Provisioning Example - OACC](https://files.speakerdeck.com/presentations/fd3139e35bb04169bdf329691fe60922/slide_39.jpg)
![[email protected] www.rittmanmead.com @rittmanmead !41 Real Provisioning Example - OACC](https://files.speakerdeck.com/presentations/fd3139e35bb04169bdf329691fe60922/slide_40.jpg)
![[email protected] www.rittmanmead.com @rittmanmead !42 Real Provisioning Example - OACC](https://files.speakerdeck.com/presentations/fd3139e35bb04169bdf329691fe60922/slide_41.jpg)
![[email protected] www.rittmanmead.com @rittmanmead !43 Real Provisioning Example - OACC Choose](https://files.speakerdeck.com/presentations/fd3139e35bb04169bdf329691fe60922/slide_42.jpg)
![[email protected] www.rittmanmead.com @rittmanmead !44 Real Provisioning Example - OACC Choose](https://files.speakerdeck.com/presentations/fd3139e35bb04169bdf329691fe60922/slide_43.jpg)
![[email protected] www.rittmanmead.com @rittmanmead !45 Real Provisioning Example - OACC](https://files.speakerdeck.com/presentations/fd3139e35bb04169bdf329691fe60922/slide_44.jpg)
![[email protected] www.rittmanmead.com @rittmanmead !46 Real Provisioning Example - OACC](https://files.speakerdeck.com/presentations/fd3139e35bb04169bdf329691fe60922/slide_45.jpg)
![[email protected] www.rittmanmead.com @rittmanmead !47 Real Provisioning Example - OACC](https://files.speakerdeck.com/presentations/fd3139e35bb04169bdf329691fe60922/slide_46.jpg)
![[email protected] www.rittmanmead.com @rittmanmead !48 Real Provisioning Example - OACC](https://files.speakerdeck.com/presentations/fd3139e35bb04169bdf329691fe60922/slide_47.jpg)
![[email protected] www.rittmanmead.com @rittmanmead !49 Real Provisioning Example - OACC](https://files.speakerdeck.com/presentations/fd3139e35bb04169bdf329691fe60922/slide_48.jpg)
![[email protected] www.rittmanmead.com @rittmanmead Moving from on-premises OBIEE to OAC](https://files.speakerdeck.com/presentations/fd3139e35bb04169bdf329691fe60922/slide_49.jpg)
![[email protected] www.rittmanmead.com @rittmanmead •Cloud is “in” – management support assured](https://files.speakerdeck.com/presentations/fd3139e35bb04169bdf329691fe60922/slide_50.jpg)
![[email protected] www.rittmanmead.com @rittmanmead •OAC and OACC contain DV •OBIEE requires](https://files.speakerdeck.com/presentations/fd3139e35bb04169bdf329691fe60922/slide_51.jpg)
![[email protected] www.rittmanmead.com @rittmanmead •Choose whether to use RPD or thin](https://files.speakerdeck.com/presentations/fd3139e35bb04169bdf329691fe60922/slide_52.jpg)
![[email protected] www.rittmanmead.com @rittmanmead Thin client modeller and Admin Tool](https://files.speakerdeck.com/presentations/fd3139e35bb04169bdf329691fe60922/slide_53.jpg)
![[email protected] www.rittmanmead.com @rittmanmead Thin client modeller and Admin Tool](https://files.speakerdeck.com/presentations/fd3139e35bb04169bdf329691fe60922/slide_54.jpg)
![[email protected] www.rittmanmead.com @rittmanmead Your ETL Toolset](https://files.speakerdeck.com/presentations/fd3139e35bb04169bdf329691fe60922/slide_55.jpg)
![[email protected] www.rittmanmead.com @rittmanmead Your ETL toolset or Data Flows](https://files.speakerdeck.com/presentations/fd3139e35bb04169bdf329691fe60922/slide_56.jpg)
![[email protected] www.rittmanmead.com @rittmanmead !58 • Migrating to OAC is relatively](https://files.speakerdeck.com/presentations/fd3139e35bb04169bdf329691fe60922/slide_57.jpg)
![[email protected] www.rittmanmead.com @rittmanmead !59 • DVCS to OAC/OACC ‣ Both](https://files.speakerdeck.com/presentations/fd3139e35bb04169bdf329691fe60922/slide_58.jpg)
![[email protected] www.rittmanmead.com @rittmanmead •Clean and correct first! •Old 11g was](https://files.speakerdeck.com/presentations/fd3139e35bb04169bdf329691fe60922/slide_59.jpg)
![[email protected] www.rittmanmead.com @rittmanmead INTRO 101 - OAC Overview and Features](https://files.speakerdeck.com/presentations/fd3139e35bb04169bdf329691fe60922/slide_60.jpg)
![[email protected] www.rittmanmead.com @rittmanmead DATASOURCE101 - Creating New OAC Datasources](https://files.speakerdeck.com/presentations/fd3139e35bb04169bdf329691fe60922/slide_61.jpg)
![[email protected] www.rittmanmead.com @rittmanmead !63 •OAC can access data sources from](https://files.speakerdeck.com/presentations/fd3139e35bb04169bdf329691fe60922/slide_62.jpg)
![[email protected] www.rittmanmead.com @rittmanmead !64 •New Data Sources (Connections) are added](https://files.speakerdeck.com/presentations/fd3139e35bb04169bdf329691fe60922/slide_63.jpg)
![[email protected] www.rittmanmead.com @rittmanmead !65 •Once you have created a data](https://files.speakerdeck.com/presentations/fd3139e35bb04169bdf329691fe60922/slide_64.jpg)
![[email protected] www.rittmanmead.com @rittmanmead !66 •Once you have created a data](https://files.speakerdeck.com/presentations/fd3139e35bb04169bdf329691fe60922/slide_65.jpg)
![[email protected] www.rittmanmead.com @rittmanmead !67 •Oracle BICS Remote Data Connector ‣Oracle](https://files.speakerdeck.com/presentations/fd3139e35bb04169bdf329691fe60922/slide_66.jpg)
![[email protected] www.rittmanmead.com @rittmanmead !68 •In Oracle Analytics Cloud Dashboard ‣Navigate](https://files.speakerdeck.com/presentations/fd3139e35bb04169bdf329691fe60922/slide_67.jpg)
![[email protected] www.rittmanmead.com @rittmanmead !69 •On the ‘Create Connection’ dialogue ‣Select](https://files.speakerdeck.com/presentations/fd3139e35bb04169bdf329691fe60922/slide_68.jpg)
![[email protected] www.rittmanmead.com @rittmanmead !70 •On the ‘Create Connection’ form ‣Enter](https://files.speakerdeck.com/presentations/fd3139e35bb04169bdf329691fe60922/slide_69.jpg)
![[email protected] www.rittmanmead.com @rittmanmead !71 •This will then be displayed on](https://files.speakerdeck.com/presentations/fd3139e35bb04169bdf329691fe60922/slide_70.jpg)
![[email protected] www.rittmanmead.com @rittmanmead !72 •Next we need to create our](https://files.speakerdeck.com/presentations/fd3139e35bb04169bdf329691fe60922/slide_71.jpg)
![[email protected] www.rittmanmead.com @rittmanmead !73 •Since we have used an Oracle](https://files.speakerdeck.com/presentations/fd3139e35bb04169bdf329691fe60922/slide_72.jpg)
![[email protected] www.rittmanmead.com @rittmanmead !74 •We then get a list of](https://files.speakerdeck.com/presentations/fd3139e35bb04169bdf329691fe60922/slide_73.jpg)
![[email protected] www.rittmanmead.com @rittmanmead !75 •Repeat this for any other data](https://files.speakerdeck.com/presentations/fd3139e35bb04169bdf329691fe60922/slide_74.jpg)
![[email protected] www.rittmanmead.com @rittmanmead !76 •Once this has been completed we](https://files.speakerdeck.com/presentations/fd3139e35bb04169bdf329691fe60922/slide_75.jpg)
![[email protected] www.rittmanmead.com @rittmanmead !77 •These data sets can then be](https://files.speakerdeck.com/presentations/fd3139e35bb04169bdf329691fe60922/slide_76.jpg)
![[email protected] www.rittmanmead.com @rittmanmead DATASOURCE101 - Creating New OAC Datasources](https://files.speakerdeck.com/presentations/fd3139e35bb04169bdf329691fe60922/slide_77.jpg)
![[email protected] www.rittmanmead.com @rittmanmead !79 •OAC URL: http://ritt.md/BIWA2019 •User: training •Pwd:](https://files.speakerdeck.com/presentations/fd3139e35bb04169bdf329691fe60922/slide_78.jpg)
![[email protected] www.rittmanmead.com @rittmanmead DATASOURCE101 Lab 1 - Creating a new](https://files.speakerdeck.com/presentations/fd3139e35bb04169bdf329691fe60922/slide_79.jpg)
![[email protected] www.rittmanmead.com @rittmanmead DATAVIZ 101 - OAC Data Visualization](https://files.speakerdeck.com/presentations/fd3139e35bb04169bdf329691fe60922/slide_80.jpg)
![[email protected] www.rittmanmead.com @rittmanmead !82 Exploration: • Scattered data • Uncertainty](https://files.speakerdeck.com/presentations/fd3139e35bb04169bdf329691fe60922/slide_81.jpg)
![[email protected] www.rittmanmead.com @rittmanmead !83 Data Visualization (Explore): • Scattered data](https://files.speakerdeck.com/presentations/fd3139e35bb04169bdf329691fe60922/slide_82.jpg)
![[email protected] www.rittmanmead.com @rittmanmead !84 • Everything placed on the canvas](https://files.speakerdeck.com/presentations/fd3139e35bb04169bdf329691fe60922/slide_83.jpg)
![[email protected] www.rittmanmead.com @rittmanmead !85 • The subject area view is](https://files.speakerdeck.com/presentations/fd3139e35bb04169bdf329691fe60922/slide_84.jpg)
![[email protected] www.rittmanmead.com @rittmanmead !86 • The data exploration bar contains](https://files.speakerdeck.com/presentations/fd3139e35bb04169bdf329691fe60922/slide_85.jpg)
![[email protected] www.rittmanmead.com @rittmanmead !87 •The canvas displays the chart •Filters](https://files.speakerdeck.com/presentations/fd3139e35bb04169bdf329691fe60922/slide_86.jpg)
![[email protected] www.rittmanmead.com @rittmanmead !88 • Drag and drop a measure](https://files.speakerdeck.com/presentations/fd3139e35bb04169bdf329691fe60922/slide_87.jpg)
![[email protected] www.rittmanmead.com @rittmanmead !89 • Select a chart and drag](https://files.speakerdeck.com/presentations/fd3139e35bb04169bdf329691fe60922/slide_88.jpg)
![[email protected] www.rittmanmead.com @rittmanmead !90 • Visualizations can be dragged and](https://files.speakerdeck.com/presentations/fd3139e35bb04169bdf329691fe60922/slide_89.jpg)
![[email protected] www.rittmanmead.com @rittmanmead !91 • On the menu header go](https://files.speakerdeck.com/presentations/fd3139e35bb04169bdf329691fe60922/slide_90.jpg)
![[email protected] www.rittmanmead.com @rittmanmead DATAVIZ 101 - OAC Data Visualization](https://files.speakerdeck.com/presentations/fd3139e35bb04169bdf329691fe60922/slide_91.jpg)
![[email protected] www.rittmanmead.com @rittmanmead DATAVIZ101 Lab 1 - Creating a VA](https://files.speakerdeck.com/presentations/fd3139e35bb04169bdf329691fe60922/slide_92.jpg)
![[email protected] www.rittmanmead.com @rittmanmead MASHUPS101 - Using External Data & Data](https://files.speakerdeck.com/presentations/fd3139e35bb04169bdf329691fe60922/slide_93.jpg)
![[email protected] www.rittmanmead.com @rittmanmead !95 •Adding your own data is sometimes](https://files.speakerdeck.com/presentations/fd3139e35bb04169bdf329691fe60922/slide_94.jpg)
![[email protected] www.rittmanmead.com @rittmanmead !96 •Create new VA project and select](https://files.speakerdeck.com/presentations/fd3139e35bb04169bdf329691fe60922/slide_95.jpg)
![[email protected] www.rittmanmead.com @rittmanmead !97 • data relationships Import External Data](https://files.speakerdeck.com/presentations/fd3139e35bb04169bdf329691fe60922/slide_96.jpg)
![[email protected] www.rittmanmead.com @rittmanmead !98 •Columns from external subject areas can](https://files.speakerdeck.com/presentations/fd3139e35bb04169bdf329691fe60922/slide_97.jpg)
![[email protected] www.rittmanmead.com @rittmanmead !99 •To refresh data you must ensure](https://files.speakerdeck.com/presentations/fd3139e35bb04169bdf329691fe60922/slide_98.jpg)
![[email protected] www.rittmanmead.com @rittmanmead !100 •To remove a datasource from a](https://files.speakerdeck.com/presentations/fd3139e35bb04169bdf329691fe60922/slide_99.jpg)
![[email protected] www.rittmanmead.com @rittmanmead !101 •Data flows are used to create](https://files.speakerdeck.com/presentations/fd3139e35bb04169bdf329691fe60922/slide_100.jpg)
![[email protected] www.rittmanmead.com @rittmanmead !102 • In Oracle Analytics Cloud, go](https://files.speakerdeck.com/presentations/fd3139e35bb04169bdf329691fe60922/slide_101.jpg)
![[email protected] www.rittmanmead.com @rittmanmead !103 • A new tab will open](https://files.speakerdeck.com/presentations/fd3139e35bb04169bdf329691fe60922/slide_102.jpg)
![[email protected] www.rittmanmead.com @rittmanmead !104 • This will take you to](https://files.speakerdeck.com/presentations/fd3139e35bb04169bdf329691fe60922/slide_103.jpg)
![[email protected] www.rittmanmead.com @rittmanmead !105 • Click the + icon next](https://files.speakerdeck.com/presentations/fd3139e35bb04169bdf329691fe60922/slide_104.jpg)
![[email protected] www.rittmanmead.com @rittmanmead !106 • Each step type has its](https://files.speakerdeck.com/presentations/fd3139e35bb04169bdf329691fe60922/slide_105.jpg)
![[email protected] www.rittmanmead.com @rittmanmead !107 • You then need to set](https://files.speakerdeck.com/presentations/fd3139e35bb04169bdf329691fe60922/slide_106.jpg)
![[email protected] www.rittmanmead.com @rittmanmead !108 • You can then schedule the](https://files.speakerdeck.com/presentations/fd3139e35bb04169bdf329691fe60922/slide_107.jpg)
![[email protected] www.rittmanmead.com @rittmanmead MASHUPS101 - Using External Data & Data](https://files.speakerdeck.com/presentations/fd3139e35bb04169bdf329691fe60922/slide_108.jpg)
![[email protected] www.rittmanmead.com @rittmanmead MASHUPS101 - Lab 1 - Using External](https://files.speakerdeck.com/presentations/fd3139e35bb04169bdf329691fe60922/slide_109.jpg)
![[email protected] www.rittmanmead.com @rittmanmead AA01 - Advanced Analytics](https://files.speakerdeck.com/presentations/fd3139e35bb04169bdf329691fe60922/slide_110.jpg)
![[email protected] www.rittmanmead.com @rittmanmead !112 •Description of Metrics and Attributes Augmented](https://files.speakerdeck.com/presentations/fd3139e35bb04169bdf329691fe60922/slide_111.jpg)
![[email protected] www.rittmanmead.com @rittmanmead !113 Key Drivers/Anomalies](https://files.speakerdeck.com/presentations/fd3139e35bb04169bdf329691fe60922/slide_112.jpg)
![[email protected] www.rittmanmead.com @rittmanmead !115 •Data Visualization provides one click access](https://files.speakerdeck.com/presentations/fd3139e35bb04169bdf329691fe60922/slide_114.jpg)
![[email protected] www.rittmanmead.com @rittmanmead !116 DataFlow Train Model](https://files.speakerdeck.com/presentations/fd3139e35bb04169bdf329691fe60922/slide_115.jpg)
![[email protected] www.rittmanmead.com @rittmanmead !117 More Detailed ML](https://files.speakerdeck.com/presentations/fd3139e35bb04169bdf329691fe60922/slide_116.jpg)
![[email protected] www.rittmanmead.com @rittmanmead !118 Which Model - Parameters To Pick?](https://files.speakerdeck.com/presentations/fd3139e35bb04169bdf329691fe60922/slide_117.jpg)
![[email protected] www.rittmanmead.com @rittmanmead !119 Select, Try, Save, Change, Try, Save](https://files.speakerdeck.com/presentations/fd3139e35bb04169bdf329691fe60922/slide_118.jpg)
![[email protected] www.rittmanmead.com @rittmanmead !120 Model Evaluation](https://files.speakerdeck.com/presentations/fd3139e35bb04169bdf329691fe60922/slide_119.jpg)
![[email protected] www.rittmanmead.com @rittmanmead !121 Model Evaluation 502/(502+896) = 64.09% 471/(471+866)=64.77%](https://files.speakerdeck.com/presentations/fd3139e35bb04169bdf329691fe60922/slide_120.jpg)
![[email protected] www.rittmanmead.com @rittmanmead !122 Use On the Fly](https://files.speakerdeck.com/presentations/fd3139e35bb04169bdf329691fe60922/slide_121.jpg)
![[email protected] www.rittmanmead.com @rittmanmead !123 Step of a Data Flow](https://files.speakerdeck.com/presentations/fd3139e35bb04169bdf329691fe60922/slide_122.jpg)
![[email protected] www.rittmanmead.com @rittmanmead AA01 - Advanced Analytics](https://files.speakerdeck.com/presentations/fd3139e35bb04169bdf329691fe60922/slide_123.jpg)