Upgrade to Pro — share decks privately, control downloads, hide ads and more …

Combine Immigration

fwd.us
June 25, 2014

Combine Immigration

fwd.us

June 25, 2014
Tweet

More Decks by fwd.us

Other Decks in Research

Transcript

  1. Key Findings from Surveys of Registered Voters, Conducted May 17-23,

    2014… •  N=800 National Registered Voters, with a Margin of Error of +3.46% •  N=505 National Republican Voters, with a Margin of Error of +4.36% •  N=600 Registered Voters in AZ, FL & TX, with a Margin of Error of +4.0% •  N=400 Registered Voters in CA, with a Margin of Error of +4.9% Key Findings from a survey of N=800 National Hispanic Registered Voters, Conducted May 27-June 1, 2014, with a margin of error of + 3.46%
  2. 3 IMMIGRATION NATIONAL – MAY 2014 A generation from now,

    non-Hispanic whites will constitute a minority of the U.S. population.
  3. 4 IMMIGRATION NATIONAL – MAY 2014 Hispanics have consistently viewed

    themselves as more Democratic than Republican, but the Democratic margin grew dramatically after the 2006-2007 immigration debates, and has continued to grow. Source:  Pew  Research  Center   58   56   55   49   57   65   62   67   70   25   25   28   27   23   26   25   20   22   ‘99   ‘02   ‘04   ‘06   ‘07   ‘08   ‘10   ‘11   ‘12   Democrats   Republicans  
  4. 5 IMMIGRATION NATIONAL – MAY 2014 Consequently, Hispanic support for

    Republican presidential candidates dropped from the high water mark of 44 percent in 2004 to 27 percent in 2012. Source:  Exit  Polls   62   53   67   71   35   44   31   27   2000   2004   2008   2012   Democrat   Republican  
  5. 6 IMMIGRATION NATIONAL – MAY 2014 64% 33% 26% 53%

    Total Total I would like to read you a list of names and have you tell me, for each one, whether you've heard of that person or group and, if so, whether you have a favorable or unfavorable opinion of them. If you haven't heard of the person or group, just say so: Favorable Unfavorable Favorable Unfavorable Today Hispanics view the Democratic Party far more favorably than the Republican Party… +38 -20 The Republican Party The Democratic Party National Survey of Hispanic Registered Voters | May 27-June 1, 2014
  6. 7 IMMIGRATION NATIONAL – MAY 2014 70% 46% 23% 47%

    Total Total How likely are you to vote for the Democratic candidate for Congress from your district: extremely likely, very likely, somewhat likely, not very likely, or not at all likely? Likely 17% Extremely Not Likely Likely Not Likely 31% Not At All …and they are far more likely to vote for a generic Democrat than a generic Republican for Congress. +47 -1 How likely are you to vote for the Republican candidate for Congress from your district: extremely likely, very likely, somewhat likely, not very likely, or not at all likely? National Survey of Hispanic Registered Voters | May 27-June 1, 2014
  7. 8 IMMIGRATION NATIONAL – MAY 2014 31% 14% 44% 31%

    21% 51% Total Total Would you say the following phrases describe the Democratic Party very well, somewhat well, or not too well? Hispanics think Democrats are better described by the phrase “cares about the needs and concerns of Hispanics and Latinos.” Would you say the following phrases describe the Republican Party very well, somewhat well, or not too well? “Cares about the needs and concerns of Hispanics and Latinos” Very Well Not Too Well Somewhat Well Very Well Not Too Well Somewhat Well 75% Well 45% Well National Survey of Hispanic Registered Voters | May 27-June 1, 2014
  8. 9 IMMIGRATION NATIONAL – MAY 2014 47% 14% 32% 28%

    17% 52% Total Total Would you say the following phrases describe the Democratic Party very well, somewhat well, or not too well? They think the phrase “makes a real effort to win Hispanic and Latino voters” better describes Democrats... Would you say the following phrases describe the Republican Party very well, somewhat well, or not too well? “Makes a real effort to win Hispanic and Latino voters” Very Well Not Too Well Somewhat Well Very Well Not Too Well Somewhat Well 79% Well 42% Well National Survey of Hispanic Registered Voters | May 27-June 1, 2014
  9. 10 IMMIGRATION NATIONAL – MAY 2014 42% 20% 39% 32%

    15% 44% Total Total Would you say the following phrases describe the Democratic Party very well, somewhat well, or not too well? ...as does the phrase “considers Hispanics and Latinos important and valued members of American society”... Would you say the following phrases describe the Republican Party very well, somewhat well, or not too well? “Considers Hispanics and Latinos important and valued members of American society” Very Well Not Too Well Somewhat Well Very Well Not Too Well Somewhat Well 81% Well 52% Well National Survey of Hispanic Registered Voters | May 27-June 1, 2014
  10. 11 IMMIGRATION NATIONAL – MAY 2014 35% 17% 38% 24%

    21% 54% Total Total Would you say the following phrases describe the Democratic Party very well, somewhat well, or not too well? ...as does the phrase “supports legal immigration.” Would you say the following phrases describe the Republican Party very well, somewhat well, or not too well? “Supports legal immigration” Very Well Not Too Well Somewhat Well Very Well Not Too Well Somewhat Well 73% Well 41% Well National Survey of Hispanic Registered Voters | May 27-June 1, 2014
  11. 12 IMMIGRATION NATIONAL – MAY 2014 13% 22% 28% 27%

    51% 42% Total Total Would you say the following phrases describe the Democratic Party very well, somewhat well, or not too well? They do not think the phrase “is anti-immigrant” describes either party very well, but they are more likely to say that about Republicans than Democrats. Would you say the following phrases describe the Republican Party very well, somewhat well, or not too well? “Is anti-immigrant” Very Well Not Too Well Somewhat Well Very Well Not Too Well Somewhat Well 41% Well 49% Well National Survey of Hispanic Registered Voters | May 27-June 1, 2014
  12. 14 IMMIGRATION NATIONAL – MAY 2014 52% 38% Total Some

    people say that the federal government can do a lot for people by helping them in their daily lives, while others feel that the federal government tends to hinder their daily lives by just getting in the way. Which of these views comes closer to your own? Help 41% Strongly Hinder 29% Strongly While Hispanics are not anti-government... +14 National Survey of Hispanic Registered Voters | May 27-June 1, 2014
  13. 15 IMMIGRATION NATIONAL – MAY 2014 36% 61% Total Which

    of the following statements comes closer to your view: A. Government policies should promote fairness by narrowing the gap between rich and poor, making the rich pay their fair share, and reducing income inequality; B. Government policies should promote opportunity by fostering job growth, encouraging small businesses, and allowing hardworking people to keep more of what they earn. Statement A – Promote Fairness Statement B – Promote Opportunity ...they are far more likely to say government should promote opportunity than fairness... -25 National Survey of Hispanic Registered Voters | May 27-June 1, 2014
  14. 16 IMMIGRATION NATIONAL – MAY 2014 63% 28% Total Overall,

    would you prefer smaller government with fewer services and lower taxes, or larger government with more services and higher taxes? Smaller Gov’t/Lower Taxes Larger Gov’t/Higher Taxes ...and say they prefer a smaller government with fewer services and lower taxes to a larger government with more services and higher taxes. +35 National Survey of Hispanic Registered Voters | May 27-June 1, 2014
  15. 17 IMMIGRATION NATIONAL – MAY 2014 13% 23% 28% 19%

    12% Total When thinking about politics today, do you normally consider yourself to be very conservative, somewhat conservative, moderate, somewhat liberal, or very liberal? Very Conservative Somewhat Liberal Moderate Two-thirds of Hispanics are conservative or moderate... Somewhat Conservative Very Liberal 64% Conservative/Moderate National Survey of Hispanic Registered Voters | May 27-June 1, 2014
  16. 18 IMMIGRATION NATIONAL – MAY 2014 53% 44% Total Have

    you ever voted for a Republican candidate for any office? Yes No ...and a majority have voted for a Republican candidate at some point. +9 National Survey of Hispanic Registered Voters | May 27-June 1, 2014
  17. 20 IMMIGRATION NATIONAL – MAY 2014 56% 27% 16% Total

    How important would you say immigration reform is when determining your vote for Congress: very important, somewhat important, or not too important? Very Important Not Too Important Somewhat Important A majority of Hispanics says immigration reform is very important for determining their vote for Congress... 83% Important National Survey of Hispanic Registered Voters | May 27-June 1, 2014
  18. 21 IMMIGRATION NATIONAL – MAY 2014 69% 11% 14% Total

    Do you think immigration reform will help, hurt, or have no effect on the U.S. economy? Help No Effect Hurt ...and they overwhelmingly believe immigration reform will help the U.S. economy. National Survey of Hispanic Registered Voters | May 27-June 1, 2014
  19. 22 IMMIGRATION NATIONAL – MAY 2014 37% 57% Total Now,

    thinking specifically about the nation’s immigration system, including border security: A.  Do you believe that the current immigration and border security system is generally working well as it is now, and that Congress should take no action on this issue? OR B.  Do you believe that the current immigration and border security system is seriously broken, and that Congress should take immediate action to fix it? Working Broken 46% Strongly A substantial majority of Hispanics believes the immigration and border security system is seriously broken, and Congress should take immediate action to fix it. -20 National Survey of Hispanic Registered Voters | May 27-June 1, 2014
  20. 23 IMMIGRATION NATIONAL – MAY 2014 47% 41% 9% Total

    Now, as you may know, there are an estimated 11 million undocumented immigrants living in the U.S. illegally. Which one of the following steps do you believe should be taken regarding these undocumented immigrants: they should eventually be allowed to apply for U.S. citizenship, they should eventually be allowed to apply for legal status, but NOT citizenship, they should be sent back to their home country? Citizenship Sent Home Legal Status Almost 9 out of 10 Hispanics think undocumented immigrants should eventually be allowed to apply for either citizenship or legal status. National Survey of Hispanic Registered Voters | May 27-June 1, 2014
  21. 24 IMMIGRATION NATIONAL – MAY 2014 Immigration Reform Proposal This

    reform proposal calls for dramatically increasing the number of Border Patrol agents and completing more than 700 miles of fencing along the border between the U.S. and Mexico. It requires that employers verify the legal status of individuals before hiring them to prevent fraud. It establishes a pathway for legal status for the estimated 11 million undocumented immigrants in the country, provided they pass a background check, pay a fine and taxes owed, learn English and wait at least thirteen years until they can become a citizen. Finally, the plan creates a guest worker program for industries like agriculture and construction, and allows more high-skilled immigrants into the country in the areas of hi-tech, science and engineering. Now, I’d like to tell you some information about a proposal to reform the nation’s immigration system, including border security, that is currently being considered by Congress... National Survey of Hispanic Registered Voters | May 27-June 1, 2014
  22. 25 IMMIGRATION NATIONAL – MAY 2014 70% 22% Total Now

    having heard a little about this proposal, do you favor or oppose it? Favor 37% Strongly Oppose 7 out of 10 Hispanics support that immigration reform proposal. +48 National Survey of Hispanic Registered Voters | May 27-June 1, 2014
  23. 26 IMMIGRATION NATIONAL – MAY 2014 77% 70% 55% 58%

    51% 51% 53% 91% 90% 79% 78% 77% 76% 75% % Strongly Support Total Support Allowing undocumented immigrants...to earn legal status if pass background check, pay fine and taxes, have job, learn English Substantially increasing security along US-Mexican border to ensure people who enter US do so legally Instituting a rigorous visa tracking system to ensure people who enter US with legal visa do not overstay their time here Requiring employers to use verification system that will enable them to...determine a potential employee’s legal status Setting up a temporary-worker program to allow people to come to US for limited time to work in...agriculture...return to home Allowing undocumented children who have been here for years to earn legal status if they serve in military or attend college Hispanics overwhelmingly support each of the component parts of the immigration reform proposal, including stronger border security and rigorous conditions for legal status. Do you support or oppose each of the following policies? Making it easier for immigrants to come to the US legally National Survey of Hispanic Registered Voters | May 27-June 1, 2014
  24. 27 IMMIGRATION NATIONAL – MAY 2014 11% 11% 49% Total

    Who do you blame most for the government’s failure to pass immigration reform legislation over the last few years: President Obama, Democrats in Congress, or Republicans in Congress? Obama Republicans Democrats Half of Hispanics blame Republicans for Congress’s failure to pass immigration reform. National Survey of Hispanic Registered Voters | May 27-June 1, 2014
  25. 28 IMMIGRATION NATIONAL – MAY 2014 76% 20% Total Some

    people we talk to say that the Republican Party has decent ideas on some issues like lowering taxes, helping small business, and improving our schools but it’s hard to support the Republican Party today because they seem too unwelcoming to immigrants and Latinos. Other people say they oppose the Republican Party and would never consider voting Republican. If Republicans in Congress support immigration reform and pass a bill that includes a path to citizenship would you be more likely to listen to what the party has to say on other issues and give them a second chance? Yes No Three-fourths of Hispanics would be more likely to listen to Republican ideas on other issues if they support immigration reform with a path to citizenship. +56 National Survey of Hispanic Registered Voters | May 27-June 1, 2014
  26. 30 IMMIGRATION NATIONAL – MAY 2014 Take-Away Points Ø  After

    George W. Bush’s success with Hispanic voters in 2004, Republicans have struggled with the fastest growing voter group in America. Ø  Hispanics believe Democrats care about their needs, make an effort to win their votes, and consider them valuable members of American society, while they are more likely to think Republicans are anti-immigrant. Ø  While Hispanics are not anti-government, they want government to emphasize opportunity over fairness, and they prefer smaller government with fewer services and lower taxes over larger government with more services and higher taxes.
  27. 31 IMMIGRATION NATIONAL – MAY 2014 Take-Away Points Ø  Two-thirds

    of Hispanics say they are conservative or moderate, and a majority has voted for Republican candidates in the past. Ø  Hispanics believe the current immigration system is seriously broken and Congress should take immediate action to fix it. They blame Republicans in Congress for the failure of immigration reform thus far. Ø  Hispanics think immigration reform will be good for the economy and will be very important in deciding their vote for Congress.
  28. 32 IMMIGRATION NATIONAL – MAY 2014 Take-Away Points Ø  Hispanics

    overwhelmingly support the immigration reform proposal and each of its component parts, including stronger border security and rigorous conditions for legal status. Ø  Hispanics believe undocumented immigrants should be allowed to apply for either citizenship or legal status rather than be deported.
  29. 33 IMMIGRATION NATIONAL – MAY 2014 Take-Away Points Ø  Three-fourths

    of Hispanics would be more likely to listen to Republican ideas on other issues if they support immigration reform. Ø  About one-quarter of Hispanics will support Republicans regardless of whether they pass immigration reform, and about one-half will support Democrats regardless of what Republicans do. Passing immigration reform gives Republicans an opportunity to gain the support of the remaining quarter. Doing so solves a serious problem in a way that Americans, including Hispanics, overwhelmingly support, and improves Republicans’ standing with swing voters now, in the next Presidential election, and for years to come.
  30. 35 IMMIGRATION NATIONAL – MAY 2014 25% 19% 24% 30%

    65% 73% 65% 58% Total GOP (27%) IND (40%) DEM (33%) Now, thinking specifically about the nation’s immigration system, including border security... Do you believe that the current immigration and border security system is generally working well as it is now and that Congress should take no action on this issue? ...OR... Do you believe that the current immigration and border security system is seriously broken and that Congress should take immediate action to fix it? Works Well Broken Works Well Broken Works Well Broken Works Well Broken There’s a strong sense that the current immigration system is broken and that Congress should take immediate action to fix it, with Republicans most adamant about it. -40 -28 -54 -41 Total By Party 51% Strongly 58% Strongly 52% Strongly 45% Strongly
  31. 36 IMMIGRATION NATIONAL – MAY 2014 12% 16% 15% 19%

    83% 78% 79% 74% Tea Party Republicans (62%) Conservative Republicans (77%) Strong Republicans (72%) White Evangelical Republicans (33%) Now, thinking specifically about the nation’s immigration system, including border security... Do you believe that the current immigration and border security system is generally working well as it is now and that Congress should take no action on this issue? ...OR... Do you believe that the current immigration and border security system is seriously broken and that Congress should take immediate action to fix it? Among GOP Groups The strongest elements of the GOP coalition are most vocal on this issue. -71 -55 -62 -64 Works Well Broken Works Well Broken Works Well Broken Works Well Broken 71% Strongly 66% Strongly 69% Strongly 58% Strongly Data among the GOP Voters (N=505)
  32. 37 IMMIGRATION NATIONAL – MAY 2014 41% 32% 22% Total

    Now, as you may know, there are an estimated 11 million undocumented immigrants living in the U.S. illegally. Which one of the following steps do you believe should be taken regarding these undocumented immigrants... They should eventually be allowed to apply for US citizenship…They should eventually be allowed to apply for legal status, but NOT citizenship…OR…They should be sent back to their home country? More than 70% of Americans support either “citizenship” or “legal status” for undocumented immigrants. Allowed to Apply for Citizenship Sent Back to Their Home County Allowed to Apply for Legal Status 73% Citizenship 28% Legal Status 38% Sent Home 29% Among GOP Voters
  33. 38 IMMIGRATION NATIONAL – MAY 2014 29% 28% 28% 27%

    35% 36% 37% 43% 30% 31% 29% 24% Tea Party Republicans (62%) Conservative Republicans (77%) Strong Republicans (72%) White Evangelical Republicans (33%) Now, as you may know, there are an estimated 11 million undocumented immigrants living in the U.S. illegally. Which one of the following steps do you believe should be taken regarding these undocumented immigrants... They should eventually be allowed to apply for US citizenship…They should eventually be allowed to apply for legal status, but NOT citizenship…OR…They should be sent back to their home country? Among GOP Groups Citizen Legal Status Deport Citizen Legal Status Deport Citizen Legal Status Deport Citizen Legal Status Deport Key Republican voters support some form of legal status far more than deportation. Data among the GOP Voters (N=505) 64% 64% 65% 70%
  34. 40 IMMIGRATION NATIONAL – MAY 2014 92% 84% 7% 11%

    Total Total Most came to the U.S. to try to make a better life for their family. Agree 69% Strongly Disagree Agree Disagree 51% Strongly Americans believe most came to the US to make a better life for their family and are hard-working people. +85 +73 Most are hard-working people. Now, I’d like to ask you a few more questions regarding these undocumented immigrants... Please tell me if you agree or disagree with each of the following statements regarding these undocumented immigrants...
  35. 41 IMMIGRATION NATIONAL – MAY 2014 70% 72% 27% 22%

    Total Total Many are taking jobs that American workers don’t want. Agree 40% Strongly Disagree Agree Disagree 43% Strongly +43 +50 They came here mainly to access better government services than in their home countries They also believe undocumented immigrants take jobs Americans don’t want and that they come here to access better government services. Now, I’d like to ask you a few more questions regarding these undocumented immigrants... Please tell me if you agree or disagree with each of the following statements regarding these undocumented immigrants...
  36. 43 IMMIGRATION NATIONAL – MAY 2014 When voters were read

    the following immigration and border security proposal... This reform proposal calls for dramatically increasing the number of Border Patrol agents and completing more than 700 miles of fencing along the border between the U.S. and Mexico. It requires that employers verify the legal status of individuals before hiring them to prevent fraud. It establishes a pathway for legal status for the estimated 11 million undocumented immigrants in the country, provided they pass a background check, pay a fine and taxes owed, learn English and wait at least thirteen years until they can become a citizen. Finally, the plan creates a guest worker program for industries like agriculture and construction, and allows more high-skilled immigrants into the country in the areas of hi-tech, science and engineering. Now, I’d like to tell you some information about a proposal to reform the nation’s immigration system, including border security, that is currently being considered by Congress...
  37. 44 IMMIGRATION NATIONAL – MAY 2014 71% 81% 68% 68%

    21% 15% 23% 25% Total GOP (27%) IND (40%) DEM (33%) Now, having heard a little about this proposal, do you favor or oppose it? Favor Oppose Favor Oppose Favor Oppose Favor Oppose They overwhelmingly support it, with greater support among Republicans. +50 +43 +66 +45 Total By Party 32% Strongly 39% Strongly 32% Strongly 26% Strongly
  38. 45 IMMIGRATION NATIONAL – MAY 2014 81% 78% 77% 81%

    13% 16% 17% 14% Tea Party Republicans (62%) Conservative Republicans (77%) Strong Republicans (72%) White Evangelical Republicans (33%) Initial Immigration Proposal Among GOP Groups It wins support from the strongest elements of the GOP. +68 +67 +62 +60 37% Strongly 33% Strongly 34% Strongly 32% Strongly Data among the GOP Voters (N=505) Favor Oppose Favor Oppose Favor Oppose Favor Oppose
  39. What  would  you  say  are  the  parts  of  this  plan

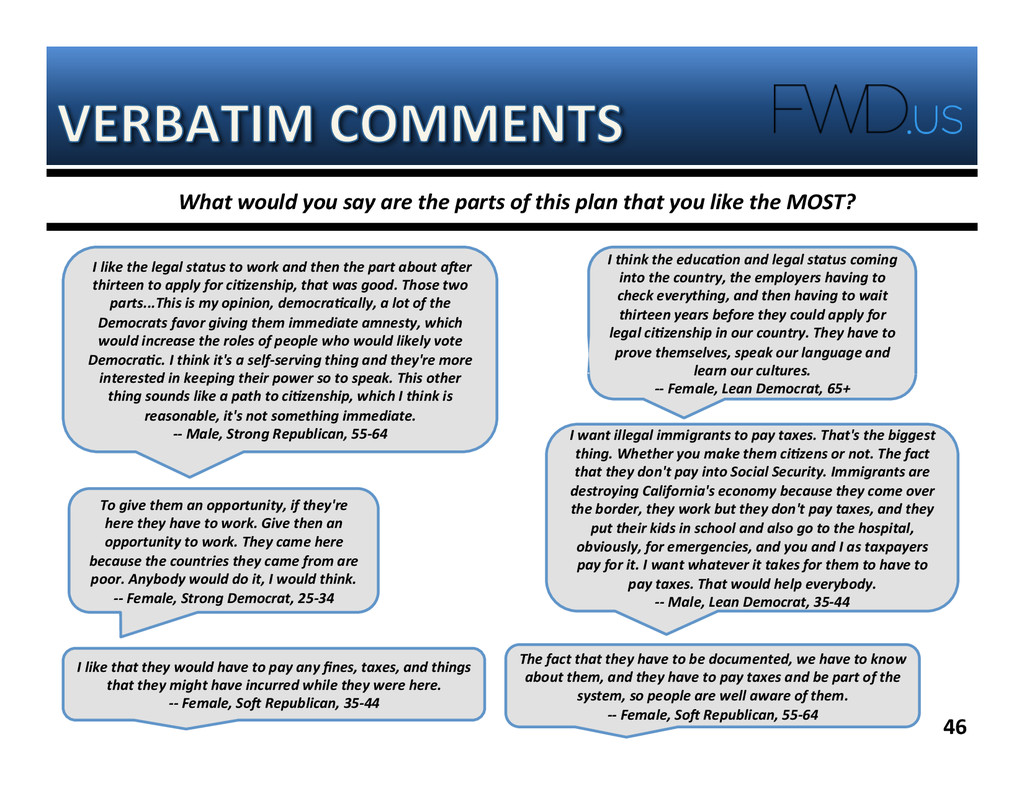
     that  you  like  the  MOST?    I  like  the  legal  status  to  work  and  then  the  part  about  a<er   thirteen  to  apply  for  ci>zenship,  that  was  good.  Those  two   parts...This  is  my  opinion,  democra>cally,  a  lot  of  the   Democrats  favor  giving  them  immediate  amnesty,  which   would  increase  the  roles  of  people  who  would  likely  vote   Democra>c.  I  think  it's  a  self-­‐serving  thing  and  they're  more   interested  in  keeping  their  power  so  to  speak.  This  other   thing  sounds  like  a  path  to  ci>zenship,  which  I  think  is   reasonable,  it's  not  something  immediate.     -­‐-­‐  Male,  Strong  Republican,  55-­‐64   I  think  the  educa>on  and  legal  status  coming   into  the  country,  the  employers  having  to   check  everything,  and  then  having  to  wait   thirteen  years  before  they  could  apply  for   legal  ci>zenship  in  our  country.  They  have  to   prove  themselves,  speak  our  language  and   learn  our  cultures.   -­‐-­‐  Female,  Lean  Democrat,  65+   I  want  illegal  immigrants  to  pay  taxes.  That's  the  biggest   thing.  Whether  you  make  them  ci>zens  or  not.  The  fact   that  they  don't  pay  into  Social  Security.  Immigrants  are   destroying  California's  economy  because  they  come  over   the  border,  they  work  but  they  don't  pay  taxes,  and  they   put  their  kids  in  school  and  also  go  to  the  hospital,   obviously,  for  emergencies,  and  you  and  I  as  taxpayers   pay  for  it.  I  want  whatever  it  takes  for  them  to  have  to   pay  taxes.  That  would  help  everybody.   -­‐-­‐  Male,  Lean  Democrat,  35-­‐44   To  give  them  an  opportunity,  if  they're   here  they  have  to  work.  Give  then  an   opportunity  to  work.  They  came  here   because  the  countries  they  came  from  are   poor.  Anybody  would  do  it,  I  would  think.   -­‐-­‐  Female,  Strong  Democrat,  25-­‐34   I  like  that  they  would  have  to  pay  any  fines,  taxes,  and  things   that  they  might  have  incurred  while  they  were  here.   -­‐-­‐  Female,  So<  Republican,  35-­‐44   The  fact  that  they  have  to  be  documented,  we  have  to  know   about  them,  and  they  have  to  pay  taxes  and  be  part  of  the   system,  so  people  are  well  aware  of  them.   -­‐-­‐  Female,  So<  Republican,  55-­‐64   46  
  40. What  would  you  say  are  the  parts  of  this  plan

     that  you  like  the  LEAST?    Something  about  a  thirteen  year   wai>ng  list.  That  seems  a     liVle  excessive.     -­‐-­‐  Male,  Strong  Republican,  55-­‐64   I  think  the  thirteen  year  wait  for  ci>zenship  should  be   less.  I  don’t  think  they  should  have  to  wait  that  long  as   long  as  there  aren't  any  crimes  involve.   -­‐-­‐  Male,  Strong  Republican,  45-­‐54   Thirteen  years  is  a  long  >me.  I’m  not   sure  about  that  one.  If  we  were  to  go   into  another  country  and  prove  in  the   first  five  years,  then  we  should  be   able  to  become  a  ci>zen.   -­‐-­‐  Female,  Independent,  25-­‐34   The  fencing.  I  think  it's  useless,  they'll   find  a  way  to  get  in  anyways.   -­‐-­‐  Female,  Independent,  65+   More  border  police.  That's  what  I  like  the  least…We   don't  need  more  federal  police.   -­‐-­‐  Male,  So<  Democrat,  25-­‐34   The  border  patrol  stuff.  I  don't  like  to  see  our   money  spent  so  much  on  that  border  patrol.  I   think  thirteen  years  is  a  long  >me,  but  I   would  take  that  over  nothing.   -­‐-­‐  Female,  Strong  Democrat,  55-­‐64   The  part  I  guess  I  like  the  least  is  allowing  more  people  in.  I   think  it  would  allow  more  people  to  come  in  before  we  take   care  of  what's  already  here  in  the  country…Shut  the  border.   The  illegals  who  are  here  now,  they  can  apply  for  background   checks  and  be  allowed  to  stay  here.   -­‐-­‐  Female,  Strong  Republican,  45-­‐54   I  like  all  of  it  preVy  good.  We're  going  to  have   immigrants,  we  just  need  to  make  sure  that  they  are   produc>ve  ci>zens.  That's  all  I  have  to  say.  That  they   pay  their  share  of  the  taxes  like  we  do.     -­‐-­‐  Female,  Strong  Democrat,  65+   47  
  41. 48 IMMIGRATION NATIONAL – MAY 2014 33% 39% 54% 55%

    Total Total And, do you favor or oppose providing amnesty for people living in the U.S. illegally?* Favor 14% Strongly Oppose 38% Strongly Favor Oppose 18% Strongly 40% Strongly Americans clearly oppose “amnesty” for undocumented immigrants living in the US illegally. -21 -16 And, do you favor or oppose providing amnesty for people living in the U.S. illegally, meaning that they would be forgiven for breaking the law when they first came to the U.S.?^ *Asked Among Sample A Only ^Asked Among Sample B Only
  42. 49 IMMIGRATION NATIONAL – MAY 2014 54% 57% 51% 55%

    23% 23% 24% 21% Total GOP (27%) IND (40%) DEM (33%) And, do you believe that this proposal is a fair and equitable plan to deal with the 11 million undocumented immigrants living in the country, or do you believe it provides amnesty for those immigrants? Fair & Equitable Provides Amnesty Fair & Equitable Provides Amnesty Fair & Equitable Provides Amnesty Fair & Equitable Provides Amnesty But, Americans don’t believe this plan provides amnesty. +31 +34 +34 +27 Total By Party
  43. 50 IMMIGRATION NATIONAL – MAY 2014 57% 53% 51% 55%

    26% 28% 29% 24% Tea Party Republicans (62%) Conservative Republicans (77%) Strong Republicans (72%) White Evangelical Republicans (33%) And, do you believe that this proposal is a fair and equitable plan to deal with the 11 million undocumented immigrants living in the country, or do you believe it provides amnesty for those immigrants? Fair & Equitable Provides Amnesty Fair & Equitable Provides Amnesty Fair & Equitable Provides Amnesty Fair & Equitable Provides Amnesty Neither do key Republican groups. +31 +31 +25 +22 Among GOP Groups Data among the GOP Voters (N=505)
  44. 51 IMMIGRATION NATIONAL – MAY 2014 75% 19% Oppose Amnesty

    (54%) Initial Immigration Proposal Among Voters who are Opposed to Amnesty Favor 34% Strongly Oppose In fact, those voters who oppose amnesty overwhelmingly support this immigration plan. +56
  45. 52 IMMIGRATION NATIONAL – MAY 2014 50% 35% 45% 69%

    37% 52% 41% 19% Total GOP (27%) IND (40%) DEM (33%) Now, assuming that this legislation is approved by both the Republican controlled House of Representatives and the Democratic controlled Senate, and signed into law by President Obama, do you believe the Administration would use the power of the federal government to fully enforce the law? Would Enforce Wouldn’t Enforce Would Enforce Wouldn’t Enforce Would Enforce Wouldn’t Enforce Would Enforce Wouldn’t Enforce Independents and Republicans have questions as to whether the Obama Administration would “use the power of the federal government to fully enforce” this new law. +13 +50 -17 +4 Total By Party
  46. 54 IMMIGRATION NATIONAL – MAY 2014 47% 50% 40% 38%

    Total Total How likely would you say you are to vote for the Republican candidate for Congress from your district? Likely 13% Extremely Not Likely 27% Not At All Likely Not Likely 13% Extremely 25% Not At All Americans give the Democratic candidate a slight edge when asked their likelihood of supporting that candidate in their home district. +7 +12 How likely would you say you are to vote for the Democratic candidate for Congress from your district?
  47. 55 IMMIGRATION NATIONAL – MAY 2014 But, when support for

    this immigration proposal is “attached” to the GOP candidate... The Republican candidate for Congress supports this immigration and border security reform proposal, and says that while this proposal is not perfect, it secures the border to stop the flow of illegal immigration, it makes illegal immigrants who are living here pay a price for their actions by paying a fine and taxes owed, it requires them to learn English, and wait at least thirteen years before becoming a citizen. This candidate says that it is simply unrealistic to believe that we can deport 11 million people back to their home countries. Now, let’s just suppose that the November 2014 election was being held today, and that this immigration and border security reform proposal was a key issue in the campaign for Congress in your district. How likely would you say you are to vote for the Republican candidate for Congress in your district if the candidate’s position on this issue was the following:
  48. 56 IMMIGRATION NATIONAL – MAY 2014 47% 66% 40% 28%

    Total Total How likely would you say you are to vote for the Republican candidate for Congress in your district? Support for the GOP candidate surges. Likely 13% Extremely Not Likely 27% Not At All Likely Not Likely 13% Extremely 18% Not At All +7 +38 Initial GOP Vote Informed GOP Vote
  49. 57 IMMIGRATION NATIONAL – MAY 2014 91% 88% 89% 89%

    6% 8% 7% 8% Tea Party GOP (62%) Cons GOP (77%) Strong GOP (72%) White Evang. GOP (33%) Informed GOP Vote: By GOP Groups Support for the GOP candidate remains strong among key GOP groups. 94% 92% 94% 93% 2% 2% 2% 2% Tea Party GOP (62%) Cons GOP (77%) Strong GOP (72%) White Evang. GOP (33%) Initial GOP Vote: By GOP Groups Likely Likely +92 Likely Likely +90 +92 +91 +85 +80 +82 +81 Likely Likely Likely Likely Data among the GOP Voters (N=505)
  50. 58 IMMIGRATION NATIONAL – MAY 2014 47% 15% 32% 79%

    IND (40%) DEM (33%) 70% 45% 25% 50% IND (40%) DEM (33%) Informed GOP Vote: By Party Initial GOP Vote: By Party While support for the GOP candidate increases significantly among INDs and DEMs... Likely Not Likely Likely Not Likely -64 +15 -5 +45 Likely Not Likely Likely Not Likely
  51. 59 IMMIGRATION NATIONAL – MAY 2014 89% 83% 47% 46%

    17% 14% 8% 6% 34% 30% 74% 82% GOP Men (12%) GOP Women (15%) IND Men (23%) IND Women (17%) DEM Men (13%) DEM Women (19%) 87% 88% 66% 74% 48% 42% 9% 6% 28% 20% 44% 54% GOP Men (12%) GOP Women (15%) IND Men (23%) IND Women (17%) DEM Men (13%) DEM Women (19%) Informed GOP Vote: By Party/Gender Initial GOP Vote: By Party/Gender …Independent women… Likely Likely Likely Not Likely Not Likely Likely Not Not Likely Likely Likely Not Likely Not Likely Likely Not Not +81 -68 +16 -57 +13 +77 +78 -12 +54 +4 +38 +82
  52. 60 IMMIGRATION NATIONAL – MAY 2014 67% 67% 56% 75%

    29% 27% 37% 22% Single Men (21%) Married Men (26%) Single Women (21%) Married Women (29%) 45% 53% 33% 54% 45% 34% 52% 34% Single Men (21%) Married Men (26%) Single Women (21%) Married Women (29%) Informed GOP Vote: By Gender/Relationship Status Initial GOP Vote: By Gender/Relationship Status …Single voters... Likely Not Likely Likely Not Likely Likely Not Likely Likely Not Likely Likely Not Likely Likely Not Likely Likely Not Likely Likely Not Likely -0- +20 +19 -19 +38 +53 +40 +19
  53. 61 IMMIGRATION NATIONAL – MAY 2014 80% 66% 44% 14%

    28% 53% Conservative (41%) Moderate (33%) Liberal (21%) Informed GOP Vote: By Ideology …Moderates... Likely Not Likely Likely Not Likely Likely Not Likely +66 -9 +38 70% 42% 17% 18% 46% 42% Conservative (41%) Moderate (33%) Liberal (21%) Likely Not Likely Likely Not Likely Likely Not Likely +52 -25 -4 Initial GOP Vote: By Ideology
  54. 62 IMMIGRATION NATIONAL – MAY 2014 42% 53% 46% 48%

    44% 46% 38% 40% 39% 39% 18-34 (23%) 35-44 (22%) 45-54 (17%) 55-64 (21%) 65+ (15%) Informed GOP Vote: By Age Initial GOP Vote: By Age …And younger voters. Likely Not Likely Not Likely Not Likely Not -4 +5 +15 +6 Likely Not +9 71% 68% 66% 65% 63% 27% 28% 27% 30% 28% 18-34 (23%) 35-44 (22%) 45-54 (17%) 55-64 (21%) 65+ (15%) Likely Not Likely Not Likely Not Likely Not +44 +35 +40 +39 Likely Not +35
  55. 63 IMMIGRATION NATIONAL – MAY 2014 And, when specifically asked

    of a Republican primary audience… Republican candidate A supports this immigration and border security reform proposal, and says that while this proposal is not perfect, it secures the border to stop the flow of illegal immigration, it makes illegal immigrants who are living here pay a price for their actions by paying a fine and taxes owed, it requires them to learn English, and wait at least thirteen years before becoming a citizen. This candidate says that it is simply unrealistic to believe that we can deport 11 million people back to their home countries. Republican candidate B opposes this immigration reform proposal, and says that it is little more than an amnesty plan providing a pathway to citizenship for undocumented immigrants. Candidate B says that this is the wrong approach because it rewards criminal behavior, and that once our nation’s borders are secure, all illegals should be sent back to their home countries. Now, let’s just suppose a Republican primary election for Congress were being held in your district, and that this immigration and border security reform proposal was a key issue in the campaign.
  56. 64 IMMIGRATION NATIONAL – MAY 2014 70% 66% 67% 65%

    67% 21% 25% 25% 26% 24% Total Tea Party Republicans (62%) Conservative Republicans (77%) Strong Republicans (72%) White Evangelical Republicans (33%) Now, based on their positions on this issue, for which Republican candidate for Congress would you vote, candidate A or B? Cand A 31% Definite Cand B Cand A 30% Definite Cand B Cand A 30% Definite Cand B Cand A 30% Definite Cand B Cand A 28% Definite Cand B Potential GOP primary voters overwhelmingly support a pro-immigration reform candidate over one who "wants to send them home." +49 +43 +42 +39 +41 Total* By Key GOP Groups^ *Overall data among Republicans and Independents leaning Republican ^Subgroup data among the GOP oversample (N=505)
  57. 66 IMMIGRATION NATIONAL – MAY 2014 62% 60% 84% 85%

    % Strongly Favor Total Favor This reform proposal puts in place a national E-Verify system so employers can quickly confirm that people seeking jobs are in the country legally before hiring them. This proposal allows those undocumented immigrants who were brought to the U.S. as children through no fault of their own to earn their citizenship if they received a high school degree and attended college or served in the military. The “E-Verify” and “Dream Act” provisions are the most popular. Now, I’d like to tell you a little more about some of the specific provisions of this proposal to reform the nation’s immigration system and border security, and please tell me if you favor or oppose each one... 81% 84% 85% 81% 84% 88% GOP (27%) IND (40%) DEM (33%) % Total Favor shown in Party Results Above
  58. 67 IMMIGRATION NATIONAL – MAY 2014 Immigration Reform Provisions %

    Total Favor: By Party Total GOP (27%) IND (40%) DEM (33%) This proposal creates a start-up visa for entrepreneurs who want to come to the U.S. to build companies that create American jobs. 78% 71% 81% 81% The proposal provides a pathway for legal status for the 11 million undocumented immigrants living in the U.S., provided they pass a criminal background check, pay a fine and taxes owed, learn English and wait at least thirteen years until they can become a citizen. 76% 79% 72% 78% The proposal calls for dramatically increasing the number of Border Patrol agents, updating the technology and equipment requested by the Border Patrol to achieve full surveillance of the border, completing more than 700 miles of fencing along the border between the U.S. and Mexico and implementing an electronic visa entry and exit system at all air and sea ports of entry. 74% 82% 71% 72% This proposal creates a guest-worker program to address labor shortages in specific industries like agriculture and construction, and allowing more high-skilled immigrants into the country in the technology, science and engineering fields. 73% 72% 72% 76% The other four provisions tested also win strong support across party lines.
  59. 68 IMMIGRATION NATIONAL – MAY 2014 71% 81% 68% 68%

    21% 15% 23% 25% Total GOP (27%) IND (40%) DEM (33%) 78% 82% 74% 79% 18% 14% 21% 17% Total GOP (27%) IND (40%) DEM (33%) Final Immigration & Border Security Reform Proposal: Overall & By Party Initial Immigration & Border Security Reform Proposal: Overall & By Party Having heard the specifics, support for the immigration and border security reform proposal increases. (With gains coming mostly from Democrats.) Favor Oppose Favor Favor Oppose Favor Oppose Favor Oppose Favor Favor Oppose Favor Oppose +50 +43 +66 +45 +60 +62 +68 +53
  60. 70 IMMIGRATION NATIONAL – MAY 2014 Take-Away Points Ø  Americans

    overwhelmingly believe the immigration system in the country is broken and that Congress should take immediate action to fix it. Republicans are more convinced than either Democrats or Independents that immediate action is necessary. Ø  Most Americans don’t believe “deportation” is a viable policy with respect to undocumented immigrants. In fact, there is an overwhelming consensus in support of some kind of legalization for undocumented immigrants (either “legal status” or “citizenship”). Ø  There is broad support for the immigration reform and border security proposal that was put forward. Republicans showed significantly higher support for the proposal than either Democrats or Independents, with more than 75% of Tea Party Republicans, conservative Republicans and white evangelical Republicans all supporting it.
  61. 71 IMMIGRATION NATIONAL – MAY 2014 Ø  A clear majority

    of Americans oppose amnesty for undocumented immigrants, but by more than a two-to-one margin, voters do not believe that this immigration reform plan provides amnesty. In fact, by a 75%-19% margin, voters who oppose amnesty support this immigration proposal. Ø  Supporting this new immigration reform proposal should be good electoral politics for Republicans. Potential overall support for a Republican candidate for Congress jumps nearly 20 points after voters learn that the candidate supports this legislation, including large movement with swing voters like moderates, single voters, Independent women and younger voters. Further, these GOP candidates’ conservative and partisan bases remain intact after learning of the candidate’s support for the proposal. Take-Away Points
  62. 72 IMMIGRATION NATIONAL – MAY 2014 There is a strong

    sentiment in the country that undocumented immigrants should not be granted amnesty; this immigration reform proposal addresses that issue by requiring that undocumented immigrants pay a fine, taxes owed, learn English and wait at least thirteen years until they can become citizens. Americans across party lines believe this is not amnesty, but rather a fair and equitable way of dealing with the eleven million undocumented immigrants in the country. Hitting the 70% mark nationwide, this proposal wins broad support from the electorate. Finally, this generates a more positive electoral environment for Republicans, as it creates an opening to a significant number of swing voters for GOP candidates. The Bottom Line
  63. American  Viewpoint   Linda  DiVall   Randy  Gutermuth    

    Basswood  Research   Jon  Lerner     GS  Strategy  Group   Greg  Strimple   Brooks  Kochvar     Moore  InformaLon   Hans  Kaiser     North  Star  Opinion  Research   Whit  Ayres   Jon  McHenry   Dan  Judy           The  Polling  Company   Kellyanne  Conway     Public  Opinion  Strategies   Neil  Newhouse     The  Tarrance  Group   Brian  Tringali   BJ  MarLno     The  Winston  Group   David  Winston   Myra  Miller         WPA  Opinion  Research   Chris  Perkins