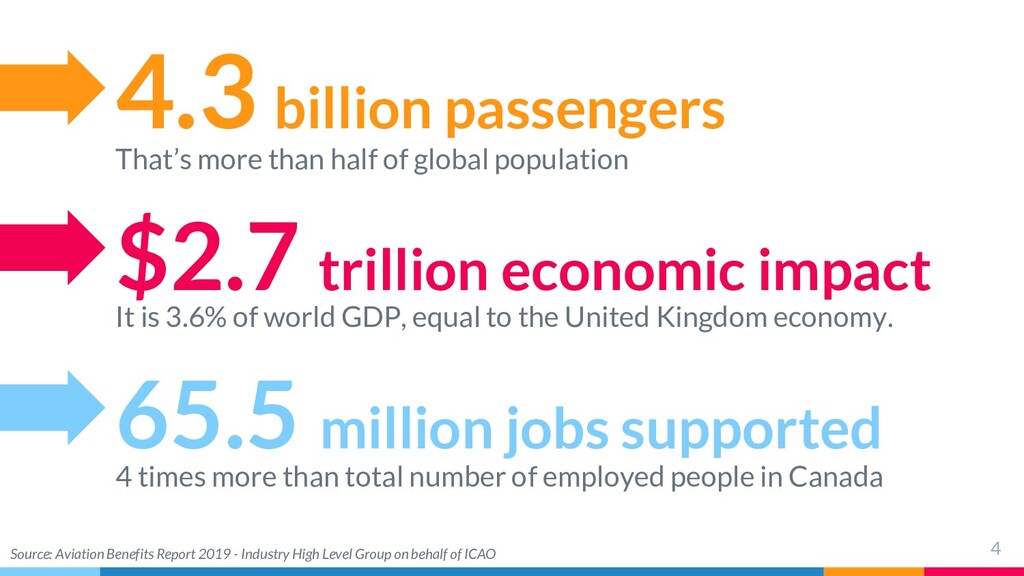
65.5 million jobs supported 4 times more than total number of employed people in Canada $2.7 trillion economic impact It is 3.6% of world GDP, equal to the United Kingdom economy. 4 Source: Aviation Benefits Report 2019 - Industry High Level Group on behalf of ICAO
▷4.2% of GDP ▷6.5M jobs supported by air transport sector ▷$779 billion GVA contribution to GDP China ▷0.93% of GDP ▷6M jobs supported by air transport sector ▷$104 billion GVA contribution to GDP France ▷4.3% of GDP ▷1.1M jobs supported by air transport sector ▷$105 billion GVA contribution to GDP 5 What about Russia?... Note: GVA – Gross Value Added; GDP – Gross Domestic Product Source: Aviation Benefits Beyond Borders Reports 2018
pro.fira.ru, SPARK- Interfax, disclosure.ru, e-disclosure.ru Review of literature Academic journals, books, technical reports, working papers Methodology On the basis of Oxford Economics and United Nations ones 7
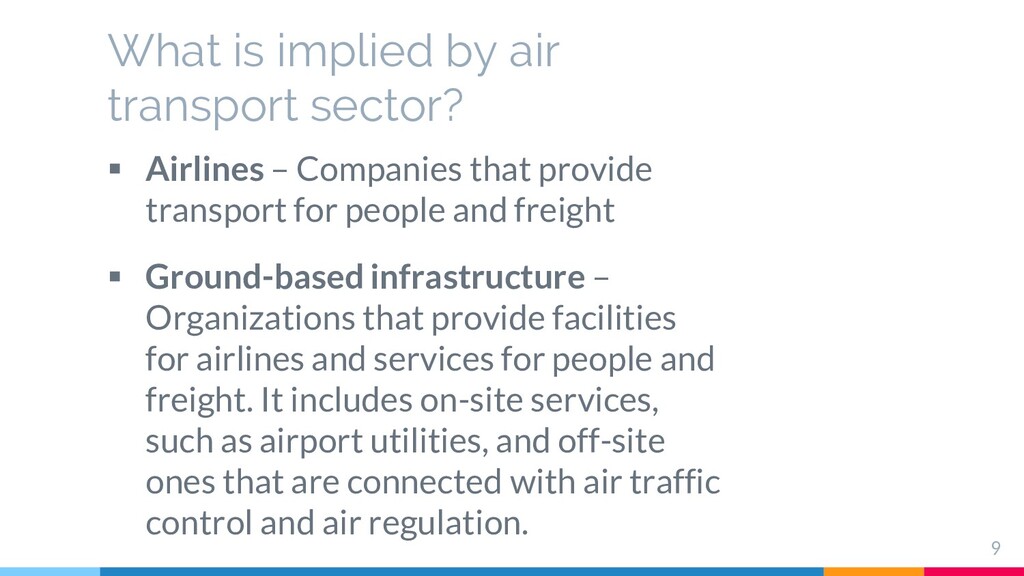
– Companies that provide transport for people and freight ▪ Ground-based infrastructure – Organizations that provide facilities for airlines and services for people and freight. It includes on-site services, such as airport utilities, and off-site ones that are connected with air traffic control and air regulation.
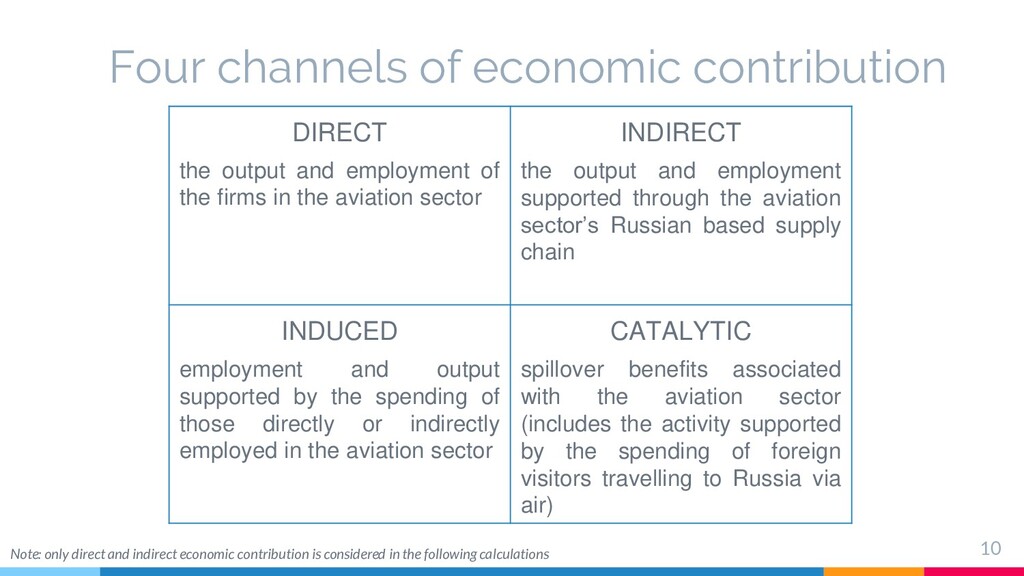
employment of the firms in the aviation sector INDIRECT the output and employment supported through the aviation sector’s Russian based supply chain INDUCED employment and output supported by the spending of those directly or indirectly employed in the aviation sector CATALYTIC spillover benefits associated with the aviation sector (includes the activity supported by the spending of foreign visitors travelling to Russia via air) Note: only direct and indirect economic contribution is considered in the following calculations
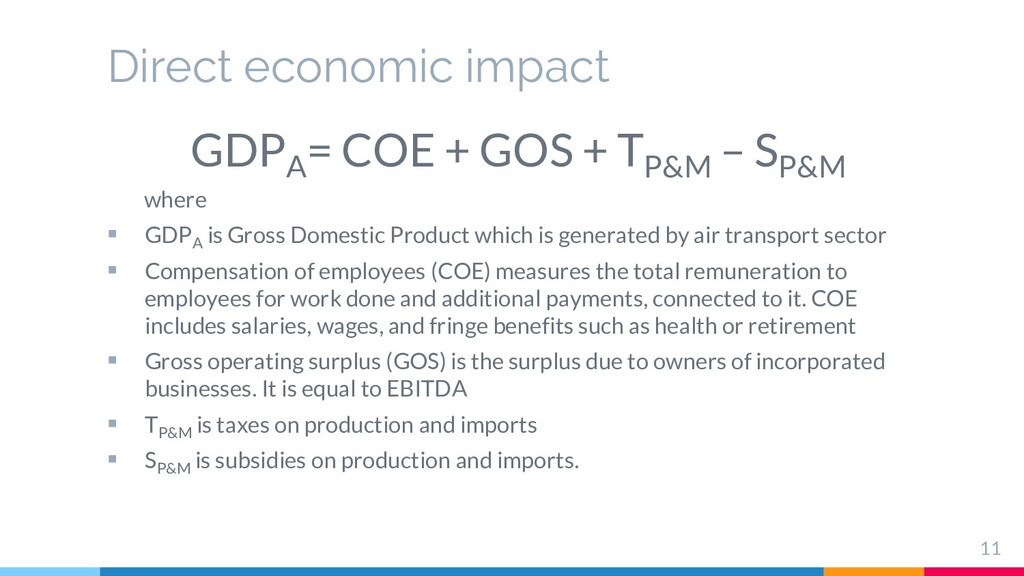
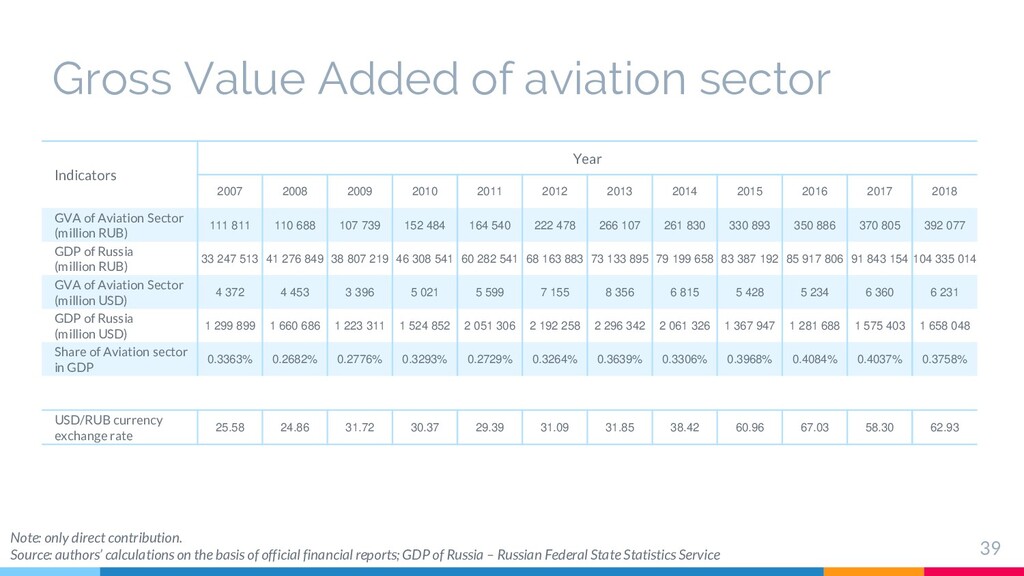
T P&M – S P&M where ▪ GDP A is Gross Domestic Product which is generated by air transport sector ▪ Compensation of employees (COE) measures the total remuneration to employees for work done and additional payments, connected to it. COE includes salaries, wages, and fringe benefits such as health or retirement ▪ Gross operating surplus (GOS) is the surplus due to owners of incorporated businesses. It is equal to EBITDA ▪ T P&M is taxes on production and imports ▪ S P&M is subsidies on production and imports. 11
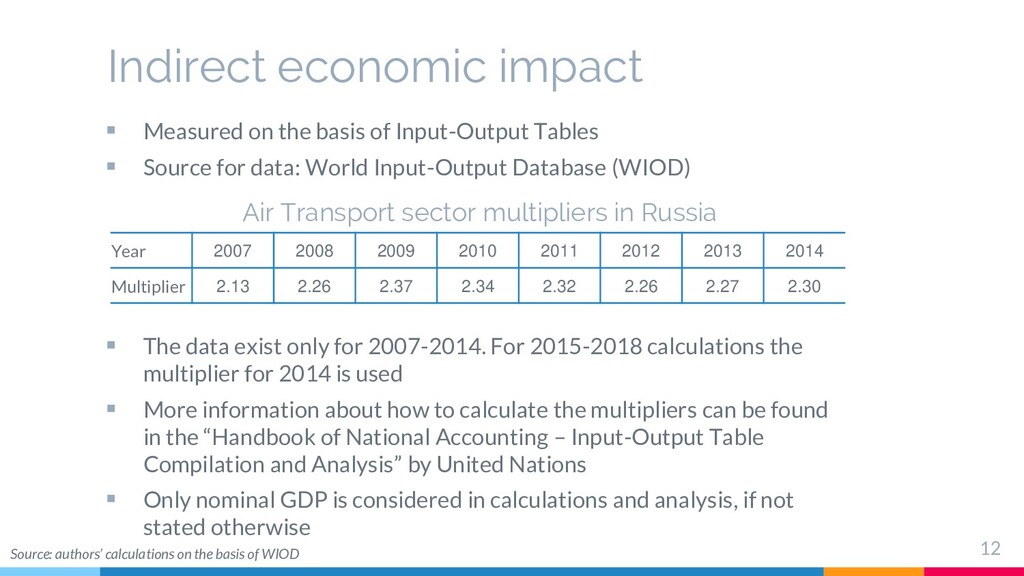
Tables ▪ Source for data: World Input-Output Database (WIOD) ▪ The data exist only for 2007-2014. For 2015-2018 calculations the multiplier for 2014 is used ▪ More information about how to calculate the multipliers can be found in the “Handbook of National Accounting – Input-Output Table Compilation and Analysis” by United Nations ▪ Only nominal GDP is considered in calculations and analysis, if not stated otherwise 12 Year 2007 2008 2009 2010 2011 2012 2013 2014 Multiplier 2.13 2.26 2.37 2.34 2.32 2.26 2.27 2.30 Air Transport sector multipliers in Russia Source: authors’ calculations on the basis of WIOD
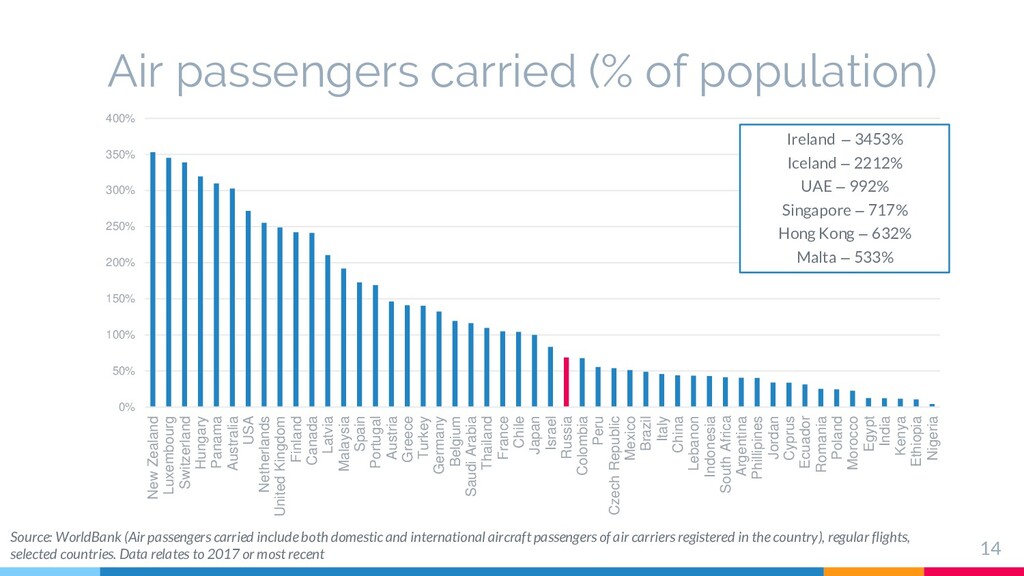
Zealand Luxembourg Switzerland Hungary Panama Australia USA Netherlands United Kingdom Finland Canada Latvia Malaysia Spain Portugal Austria Greece Turkey Germany Belgium Saudi Arabia Thailand France Chile Japan Israel Russia Colombia Peru Czech Republic Mexico Brazil Italy China Lebanon Indonesia South Africa Argentina Phillipines Jordan Cyprus Ecuador Romania Poland Morocco Egypt India Kenya Ethiopia Nigeria Air passengers carried (% of population) 14 Ireland – 3453% Iceland – 2212% UAE – 992% Singapore – 717% Hong Kong – 632% Malta – 533% Source: WorldBank (Air passengers carried include both domestic and international aircraft passengers of air carriers registered in the country), regular flights, selected countries. Data relates to 2017 or most recent
carried; ▷ All of the countries ahead, except Panama, Thailand, Chile have higher GDP (PPP) per capita. Russia Countries at the top ▷ Are small by territory and population; ▷ Have a major carrier (e.g. Ireland – Ryanair; Hungary – WizzAir; UAE – Emirates); ▷ Primarily rely on transit passenger flow. 15 Countries at the bottom ▷ Are Developing or Least Developed; ▷ Have big population (Kenya – 50M, Ethiopia – 105M, Nigeria – 191M, India – 1.4B); ▷ Are still far ahead of the countries in their regions (Africa, South Asia). Note: if to take all of the countries, for which WorldBank has statistics, then Russia is ranked 54th of 159
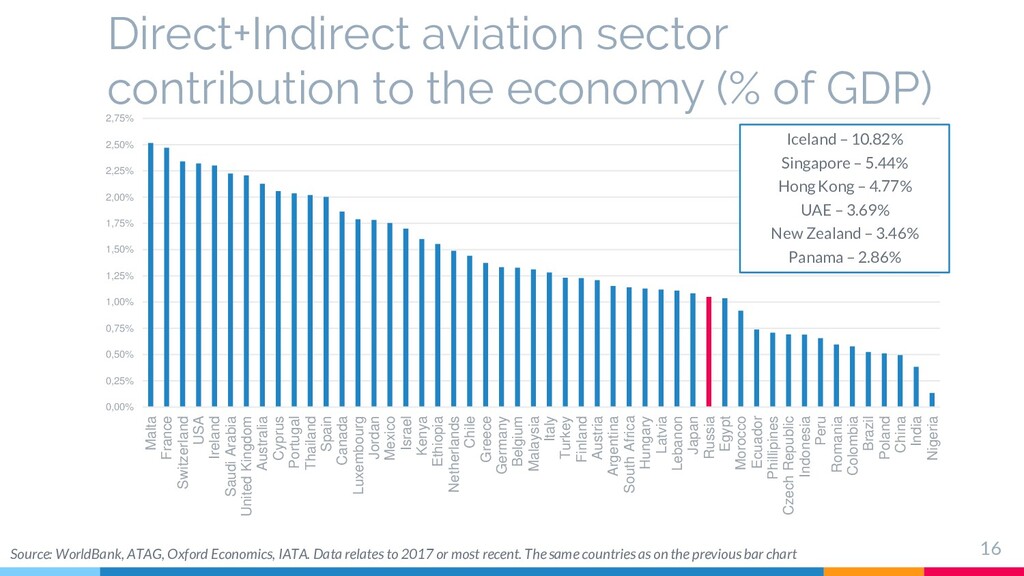
2,50% 2,75% Malta France Switzerland USA Ireland Saudi Arabia United Kingdom Australia Cyprus Portugal Thailand Spain Canada Luxembourg Jordan Mexico Israel Kenya Ethiopia Netherlands Chile Greece Germany Belgium Malaysia Italy Turkey Finland Austria Argentina South Africa Hungary Latvia Lebanon Japan Russia Egypt Morocco Ecuador Phillipines Czech Republic Indonesia Peru Romania Colombia Brazil Poland China India Nigeria Direct+Indirect aviation sector contribution to the economy (% of GDP) 16 Iceland – 10.82% Singapore – 5.44% Hong Kong – 4.77% UAE – 3.69% New Zealand – 3.46% Panama – 2.86% Source: WorldBank, ATAG, Oxford Economics, IATA. Data relates to 2017 or most recent. The same countries as on the previous bar chart
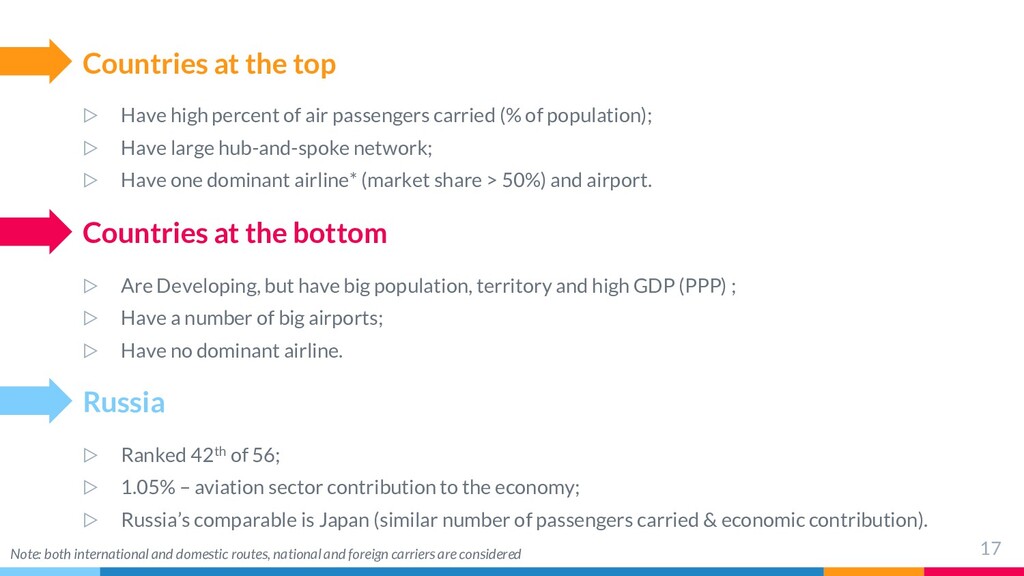
contribution to the economy; ▷ Russia’s comparable is Japan (similar number of passengers carried & economic contribution). Russia Countries at the top ▷ Have high percent of air passengers carried (% of population); ▷ Have large hub-and-spoke network; ▷ Have one dominant airline* (market share > 50%) and airport. 17 Countries at the bottom ▷ Are Developing, but have big population, territory and high GDP (PPP) ; ▷ Have a number of big airports; ▷ Have no dominant airline. Note: both international and domestic routes, national and foreign carriers are considered
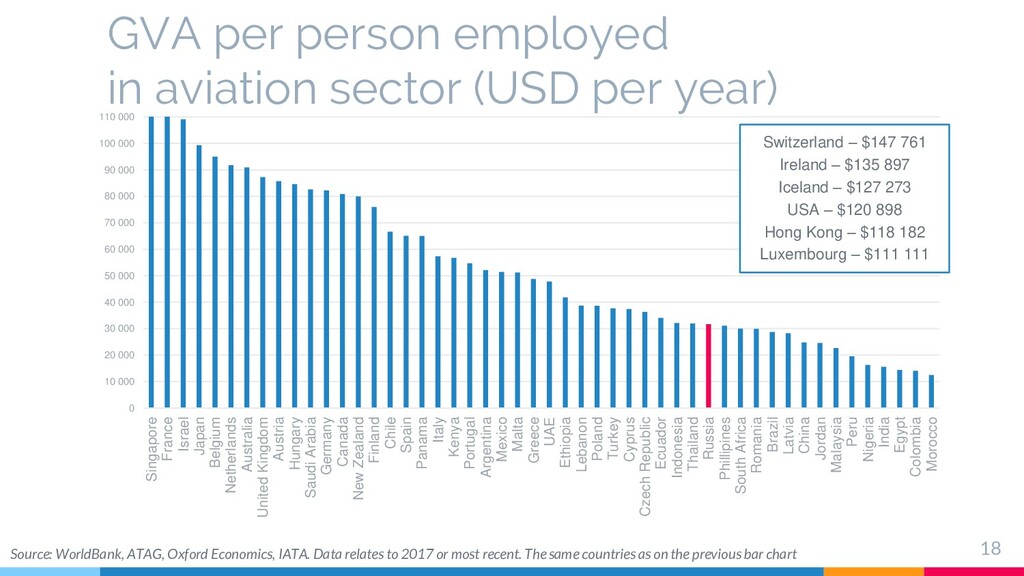
000 60 000 70 000 80 000 90 000 100 000 110 000 Singapore France Israel Japan Belgium Netherlands Australia United Kingdom Austria Hungary Saudi Arabia Germany Canada New Zealand Finland Chile Spain Panama Italy Kenya Portugal Argentina Mexico Malta Greece UAE Ethiopia Lebanon Poland Turkey Cyprus Czech Republic Ecuador Indonesia Thailand Russia Phillipines South Africa Romania Brazil Latvia China Jordan Malaysia Peru Nigeria India Egypt Colombia Morocco GVA per person employed in aviation sector (USD per year) 18 Switzerland – $147 761 Ireland – $135 897 Iceland – $127 273 USA – $120 898 Hong Kong – $118 182 Luxembourg – $111 111 Source: WorldBank, ATAG, Oxford Economics, IATA. Data relates to 2017 or most recent. The same countries as on the previous bar chart
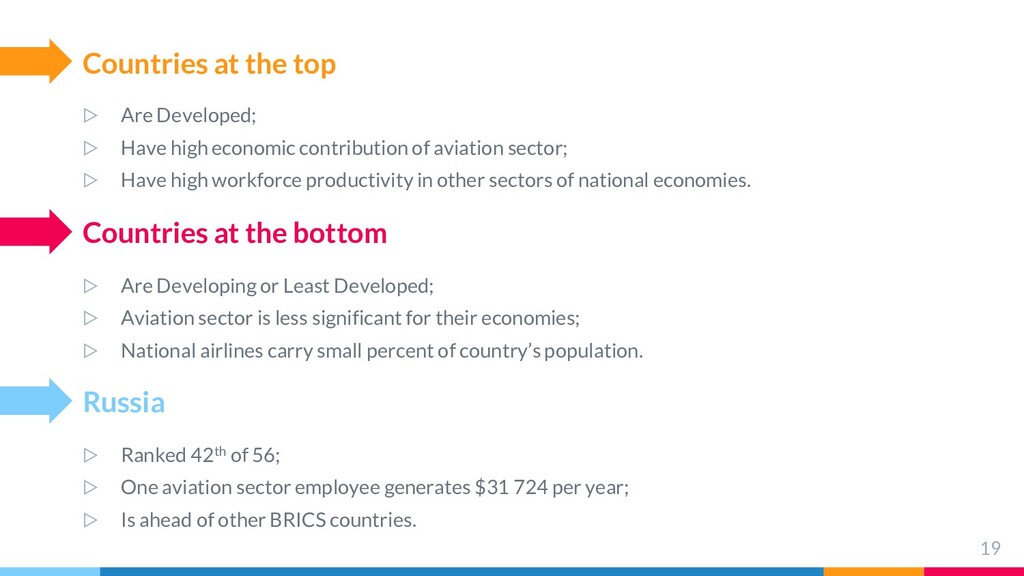
generates $31 724 per year; ▷ Is ahead of other BRICS countries. Russia Countries at the top ▷ Are Developed; ▷ Have high economic contribution of aviation sector; ▷ Have high workforce productivity in other sectors of national economies. 19 Countries at the bottom ▷ Are Developing or Least Developed; ▷ Aviation sector is less significant for their economies; ▷ National airlines carry small percent of country’s population.
20 ▷ Is Developed; ▷ Has high level of workforce productivity in the whole economy; ▷ Is located NOT in Africa, South America or Oceania; ▷ Has small population; ▷ Has one major airline; ▷ Has one big hub airport; ▷ Relies on transit passengers taking international flights.
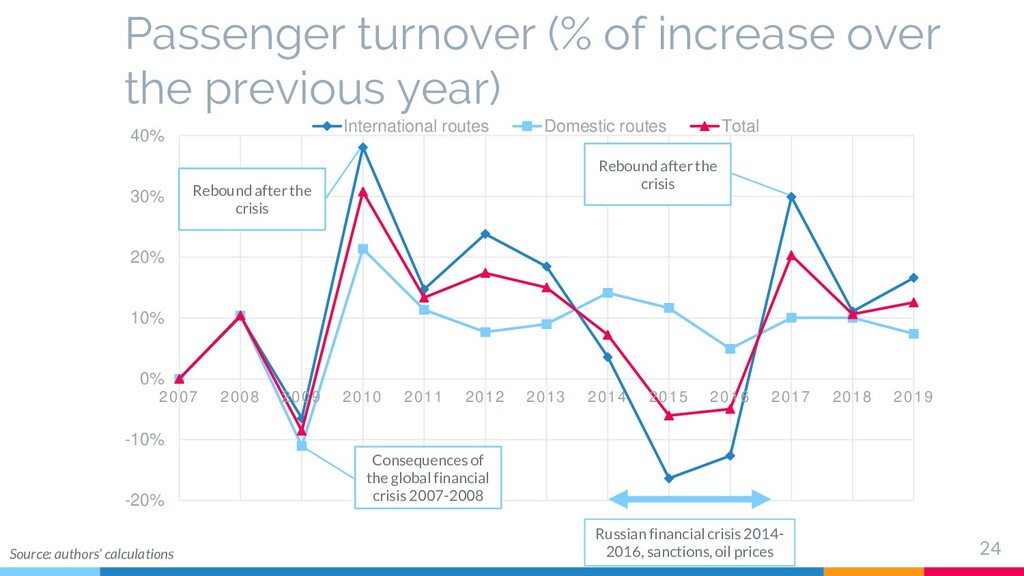
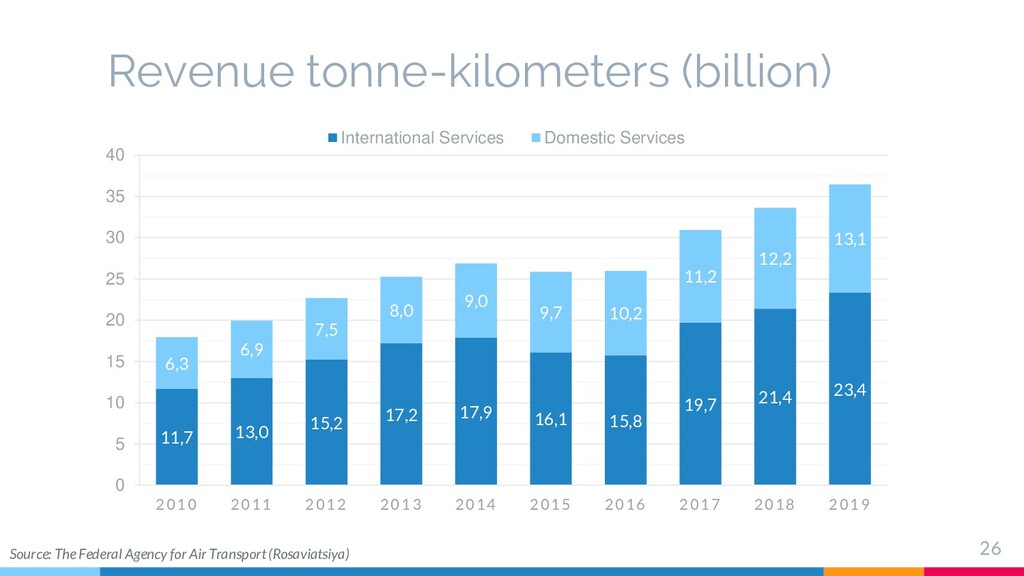
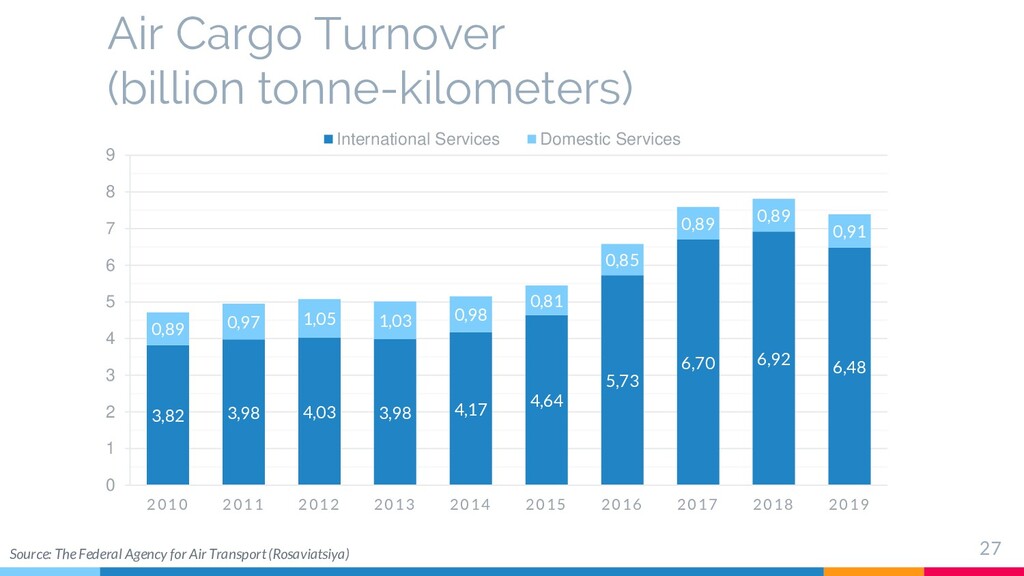
2010 2011 2012 2013 2014 2015 2016 2017 2018 2019 International routes Domestic routes Total 24 Consequences of the global financial crisis 2007-2008 Passenger turnover (% of increase over the previous year) Rebound after the crisis Russian financial crisis 2014- 2016, sanctions, oil prices Rebound after the crisis Source: authors’ calculations
lower the growth of domestic ones; ▷ Financial crises have strong effect on the passenger turnover; ▷ There were 3 years of decrease out of 12. Total International routes ▷ Fluctuate more significantly; ▷ Depend on Ruble exchange rate; ▷ Grow easier after financial crises. 25 Domestic routes ▷ Show stable growth (except 2009); ▷ Were not highly affected by Russian financial crisis 2014-2016; ▷ Annual growth rate has not increased 10% since 2015. Note: TO – turnover
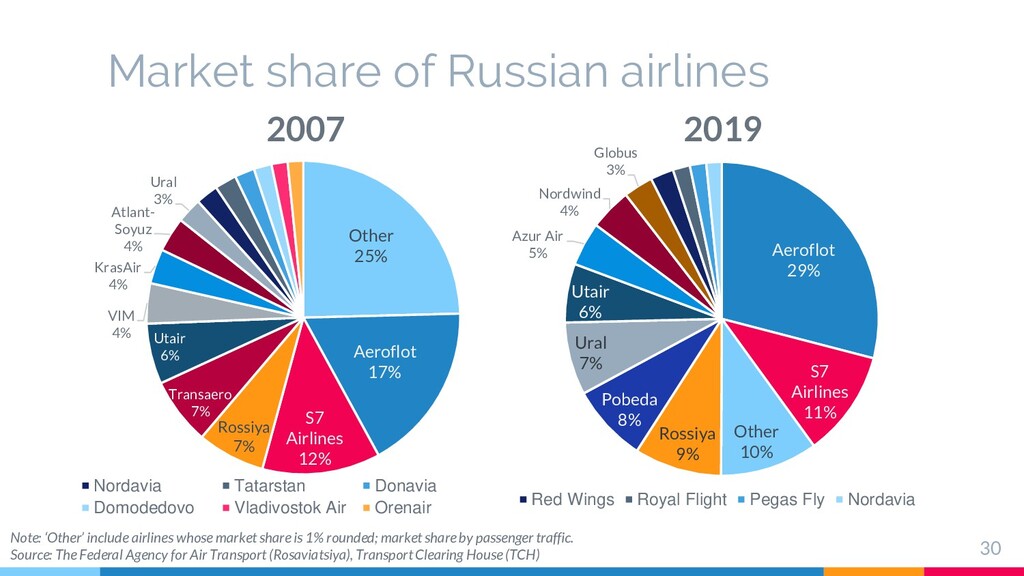
11% Other 10% Rossiya 9% Pobeda 8% Ural 7% Utair 6% Azur Air 5% Nordwind 4% Globus 3% Red Wings Royal Flight Pegas Fly Nordavia Other 25% Aeroflot 17% S7 Airlines 12% Rossiya 7% Transaero 7% Utair 6% VIM 4% KrasAir 4% Atlant- Soyuz 4% Ural 3% Nordavia Tatarstan Donavia Domodedovo Vladivostok Air Orenair Note: ‘Other’ include airlines whose market share is 1% rounded; market share by passenger traffic. Source: The Federal Agency for Air Transport (Rosaviatsiya), Transport Clearing House (TCH) 2007 2019
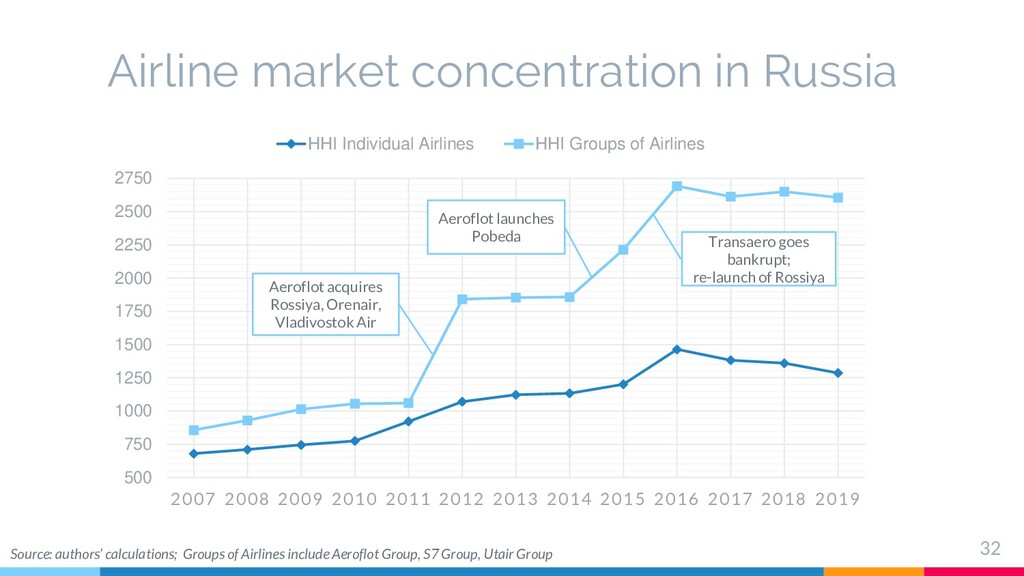
2007 2008 2009 2010 2011 2012 2013 2014 2015 2016 2017 2018 2019 HHI Individual Airlines HHI Groups of Airlines 32 Airline market concentration in Russia Source: authors’ calculations; Groups of Airlines include Aeroflot Group, S7 Group, Utair Group Aeroflot acquires Rossiya, Orenair, Vladivostok Air Aeroflot launches Pobeda Transaero goes bankrupt; re-launch of Rossiya
market share – 47%); ▷ S7 Group: S7 Airlines, Globus (the overall market share – 14%); ▷ For the comparison: HHI in the USA in 2018 – 1 157, in the UK – 2 757. Russian market has large groups of airlines The HHI indicates market concentration ▷ HHI below 100 indicates a highly competitive industry; ▷ HHI below 1 500 indicates an unconcentrated industry; ▷ HHI between 1 500 and 2 500 indicates moderate concentration; ▷ HHI above 2 500 indicates high concentration. 33 The higher the HHI, the less competitive market is ▷ The higher the prices are; ▷ The lower the quality of product is; ▷ The worse for a customer.
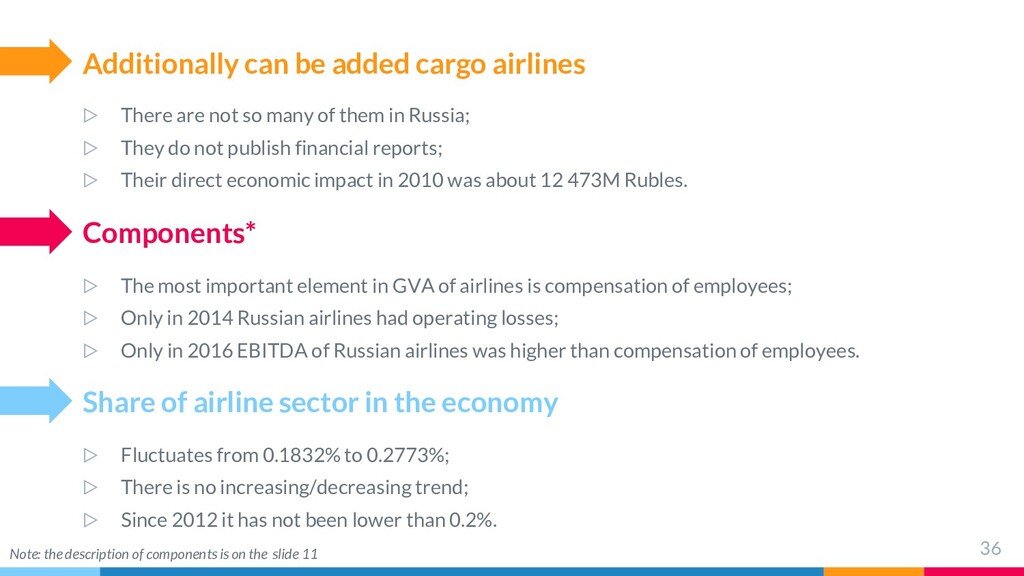
increasing/decreasing trend; ▷ Since 2012 it has not been lower than 0.2%. Share of airline sector in the economy Additionally can be added cargo airlines ▷ There are not so many of them in Russia; ▷ They do not publish financial reports; ▷ Their direct economic impact in 2010 was about 12 473M Rubles. 36 Components* ▷ The most important element in GVA of airlines is compensation of employees; ▷ Only in 2014 Russian airlines had operating losses; ▷ Only in 2016 EBITDA of Russian airlines was higher than compensation of employees. Note: the description of components is on the slide 11
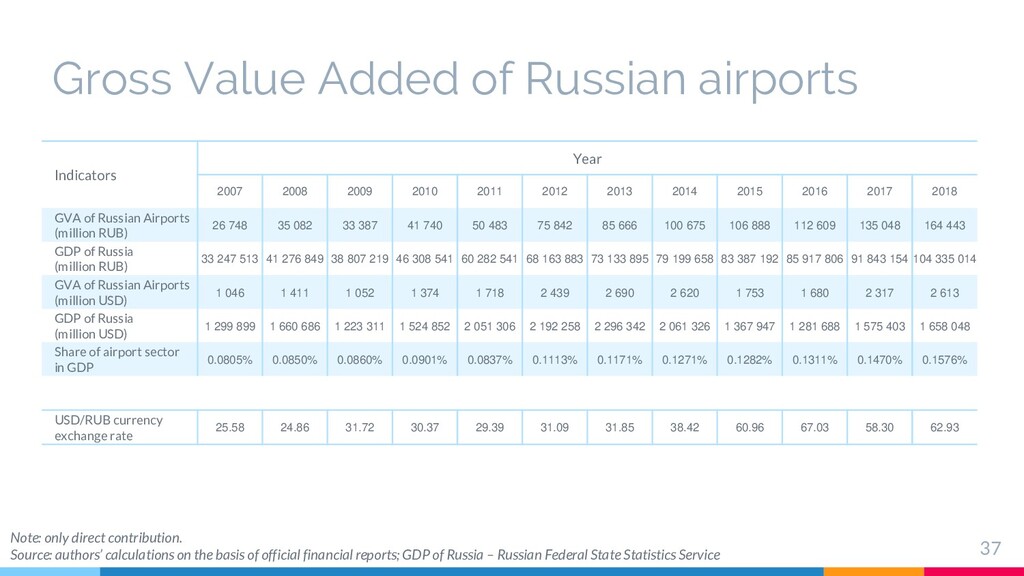
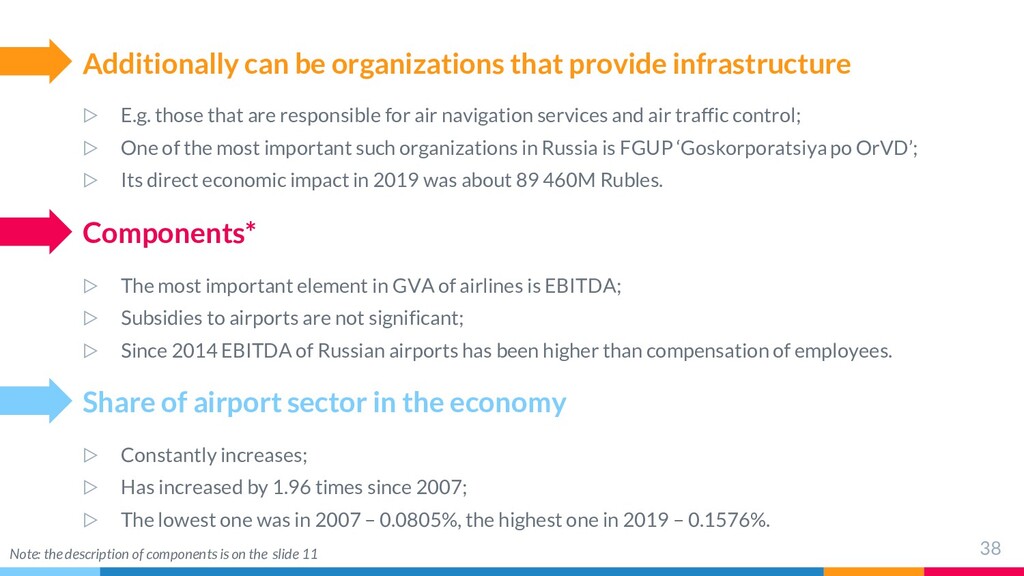
2007; ▷ The lowest one was in 2007 – 0.0805%, the highest one in 2019 – 0.1576%. Share of airport sector in the economy Additionally can be organizations that provide infrastructure ▷ E.g. those that are responsible for air navigation services and air traffic control; ▷ One of the most important such organizations in Russia is FGUP ‘Goskorporatsiya po OrVD’; ▷ Its direct economic impact in 2019 was about 89 460M Rubles. 38 Components* ▷ The most important element in GVA of airlines is EBITDA; ▷ Subsidies to airports are not significant; ▷ Since 2014 EBITDA of Russian airports has been higher than compensation of employees. Note: the description of components is on the slide 11
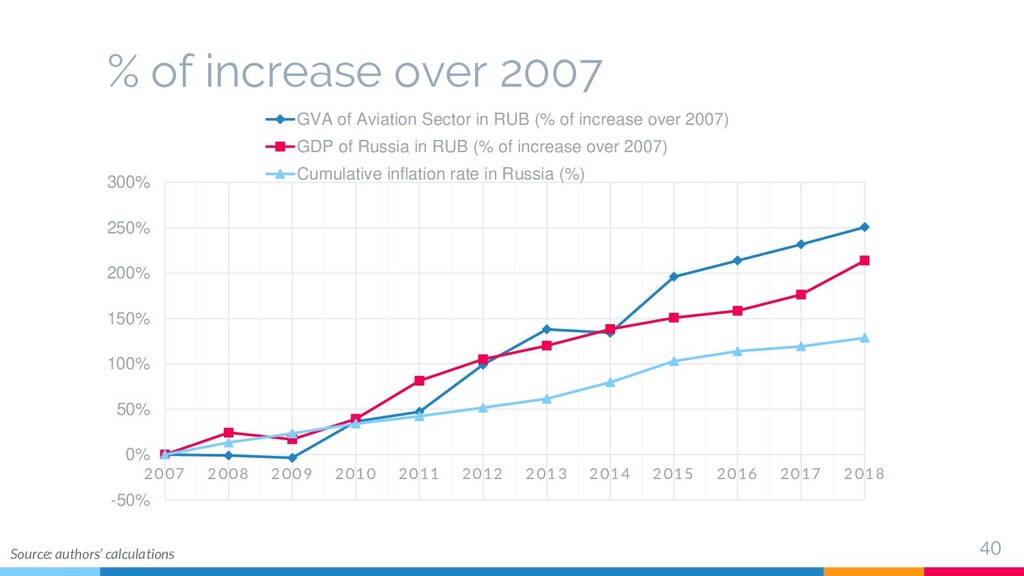
2009 2010 2011 2012 2013 2014 2015 2016 2017 2018 GVA of Aviation Sector in RUB (% of increase over 2007) GDP of Russia in RUB (% of increase over 2007) Cumulative inflation rate in Russia (%) 40 % of increase over 2007 Source: authors’ calculations
aviation sector and the GDP of Russia 41 The growth of the GVA of aviation sector has been more intensive since 2014 ▷ GVA of Aviation Sector has grown by 251%; ▷ The GDP of Russia has grown by 214%; ▷ Cumulative inflation is 129%.
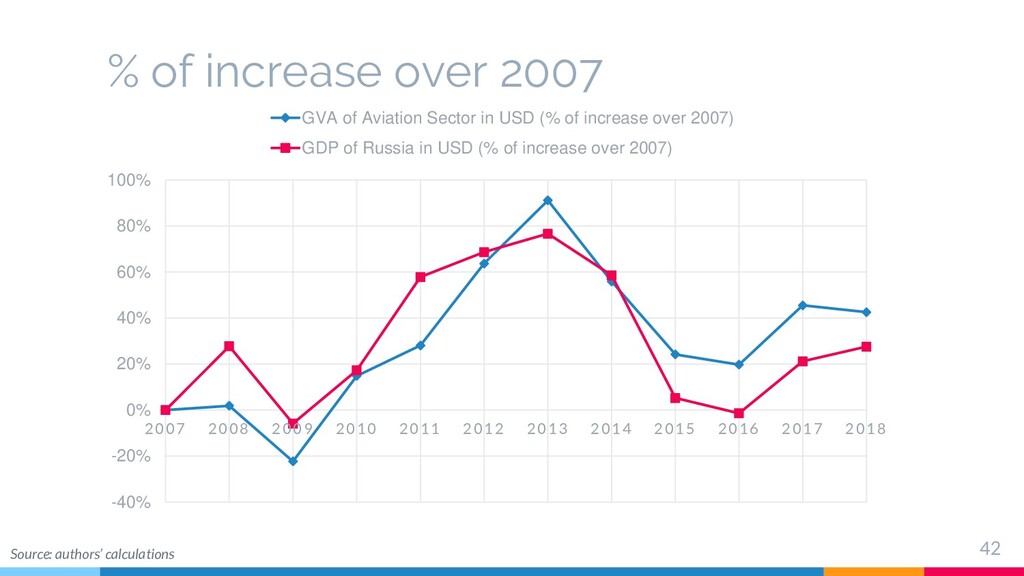
2009 2010 2011 2012 2013 2014 2015 2016 2017 2018 GVA of Aviation Sector in USD (% of increase over 2007) GDP of Russia in USD (% of increase over 2007) 42 % of increase over 2007 Source: authors’ calculations
in 2007 In USD, both the GVA of aviation sector and the GDP of Russia fluctuate 43 Both indicators reached its peak in 2013, then there was a substantial fall
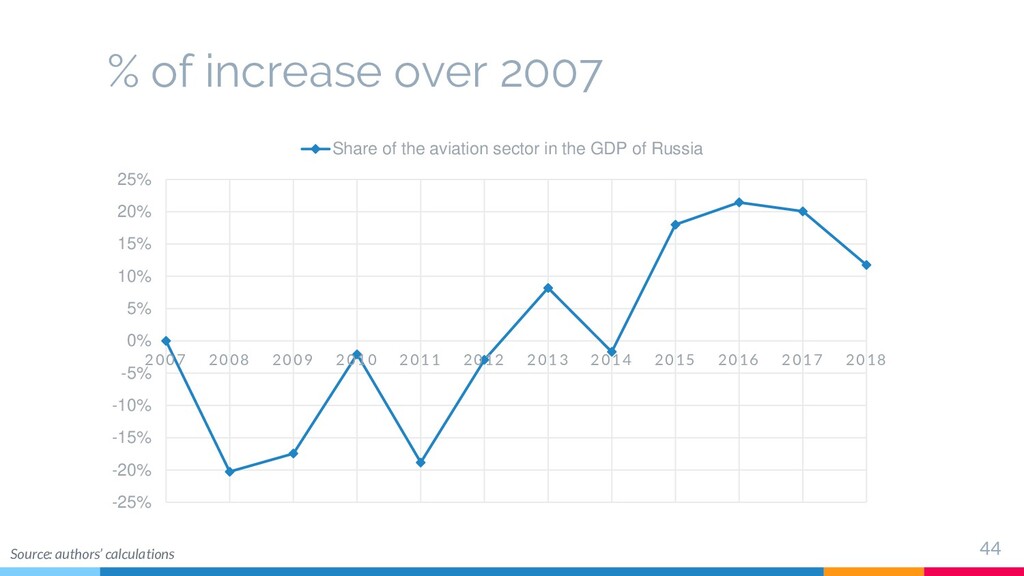
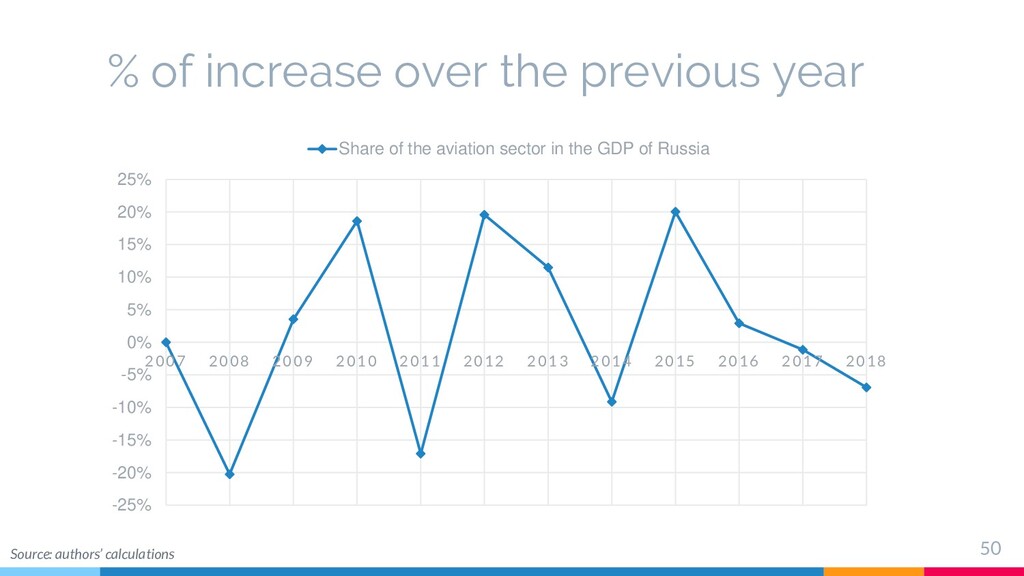
-5% 0% 5% 10% 15% 20% 25% 2007 2008 2009 2010 2011 2012 2013 2014 2015 2016 2017 2018 Share of the aviation sector in the GDP of Russia Source: authors’ calculations
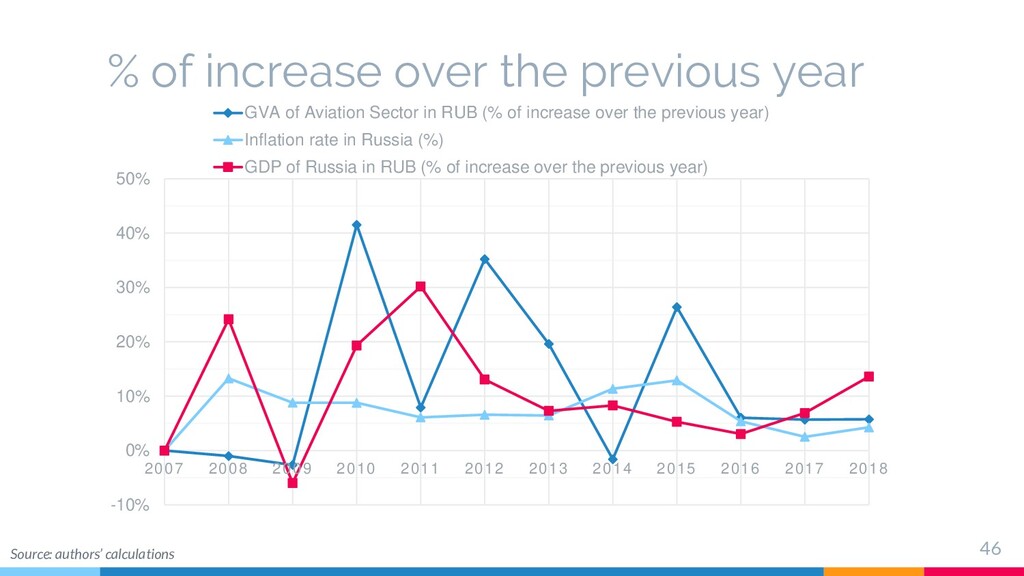
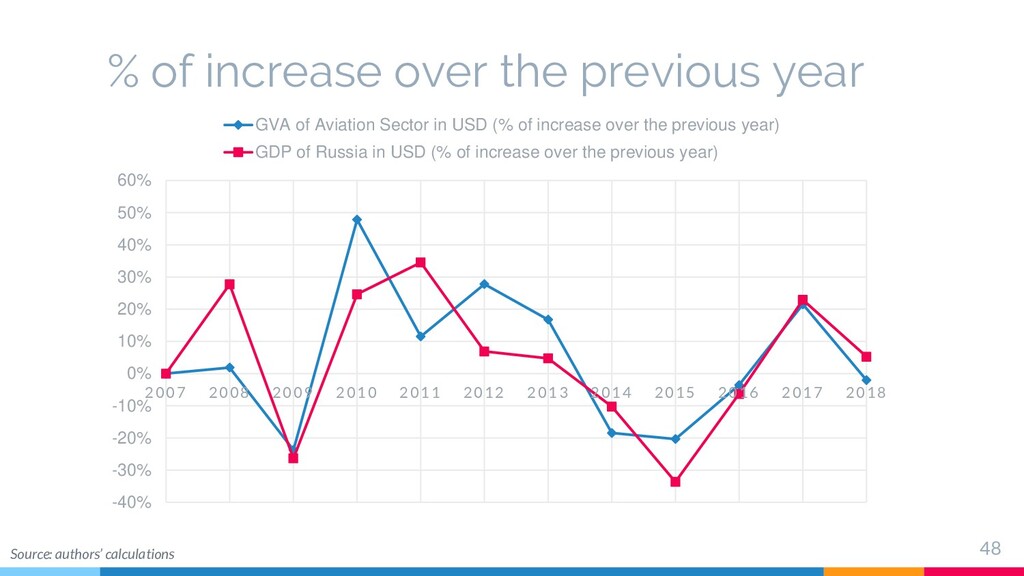
2010 2011 2012 2013 2014 2015 2016 2017 2018 GVA of Aviation Sector in RUB (% of increase over the previous year) Inflation rate in Russia (%) GDP of Russia in RUB (% of increase over the previous year) 46 % of increase over the previous year Source: authors’ calculations
(42%), 2012 (35%), 2015 (26%) The GVA of the aviation sector (RUB) fluctuates more than the GDP of Russia 47 The GVA of the aviation sector (RUB) increased every year, except 2009, 2014
-20% -10% 0% 10% 20% 30% 40% 50% 60% 2007 2008 2009 2010 2011 2012 2013 2014 2015 2016 2017 2018 GVA of Aviation Sector in USD (% of increase over the previous year) GDP of Russia in USD (% of increase over the previous year) Source: authors’ calculations
-15% -10% -5% 0% 5% 10% 15% 20% 25% 2007 2008 2009 2010 2011 2012 2013 2014 2015 2016 2017 2018 Share of the aviation sector in the GDP of Russia Source: authors’ calculations
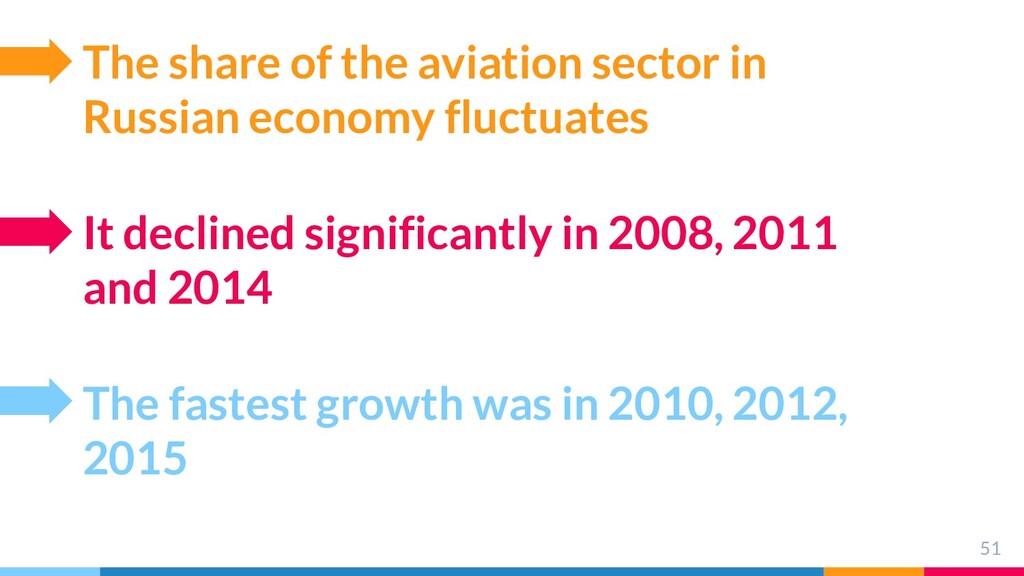
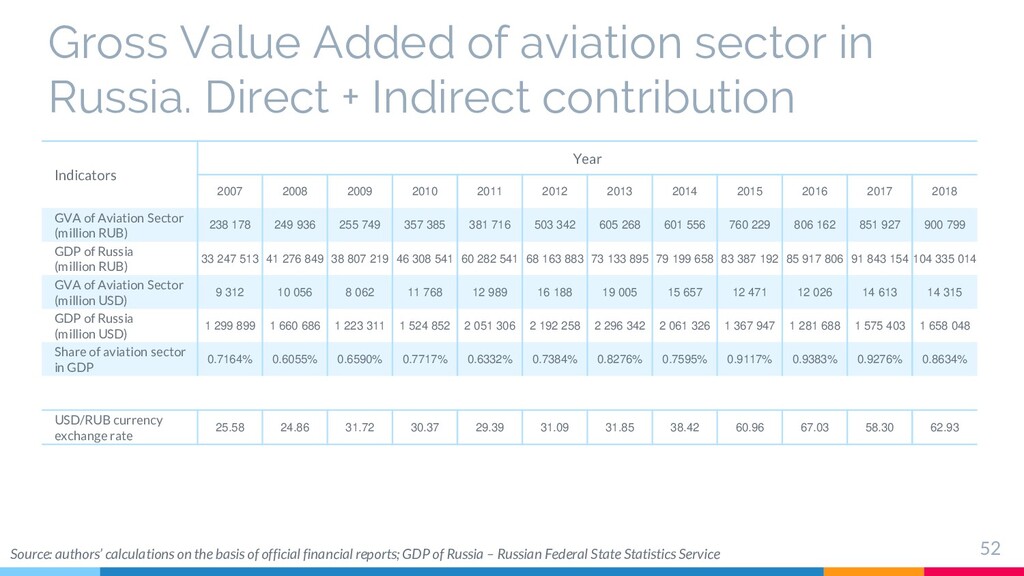
2007; ▷ The lowest one was in 2007 – 0.0805%, the highest one in 2019 – 0.1576%. Share of airport sector in the economy GVA of aviation sector in Russia ▷ Has increased by 54% since 2007; ▷ Reached its peak in 2013 (+104% since 2007); ▷ In 2019, it is approximately equal to the GDP of Mauritius, Burkina Faso or Brunei . 53 The share of aviation sector in the GDP of Russia ▷ Has increased by 0.147 percentage points since 2007; ▷ Reached its peak in 2016 (0.9383%); ▷ Is a bit higher than “Hotel and restaurant sector” or 1/3 of “Education sector” . Note: the description of components is on the slide 11
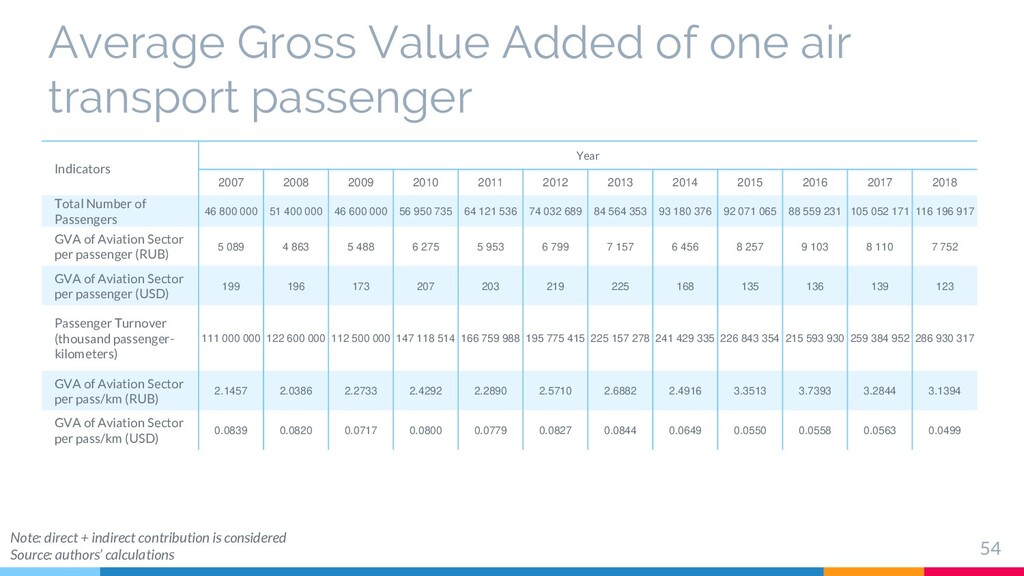
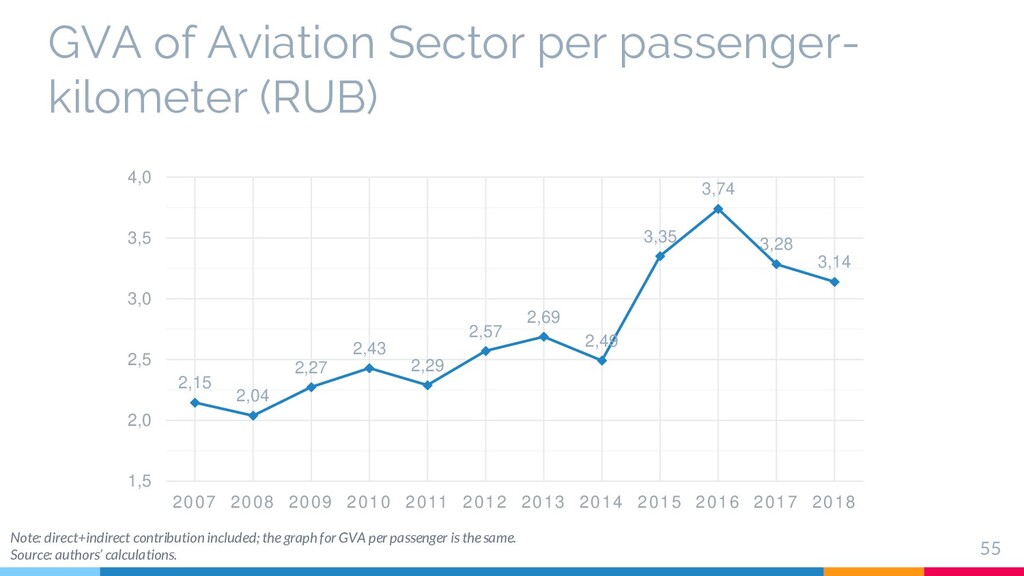
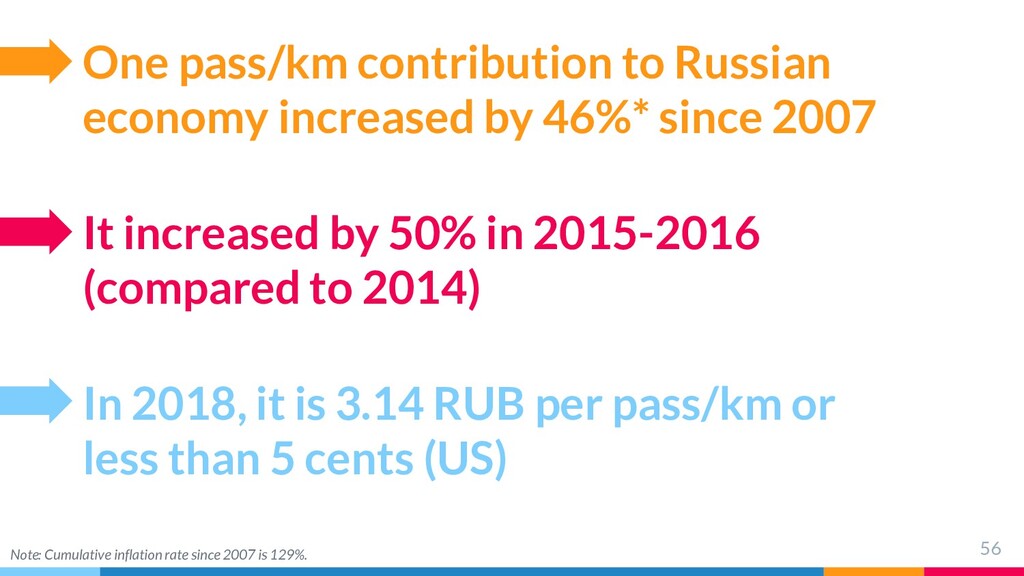
than 5 cents (US) One pass/km contribution to Russian economy increased by 46%* since 2007 56 It increased by 50% in 2015-2016 (compared to 2014) Note: Cumulative inflation rate since 2007 is 129%.
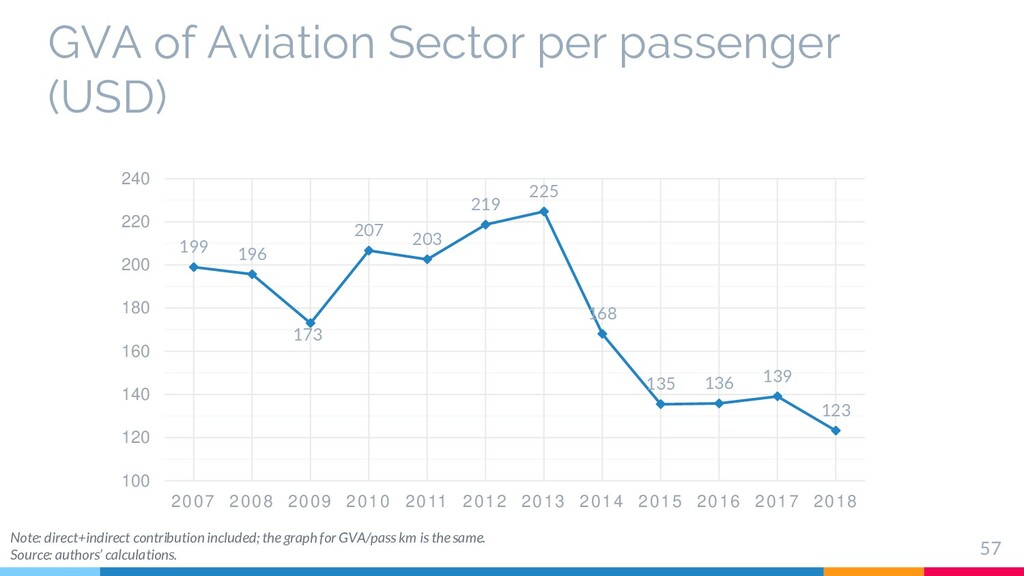
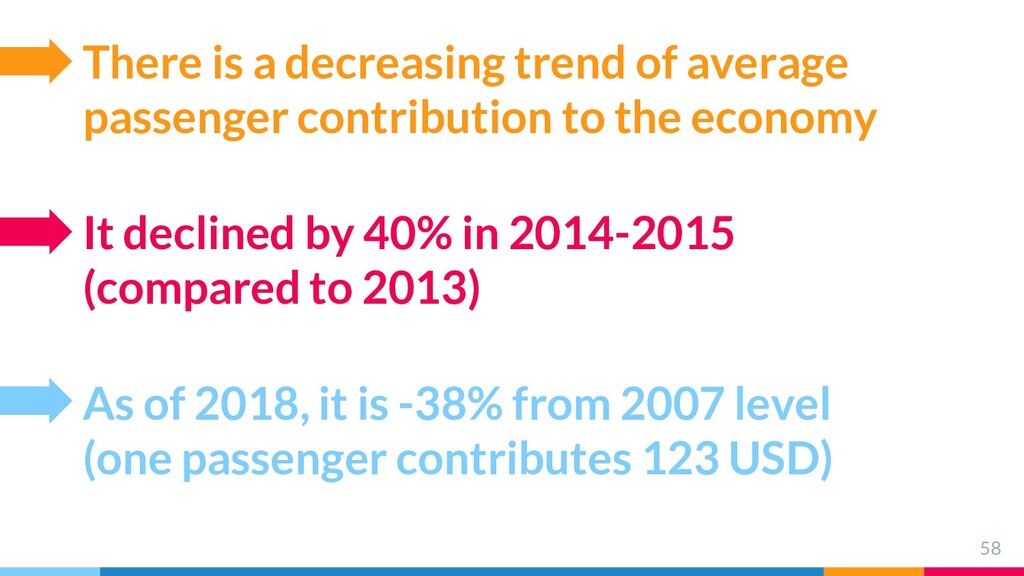
passenger contributes 123 USD) There is a decreasing trend of average passenger contribution to the economy 58 It declined by 40% in 2014-2015 (compared to 2013)
reference to source is obligatory if you use materials of these slides: Chsherbakov, V. S., & Gerasimov, O. A. (2019). Air Transport in Russia and Its Impact on the Economy. Tomsk State University Journal of Economics, (48), 283–304. doi: 10.17223/19988648/48/20 Any questions? Please, write to [email protected] LinkedIn: linkedin.com/in/geroleum