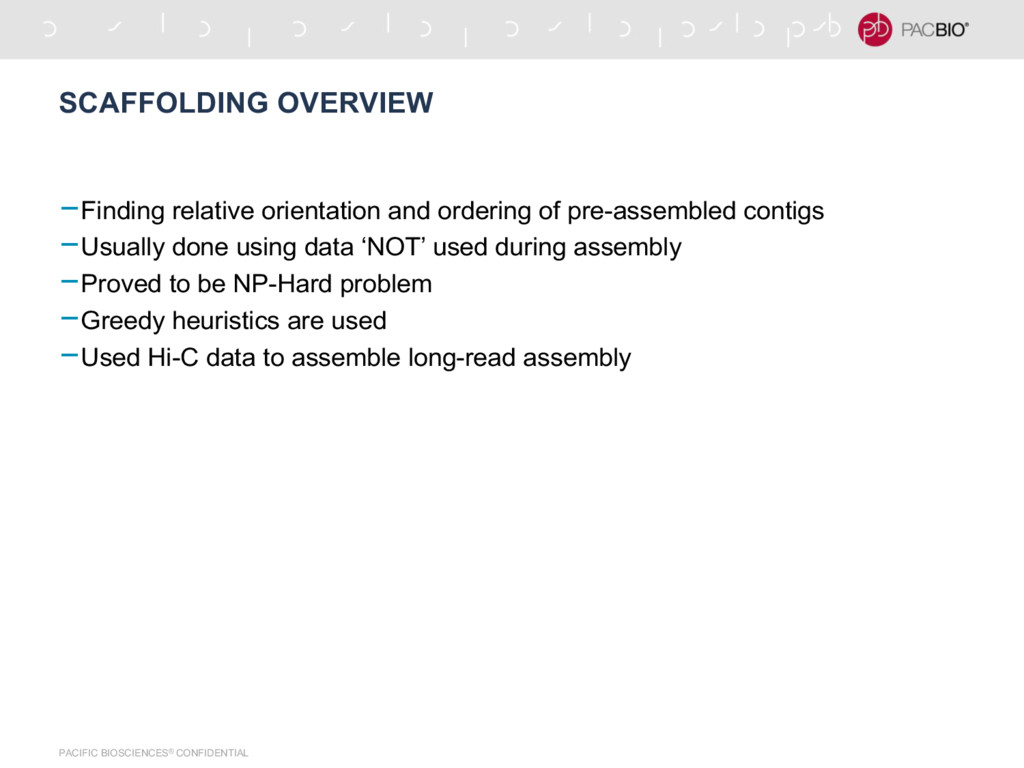
of pre-assembled contigs -Usually done using data ‘NOT’ used during assembly -Proved to be NP-Hard problem -Greedy heuristics are used -Used Hi-C data to assemble long-read assembly
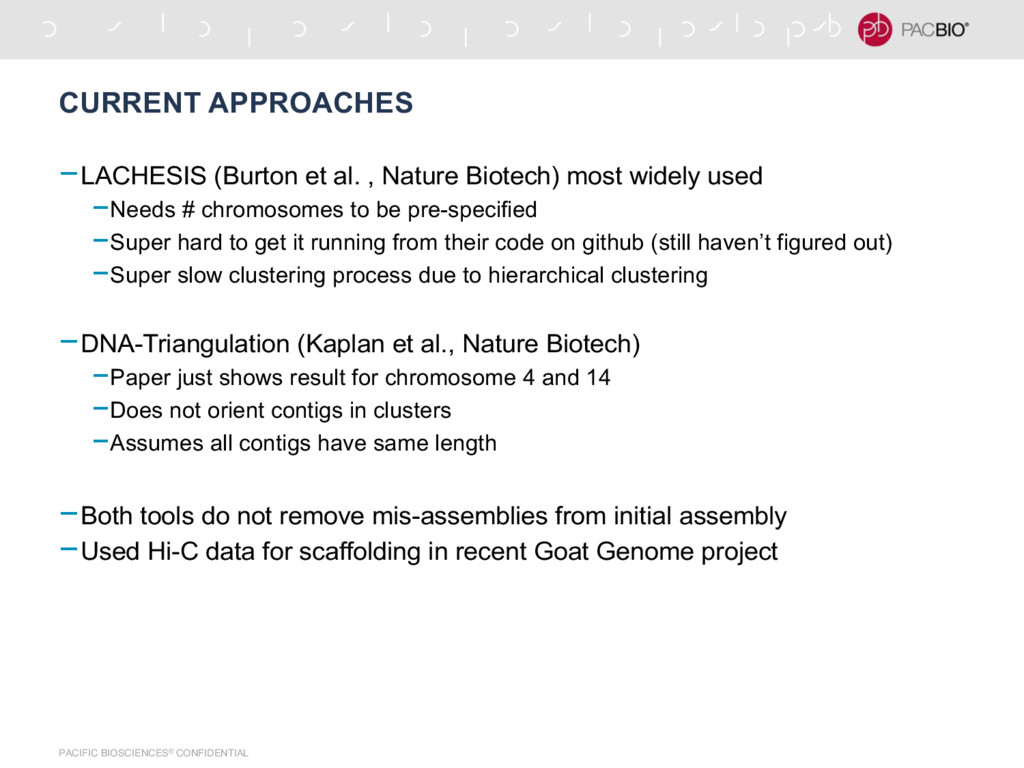
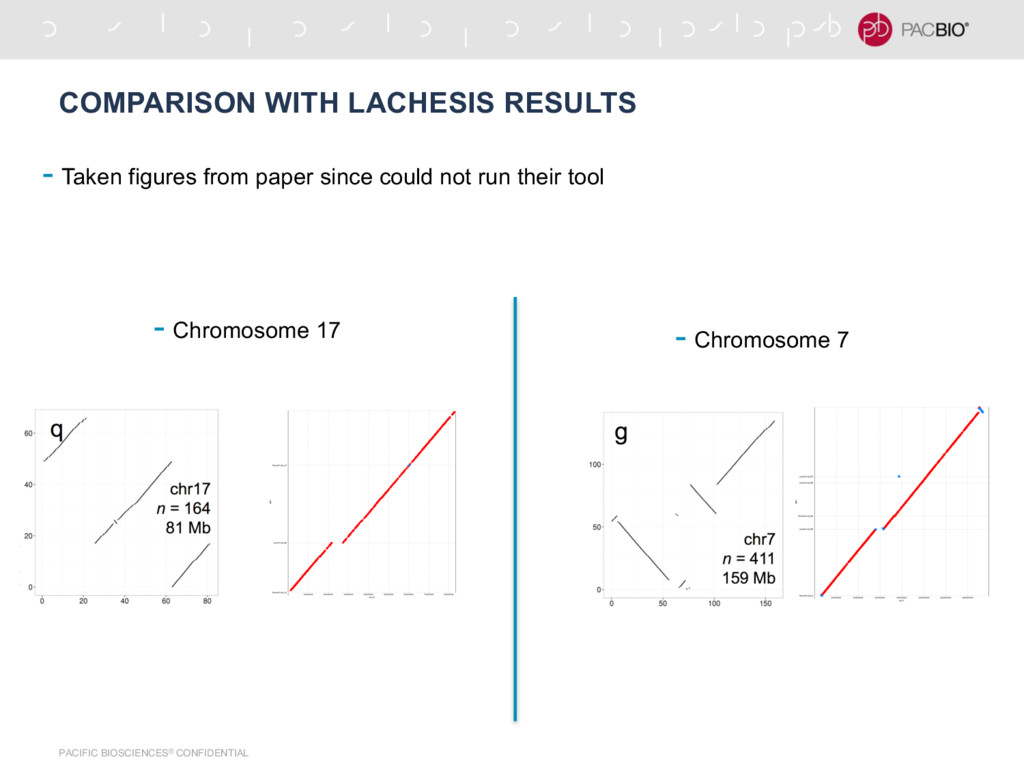
Nature Biotech) most widely used -Needs # chromosomes to be pre-specified -Super hard to get it running from their code on github (still haven’t figured out) -Super slow clustering process due to hierarchical clustering -DNA-Triangulation (Kaplan et al., Nature Biotech) -Paper just shows result for chromosome 4 and 14 -Does not orient contigs in clusters -Assumes all contigs have same length -Both tools do not remove mis-assemblies from initial assembly -Used Hi-C data for scaffolding in recent Goat Genome project
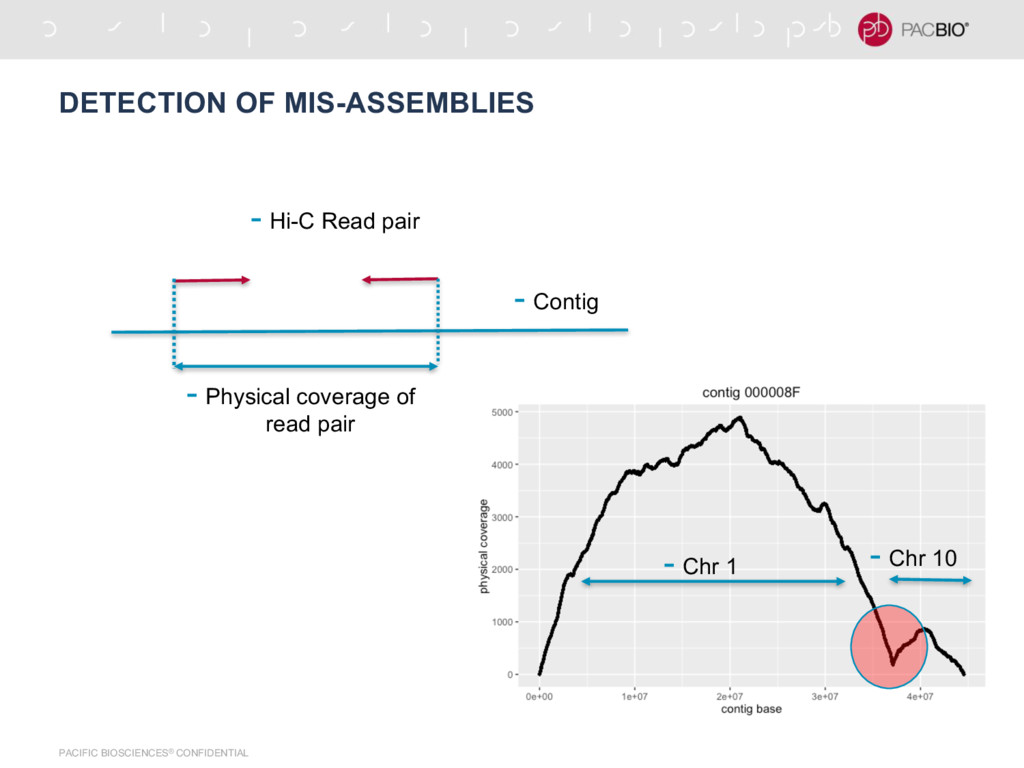
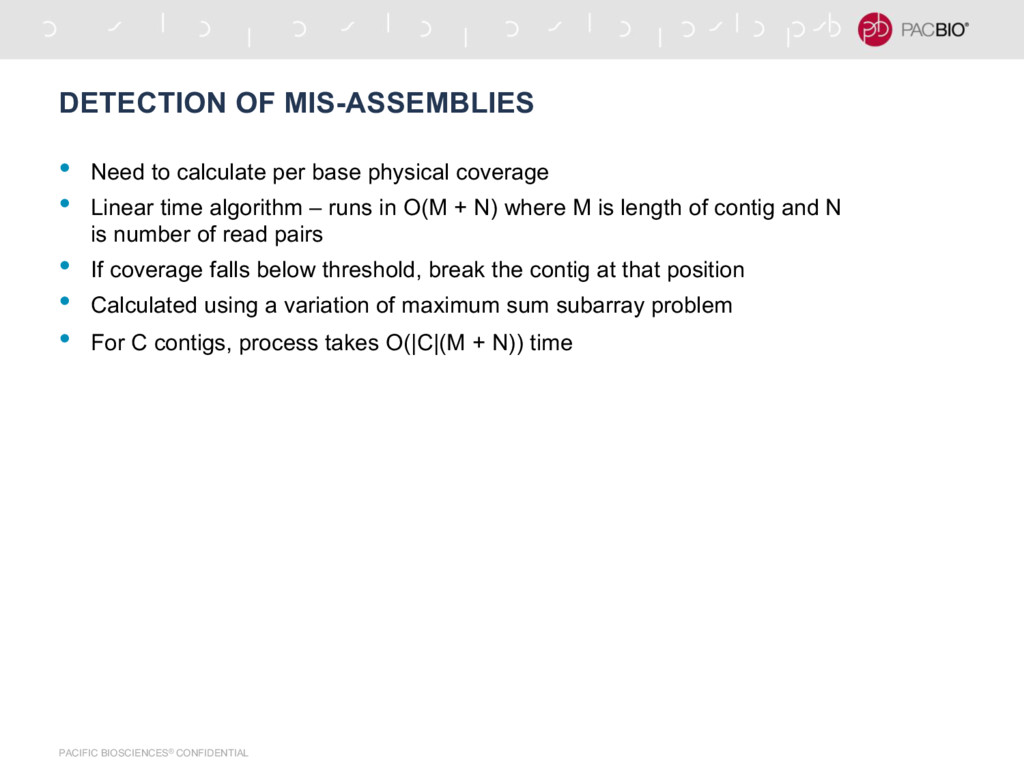
per base physical coverage • Linear time algorithm – runs in O(M + N) where M is length of contig and N is number of read pairs • If coverage falls below threshold, break the contig at that position • Calculated using a variation of maximum sum subarray problem • For C contigs, process takes O(|C|(M + N)) time
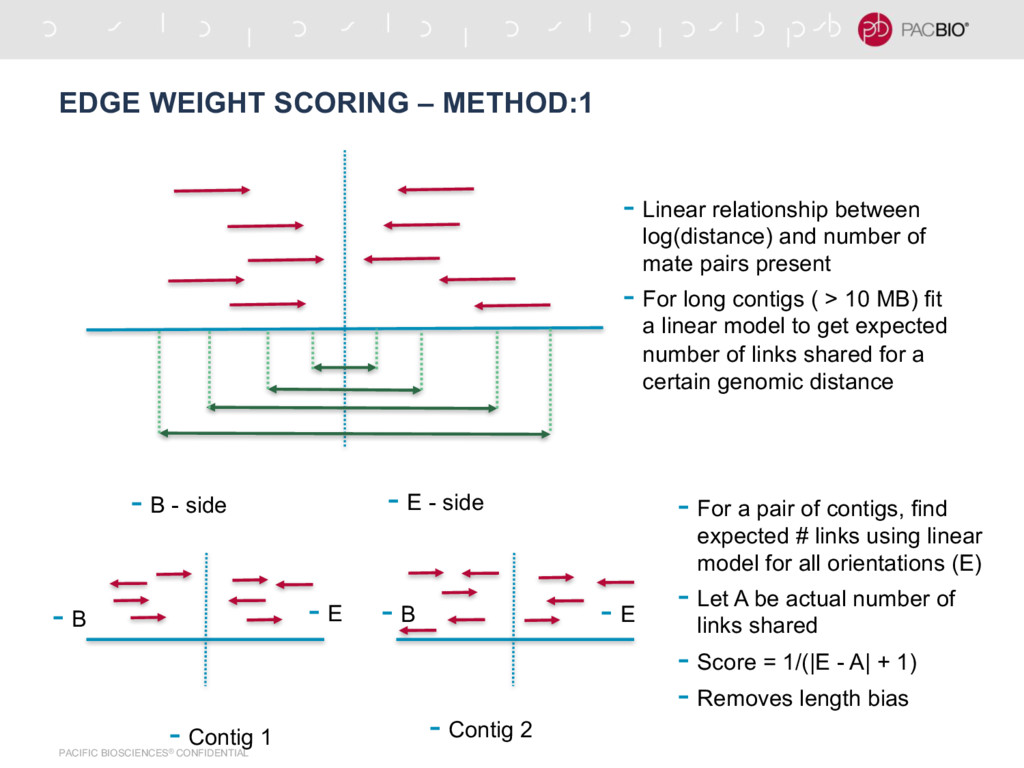
- side - B - side - Linear relationship between log(distance) and number of mate pairs present - For long contigs ( > 10 MB) fit a linear model to get expected number of links shared for a certain genomic distance - Contig 2 - E - Contig 1 - B - B - E - For a pair of contigs, find expected # links using linear model for all orientations (E) - Let A be actual number of links shared - Score = 1/(|E - A| + 1) - Removes length bias
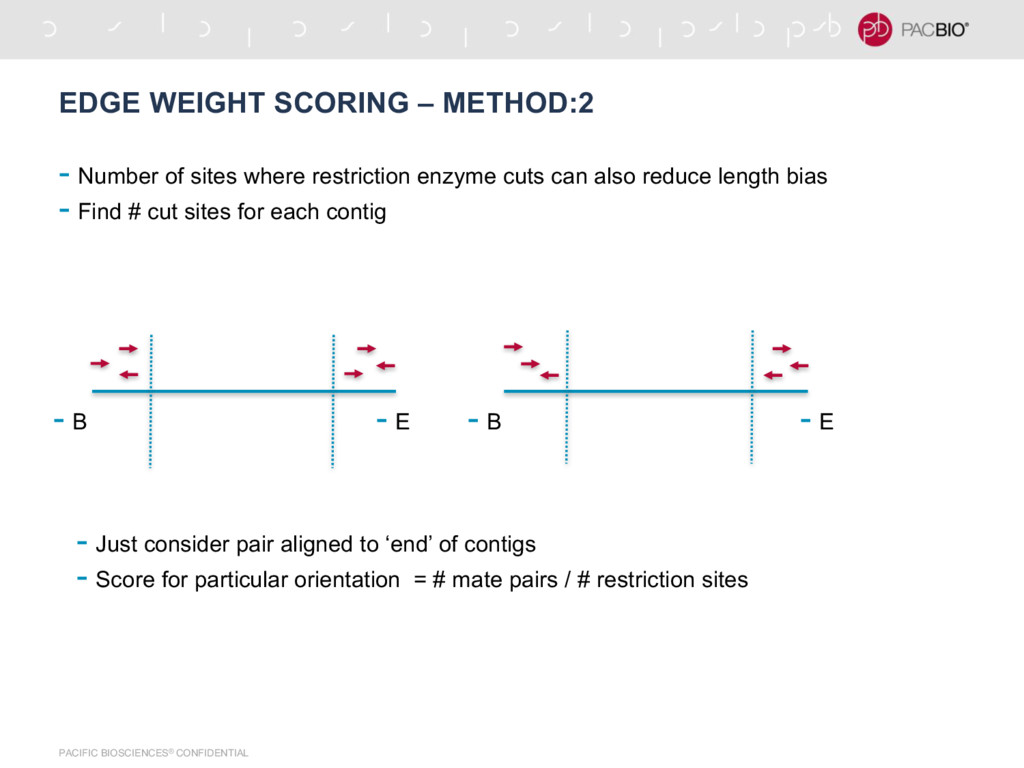
of sites where restriction enzyme cuts can also reduce length bias - Find # cut sites for each contig - B - B - E - E - Just consider pair aligned to ‘end’ of contigs - Score for particular orientation = # mate pairs / # restriction sites
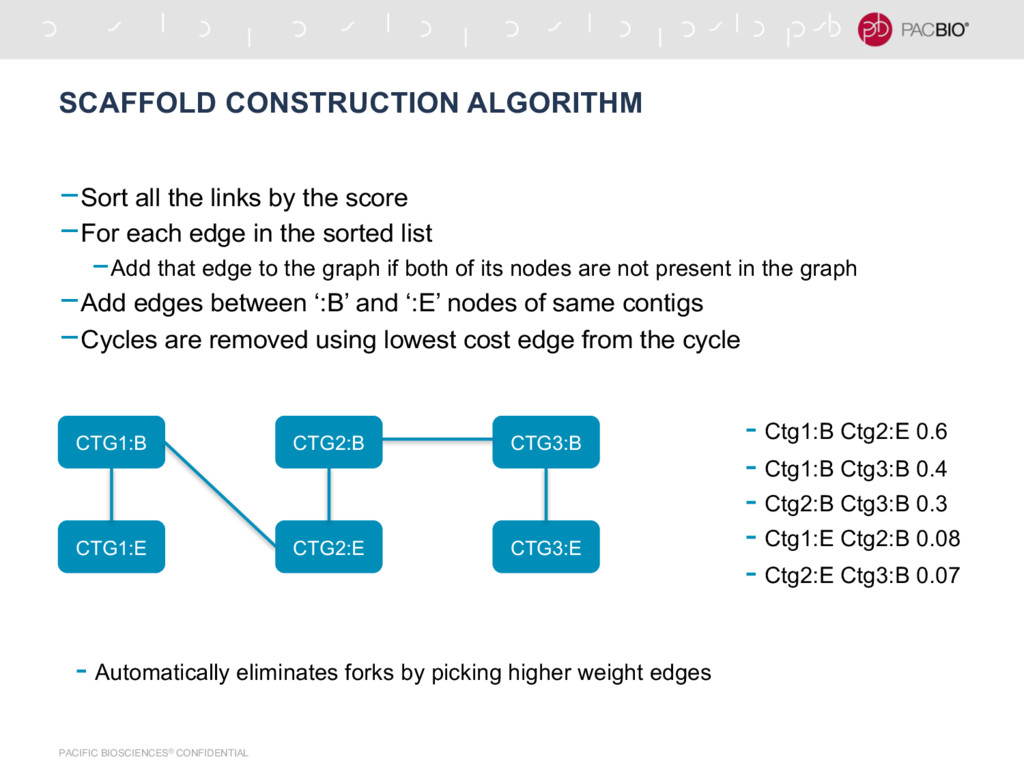
by the score -For each edge in the sorted list -Add that edge to the graph if both of its nodes are not present in the graph -Add edges between ‘:B’ and ‘:E’ nodes of same contigs -Cycles are removed using lowest cost edge from the cycle CTG1:B CTG1:E CTG2:B CTG2:E CTG3:B CTG3:E - Automatically eliminates forks by picking higher weight edges - Ctg1:B Ctg2:E 0.6 - Ctg1:B Ctg3:B 0.4 - Ctg2:B Ctg3:B 0.3 - Ctg1:E Ctg2:B 0.08 - Ctg2:E Ctg3:B 0.07
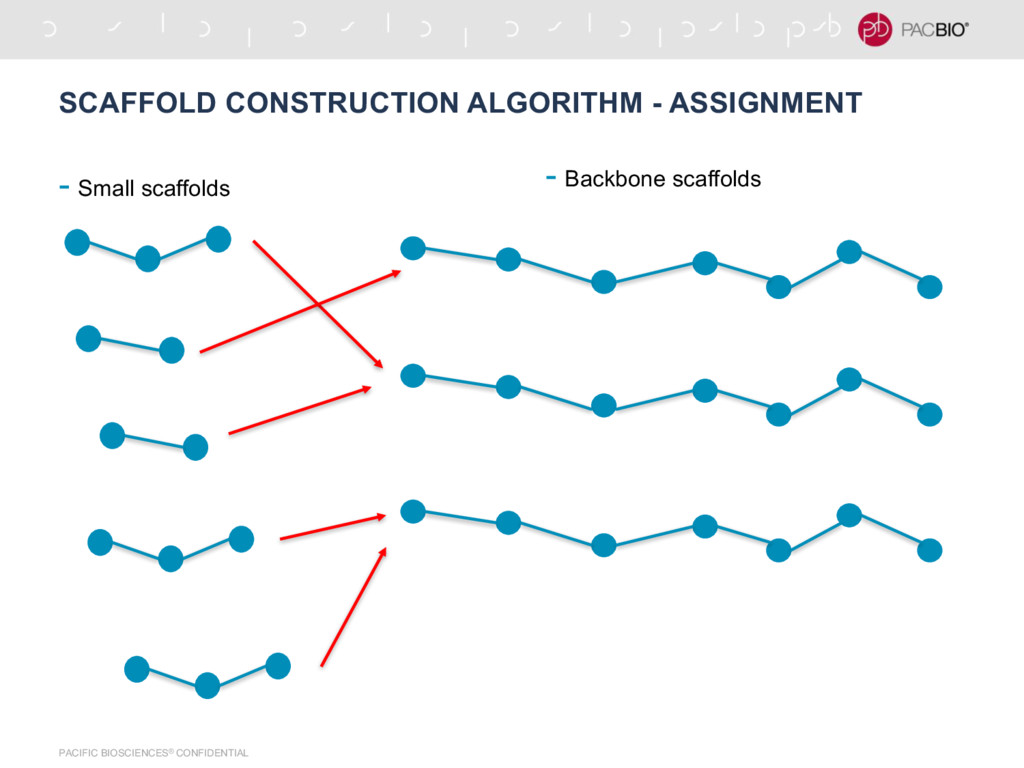
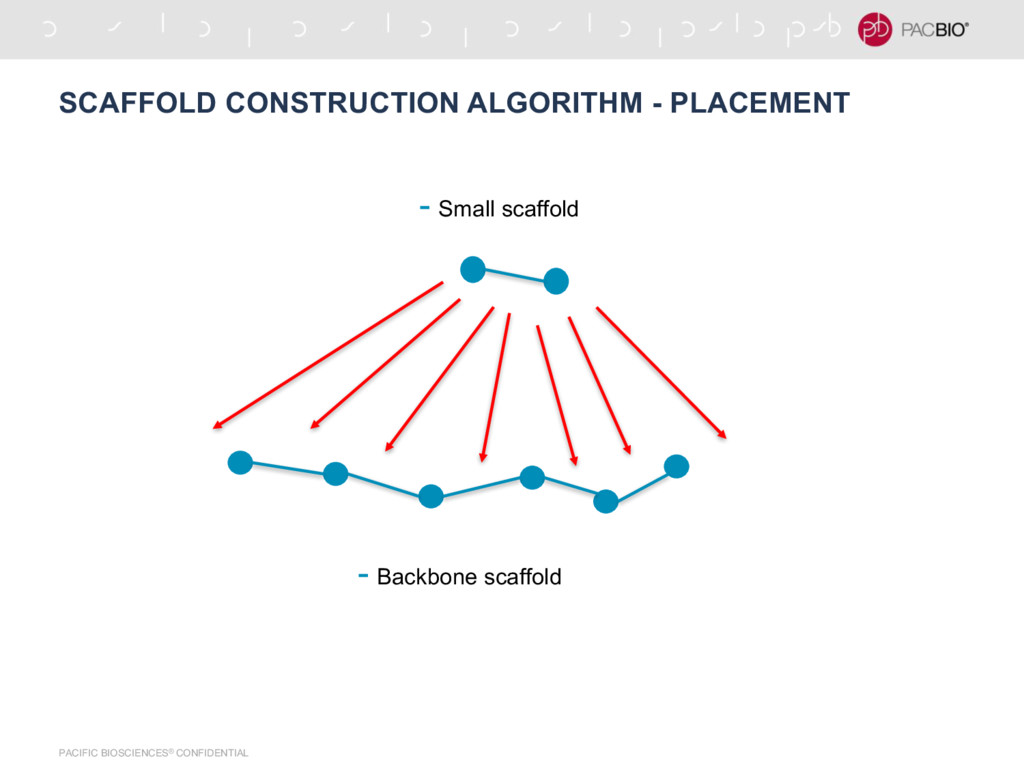
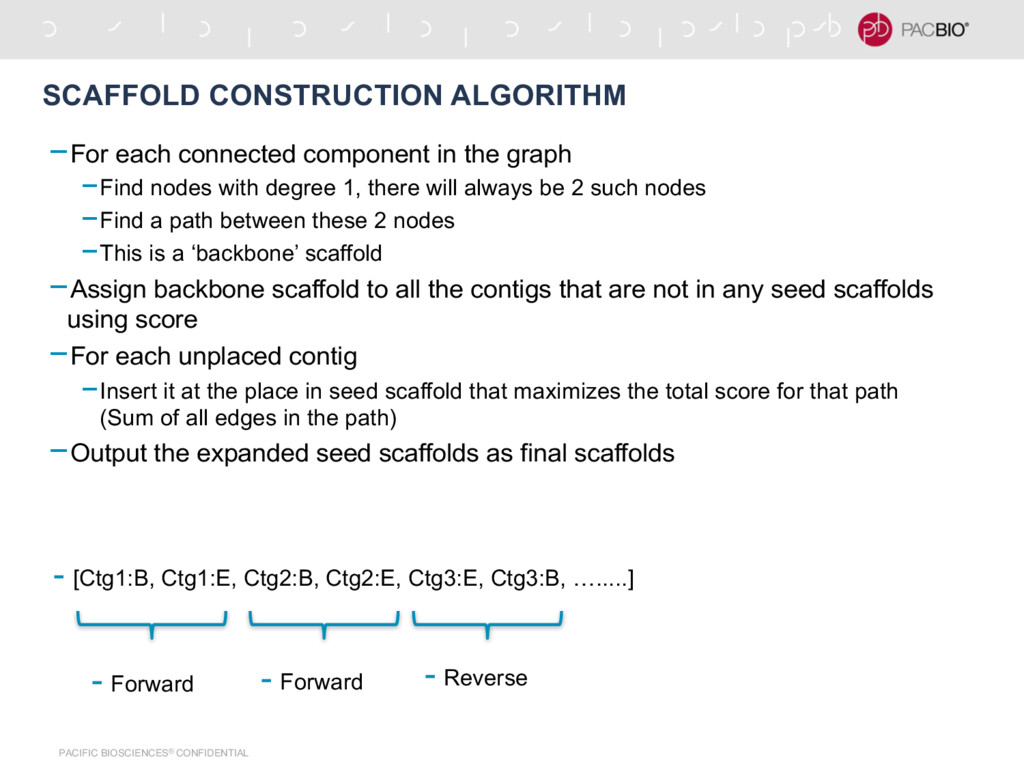
in the graph -Find nodes with degree 1, there will always be 2 such nodes -Find a path between these 2 nodes -This is a ‘backbone’ scaffold -Assign backbone scaffold to all the contigs that are not in any seed scaffolds using score -For each unplaced contig -Insert it at the place in seed scaffold that maximizes the total score for that path (Sum of all edges in the path) -Output the expanded seed scaffolds as final scaffolds - [Ctg1:B, Ctg1:E, Ctg2:B, Ctg2:E, Ctg3:E, Ctg3:B, ….....] - Forward - Forward - Reverse
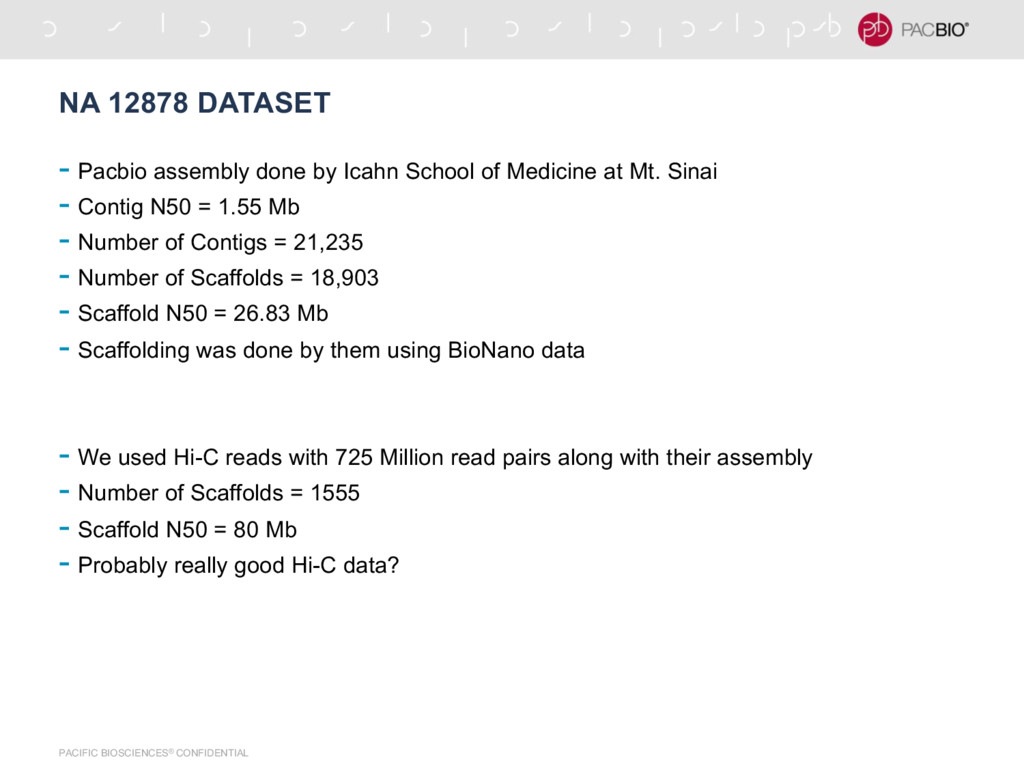
by Icahn School of Medicine at Mt. Sinai - Contig N50 = 1.55 Mb - Number of Contigs = 21,235 - Number of Scaffolds = 18,903 - Scaffold N50 = 26.83 Mb - Scaffolding was done by them using BioNano data - We used Hi-C reads with 725 Million read pairs along with their assembly - Number of Scaffolds = 1555 - Scaffold N50 = 80 Mb - Probably really good Hi-C data?
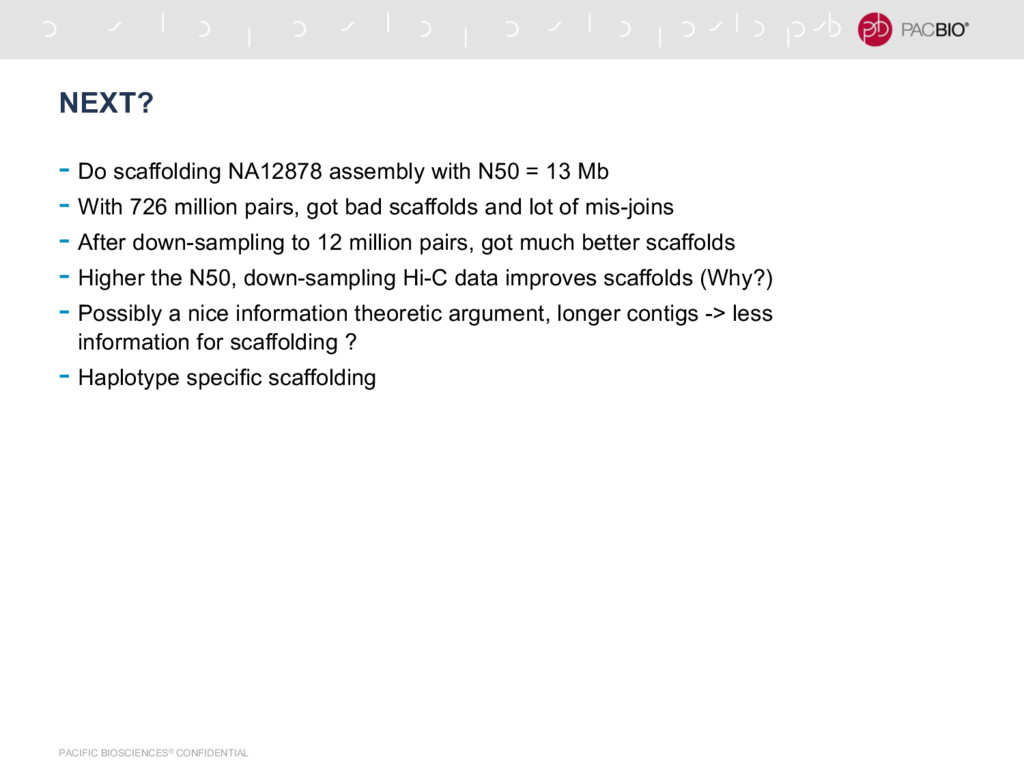
N50 = 13 Mb - With 726 million pairs, got bad scaffolds and lot of mis-joins - After down-sampling to 12 million pairs, got much better scaffolds - Higher the N50, down-sampling Hi-C data improves scaffolds (Why?) - Possibly a nice information theoretic argument, longer contigs -> less information for scaffolding ? - Haplotype specific scaffolding
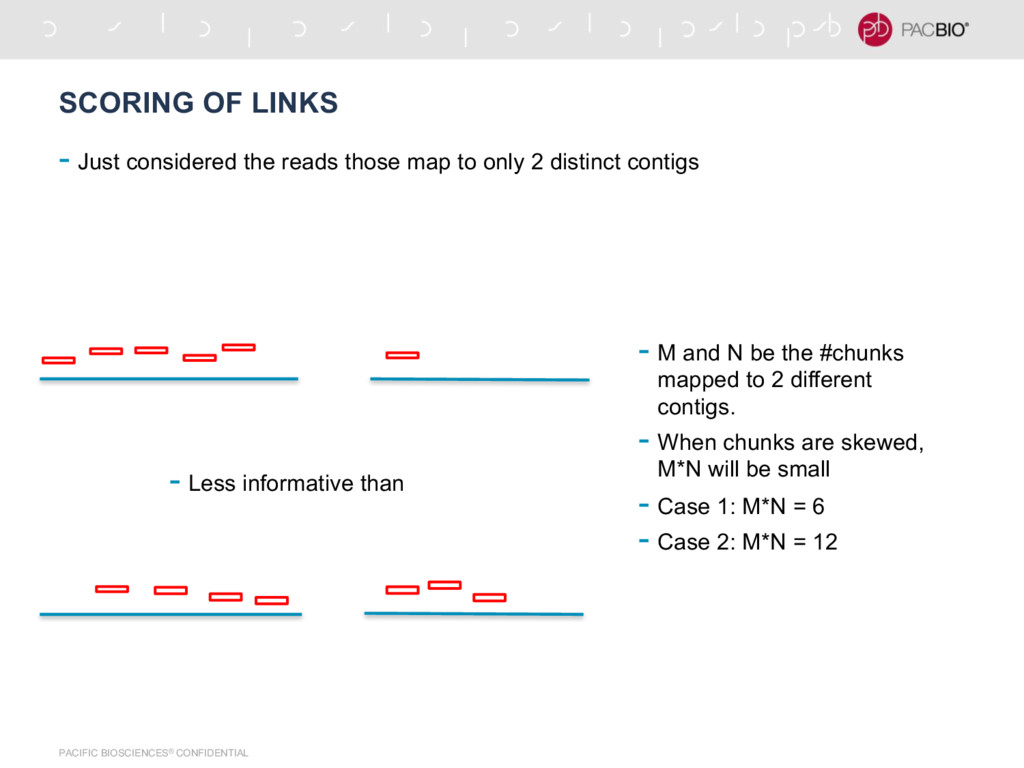
reads those map to only 2 distinct contigs - Less informative than - M and N be the #chunks mapped to 2 different contigs. - When chunks are skewed, M*N will be small - Case 1: M*N = 6 - Case 2: M*N = 12
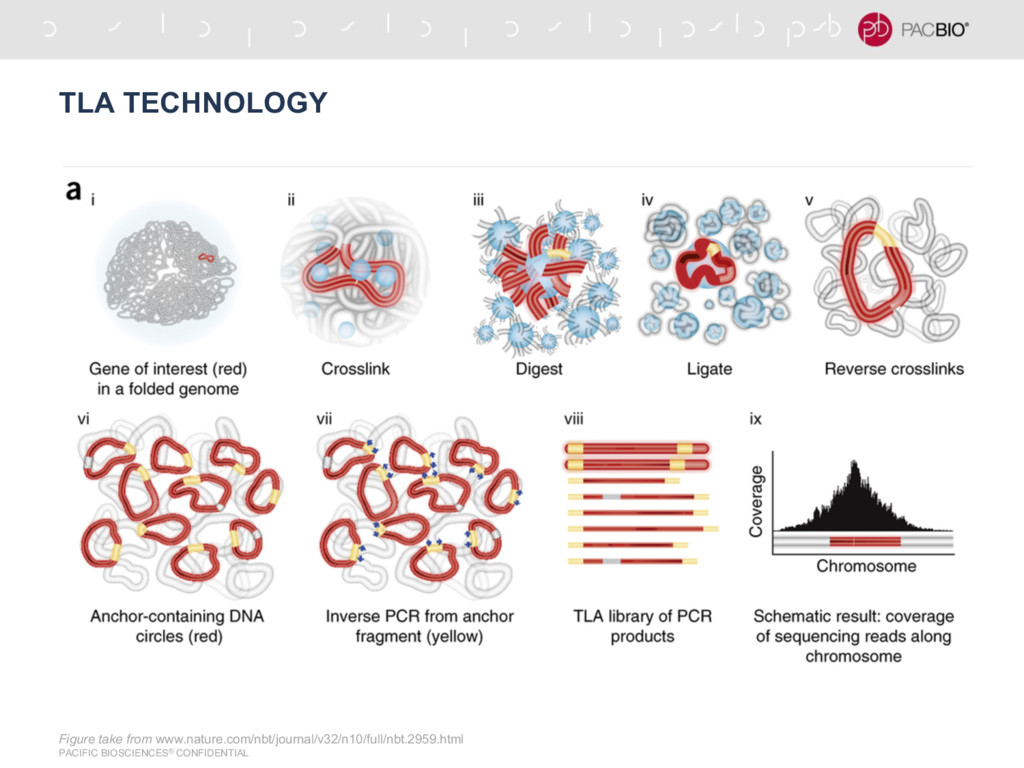
N50 = 4.5 Mb - Assembly done at Pacbio with N50 ~ 13 Mb - Cergentis data for generated at PacBio - Still in exploration, this type of data is not studied well yet