Flaky Tests Owain Parry¹, Gregory M. Kapfhammer², Michael Hilton³, Phil McMinn¹ ¹University of Sheffield, UK ²Allegheny College, USA ³Carnegie Mellon University, USA
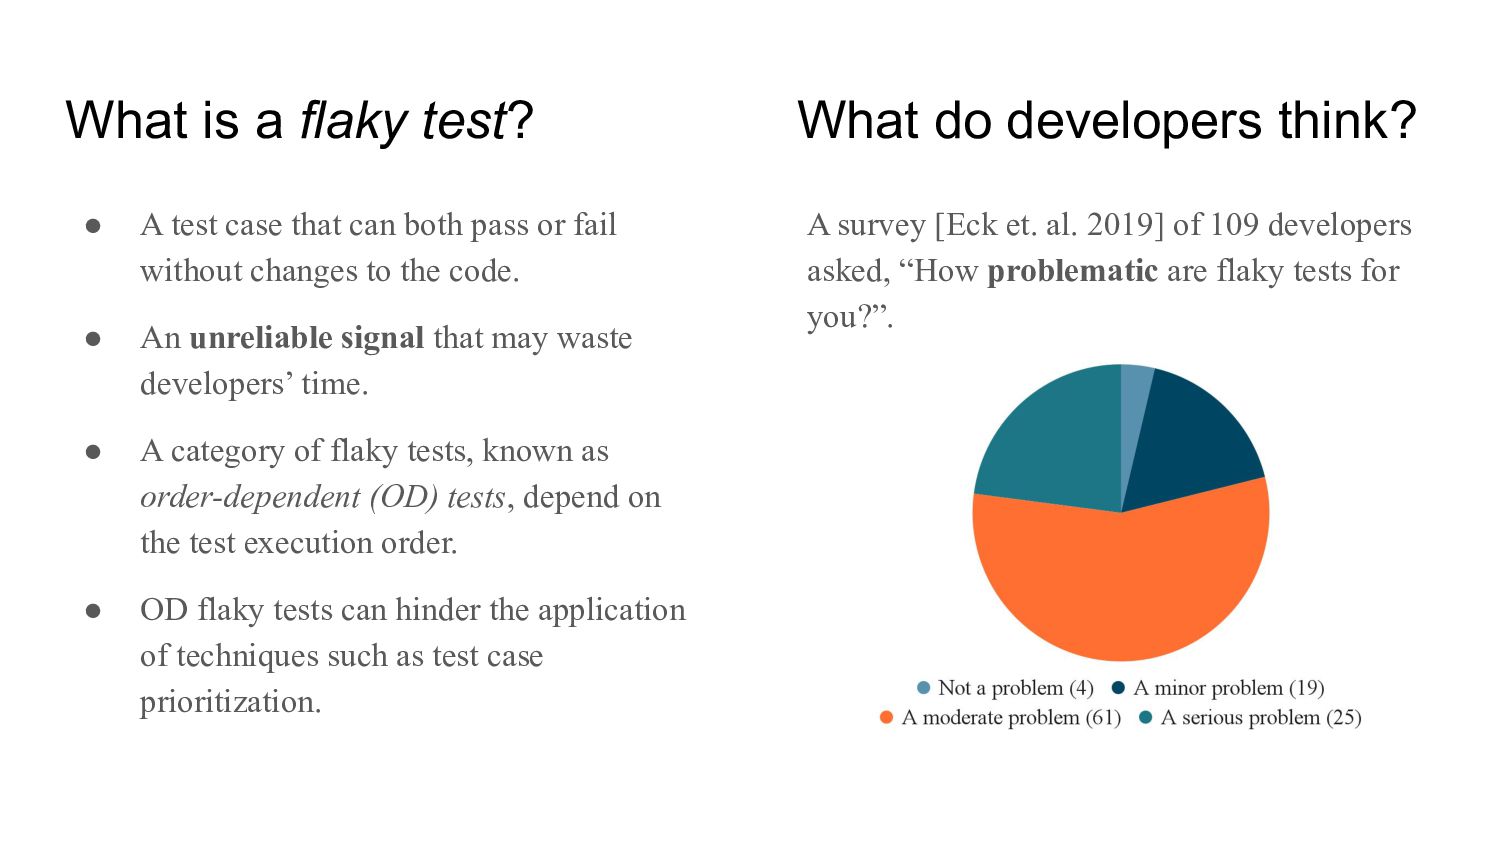
A test case that can both pass or fail without changes to the code. • An unreliable signal that may waste developers’ time. • A category of flaky tests, known as order-dependent (OD) tests, depend on the test execution order. • OD flaky tests can hinder the application of techniques such as test case prioritization. A survey [Eck et. al. 2019] of 109 developers asked, “How problematic are flaky tests for you?”.
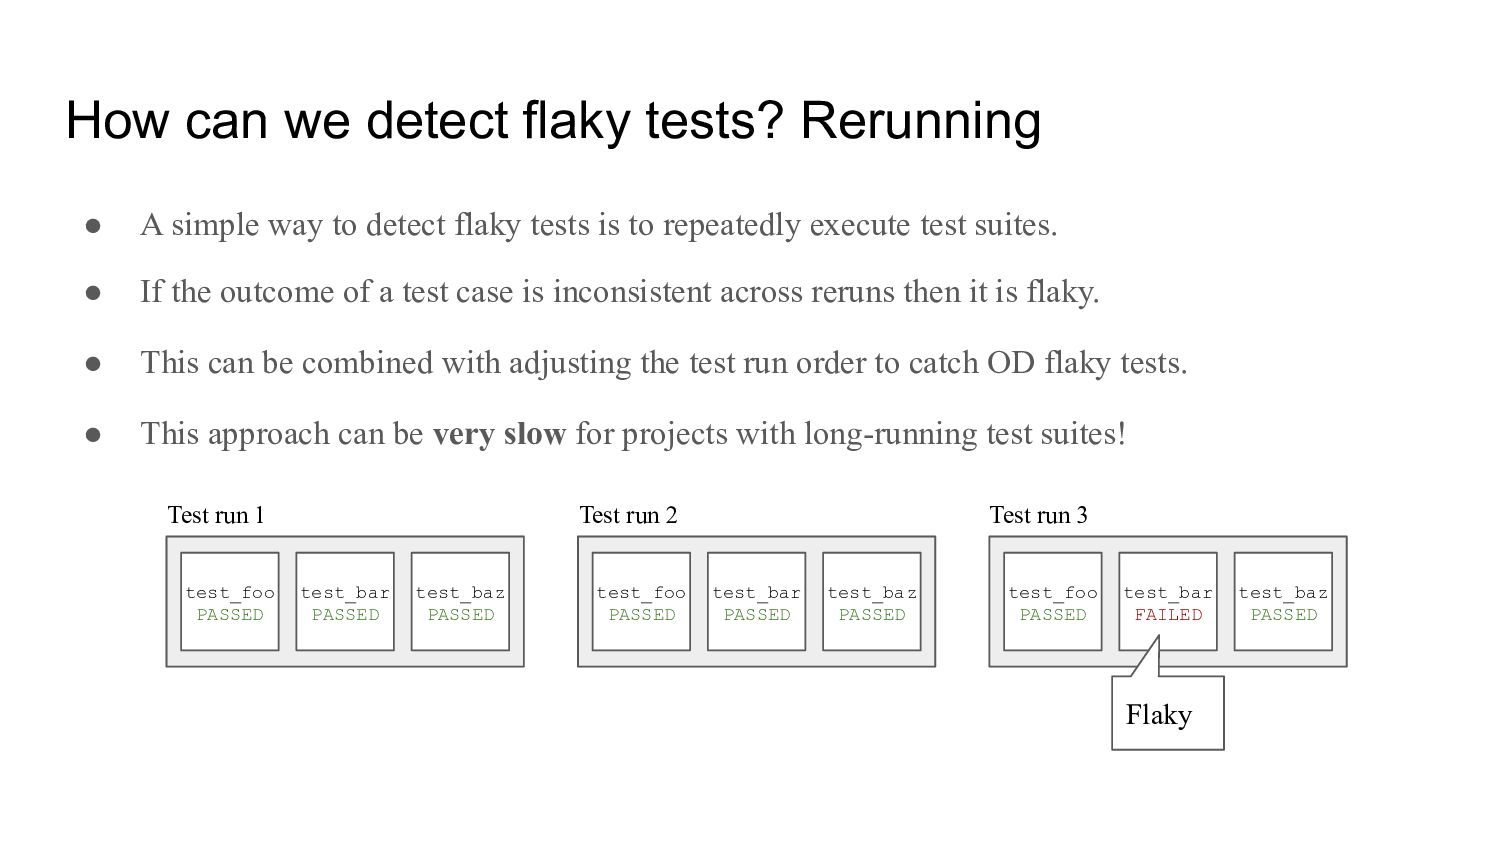
way to detect flaky tests is to repeatedly execute test suites. • If the outcome of a test case is inconsistent across reruns then it is flaky. • This can be combined with adjusting the test run order to catch OD flaky tests. • This approach can be very slow for projects with long-running test suites! test_foo PASSED test_bar PASSED test_baz PASSED test_foo PASSED test_bar PASSED test_baz PASSED test_foo PASSED test_bar FAILED test_baz PASSED Test run 1 Test run 2 Test run 3 Flaky
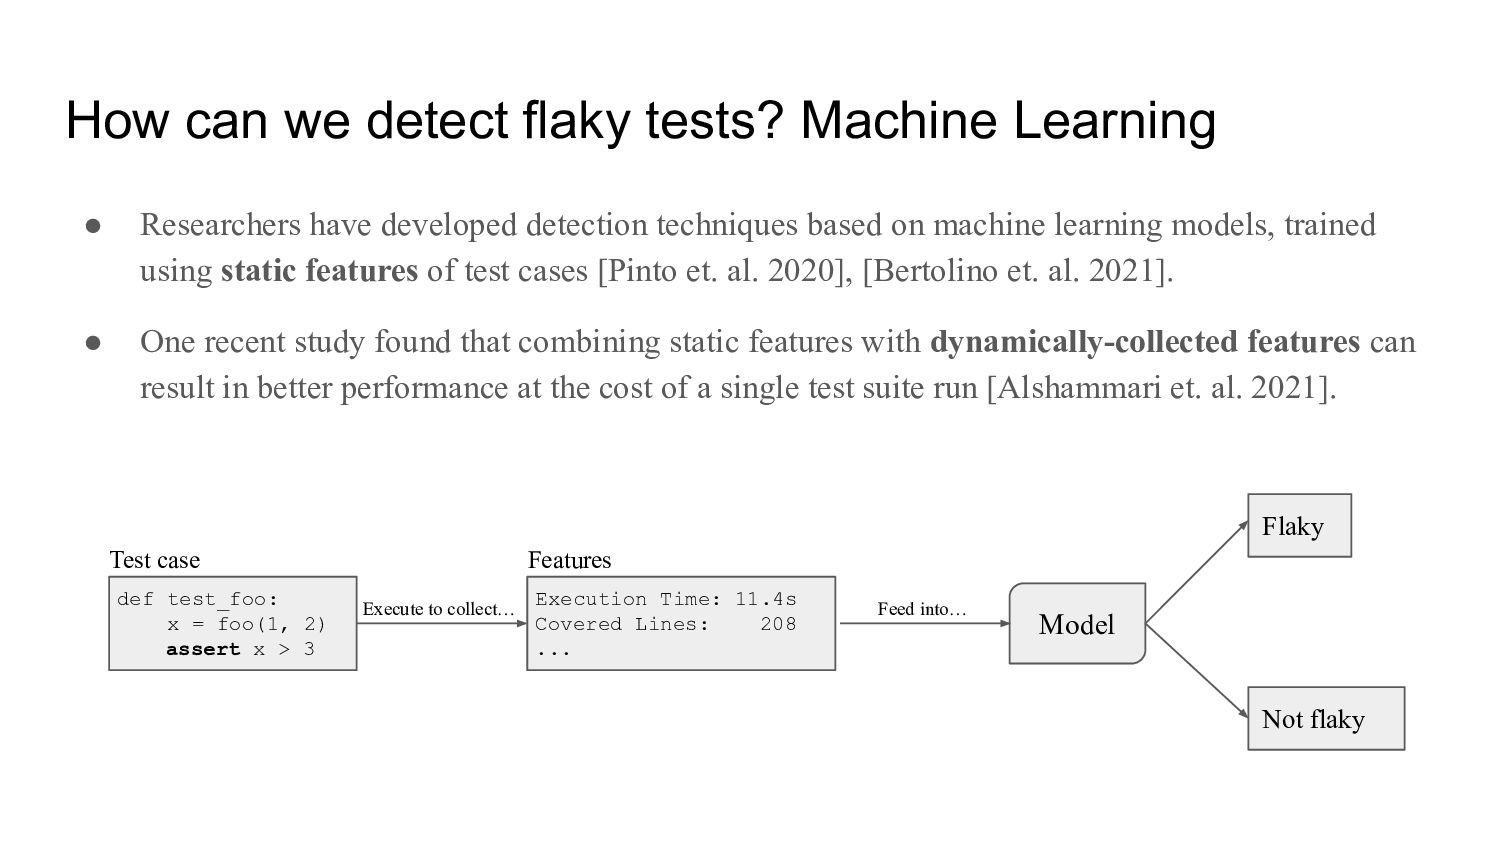
have developed detection techniques based on machine learning models, trained using static features of test cases [Pinto et. al. 2020], [Bertolino et. al. 2021]. • One recent study found that combining static features with dynamically-collected features can result in better performance at the cost of a single test suite run [Alshammari et. al. 2021]. def test_foo: x = foo(1, 2) assert x > 3 Test case Execution Time: 11.4s Covered Lines: 208 ... Features Model Execute to collect… Feed into… Flaky Not flaky
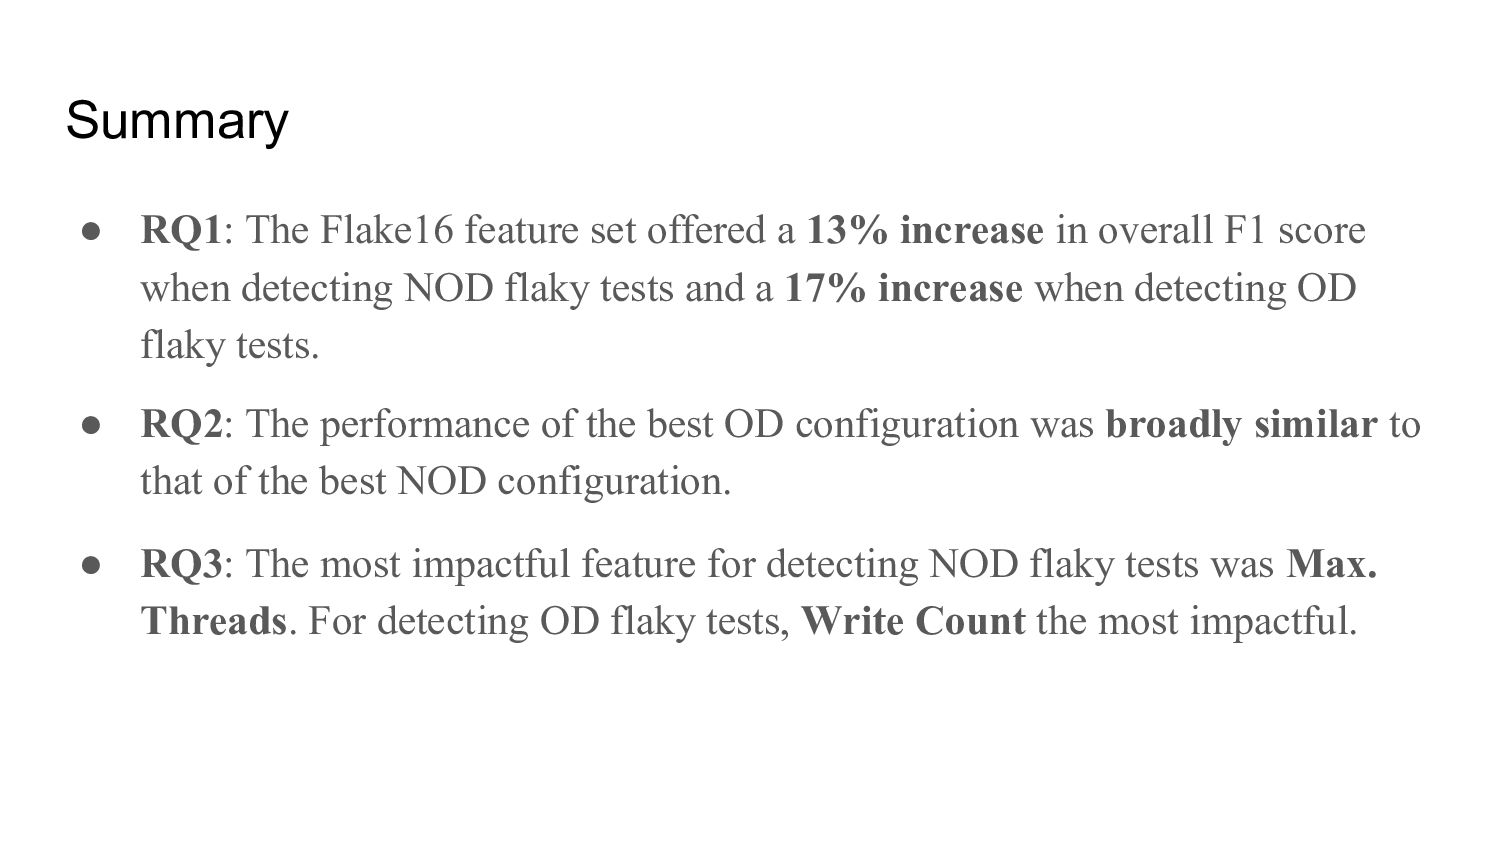
encode a test case is limited and does not consider the detection of OD flaky tests, despite being prevalent in test suites [Lam et. al. 2019]. • We introduced Flake16, a new feature set for encoding test cases for flaky test detection. • It offered a 13% increase in F1 score compared to a previous feature set when detecting non-order-dependent (NOD) flaky tests and a 17% increase when detecting OD flaky tests.
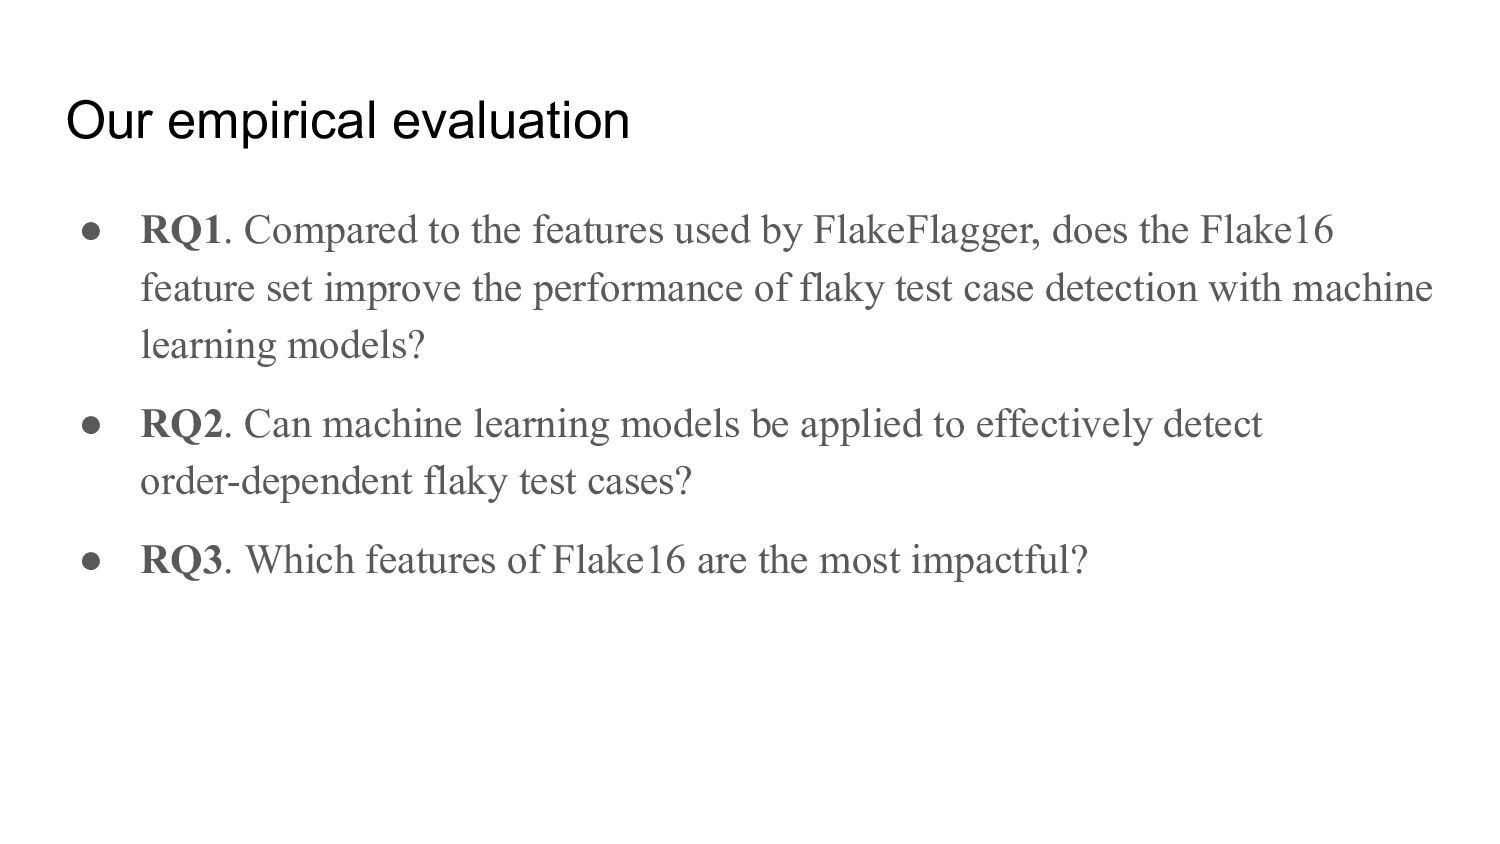
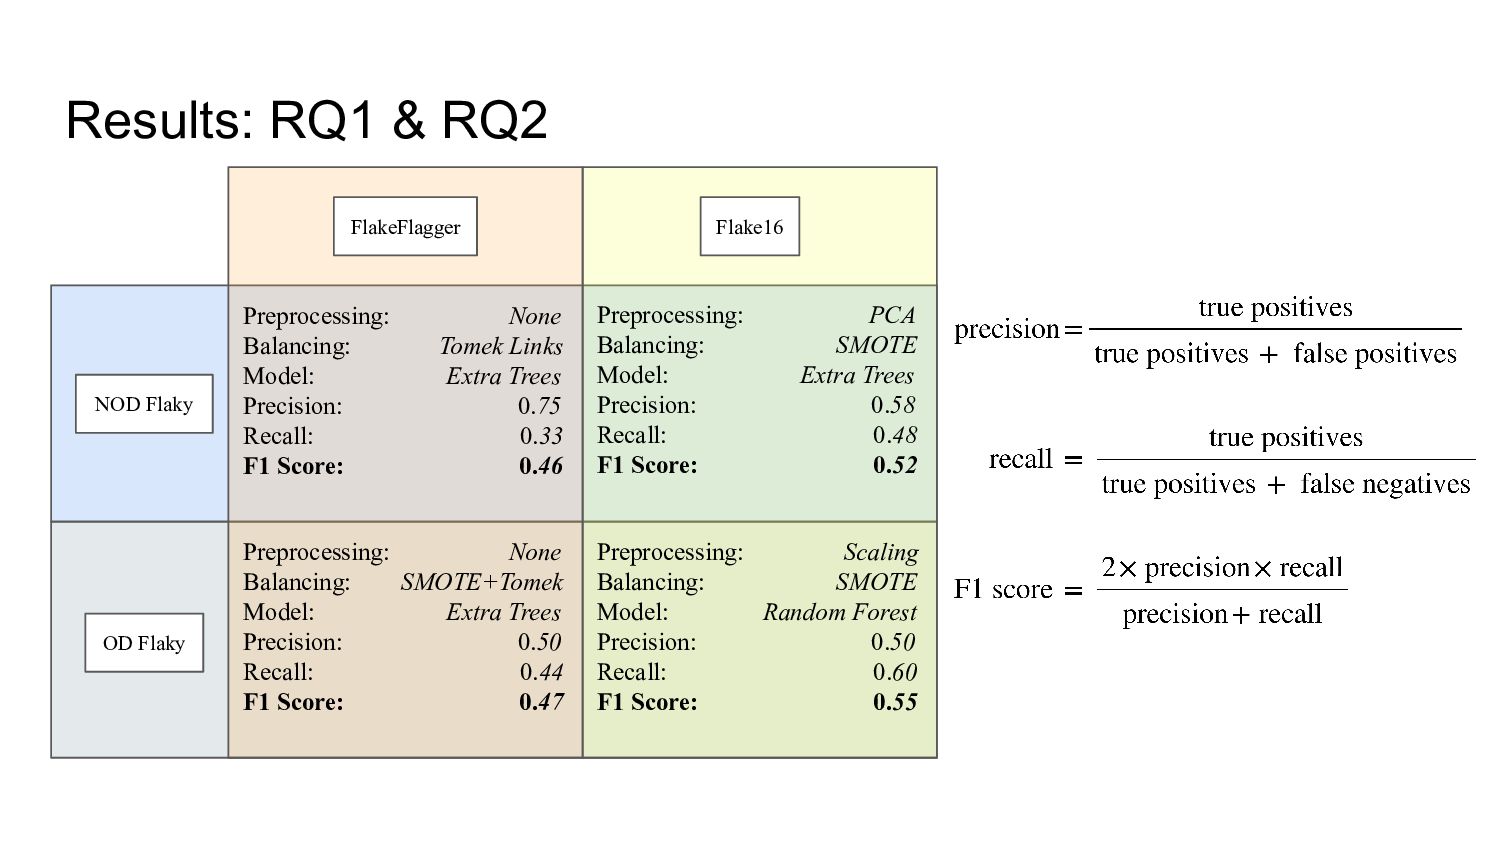
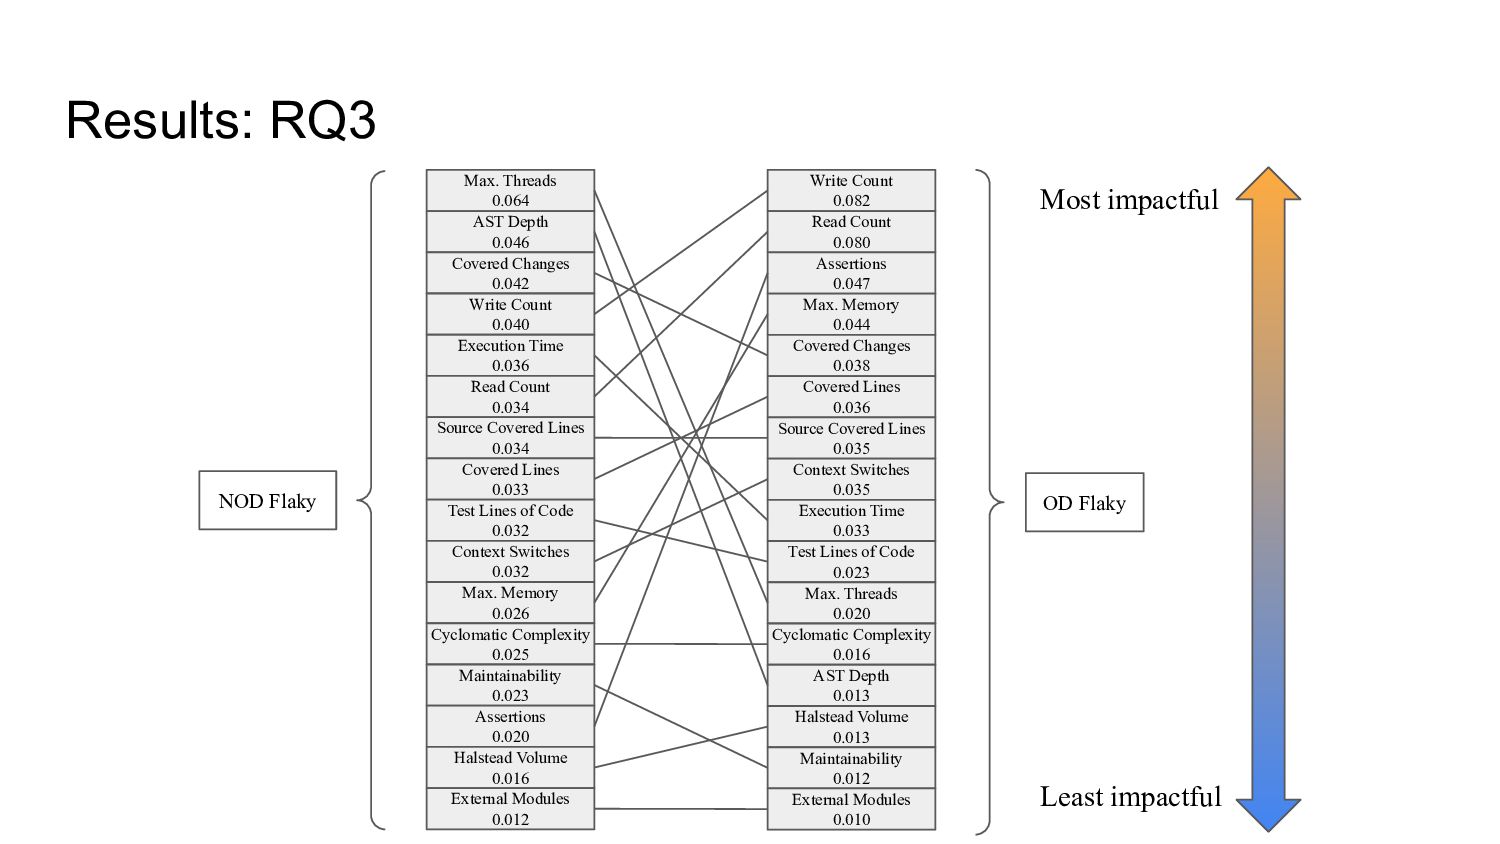
by FlakeFlagger, does the Flake16 feature set improve the performance of flaky test case detection with machine learning models? • RQ2. Can machine learning models be applied to effectively detect order-dependent flaky test cases? • RQ3. Which features of Flake16 are the most impactful?
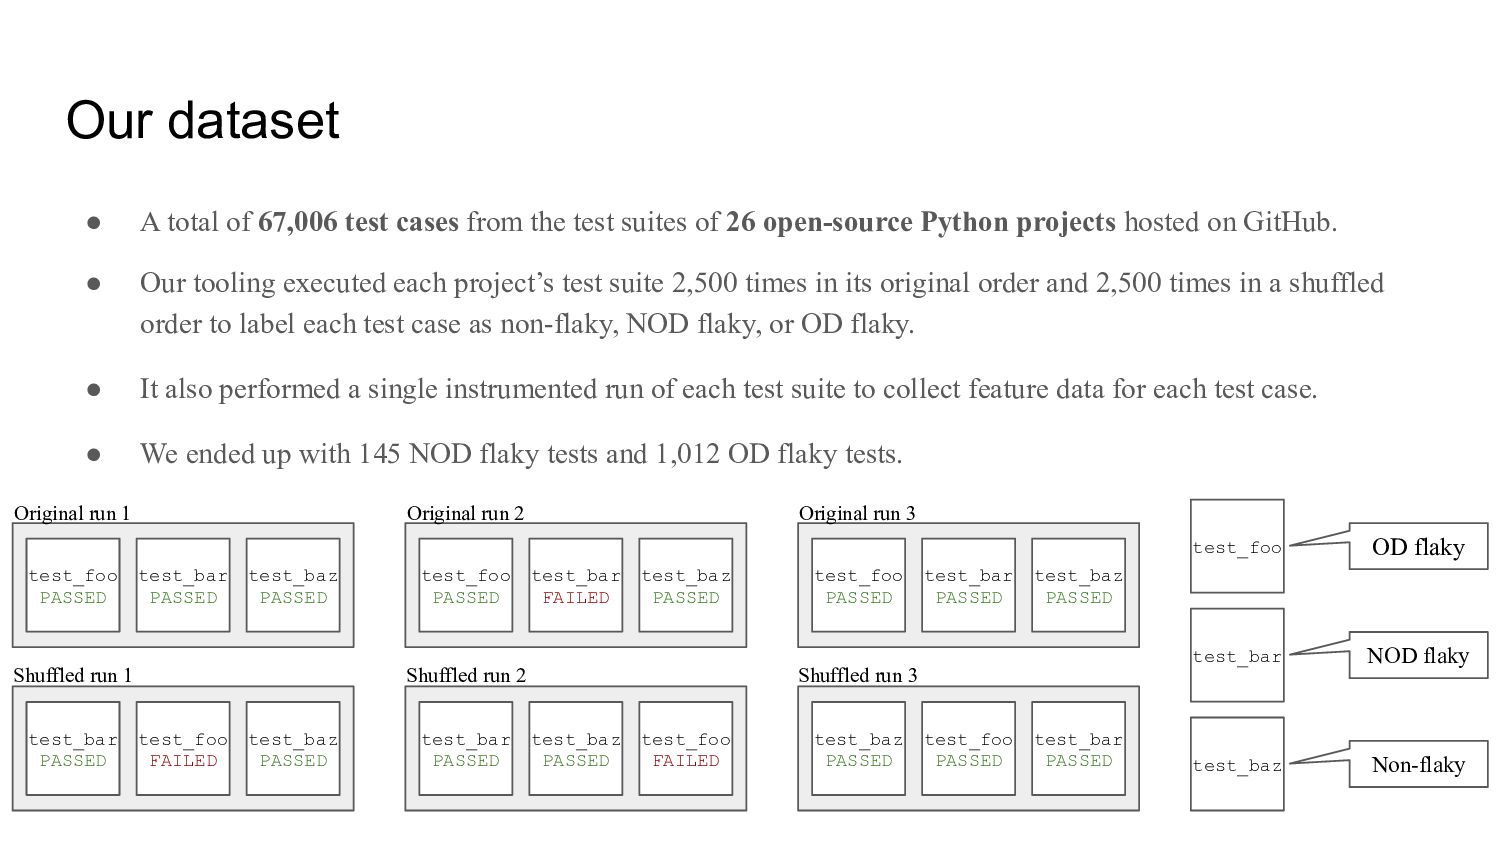
the test suites of 26 open-source Python projects hosted on GitHub. • Our tooling executed each project’s test suite 2,500 times in its original order and 2,500 times in a shuffled order to label each test case as non-flaky, NOD flaky, or OD flaky. • It also performed a single instrumented run of each test suite to collect feature data for each test case. • We ended up with 145 NOD flaky tests and 1,012 OD flaky tests. test_foo PASSED test_bar PASSED test_baz PASSED test_bar PASSED test_foo FAILED test_baz PASSED test_foo PASSED test_bar FAILED test_baz PASSED test_bar PASSED test_baz PASSED test_foo FAILED test_foo PASSED test_bar PASSED test_baz PASSED test_baz PASSED test_foo PASSED test_bar PASSED test_foo test_bar test_baz OD flaky NOD flaky Non-flaky Shuffled run 1 Shuffled run 2 Shuffled run 3 Original run 1 Original run 2 Original run 3
10 folds, where 90% of the dataset is for training the model and 10% for testing. • The class balance of each fold roughly follows that of the whole dataset. • The testing portion of each fold is unique, so every test case gets a predicted label. Dataset test_foo NON-FLAKY test_bar FLAKY test_baz NON-FLAKY test_qux FLAKY Training Testing Fold 1 test_qux FLAKY test_foo NON-FLAKY test_bar FLAKY test_baz NON-FLAKY Training Testing Fold 2 test_baz NON-FLAKY test_qux FLAKY test_foo NON-FLAKY test_bar FLAKY Training Testing Fold 3 test_bar FLAKY test_baz NON-FLAKY test_qux FLAKY test_foo NON-FLAKY Training Testing Fold 4 test_foo NON-FLAKY test_bar FLAKY test_baz NON-FLAKY test_qux FLAKY Model Model Model Model Predicted Labels test_foo NON-FLAKY test_bar FLAKY test_baz FLAKY test_qux NON-FLAKY True- negative True- positive False- positive False- negative
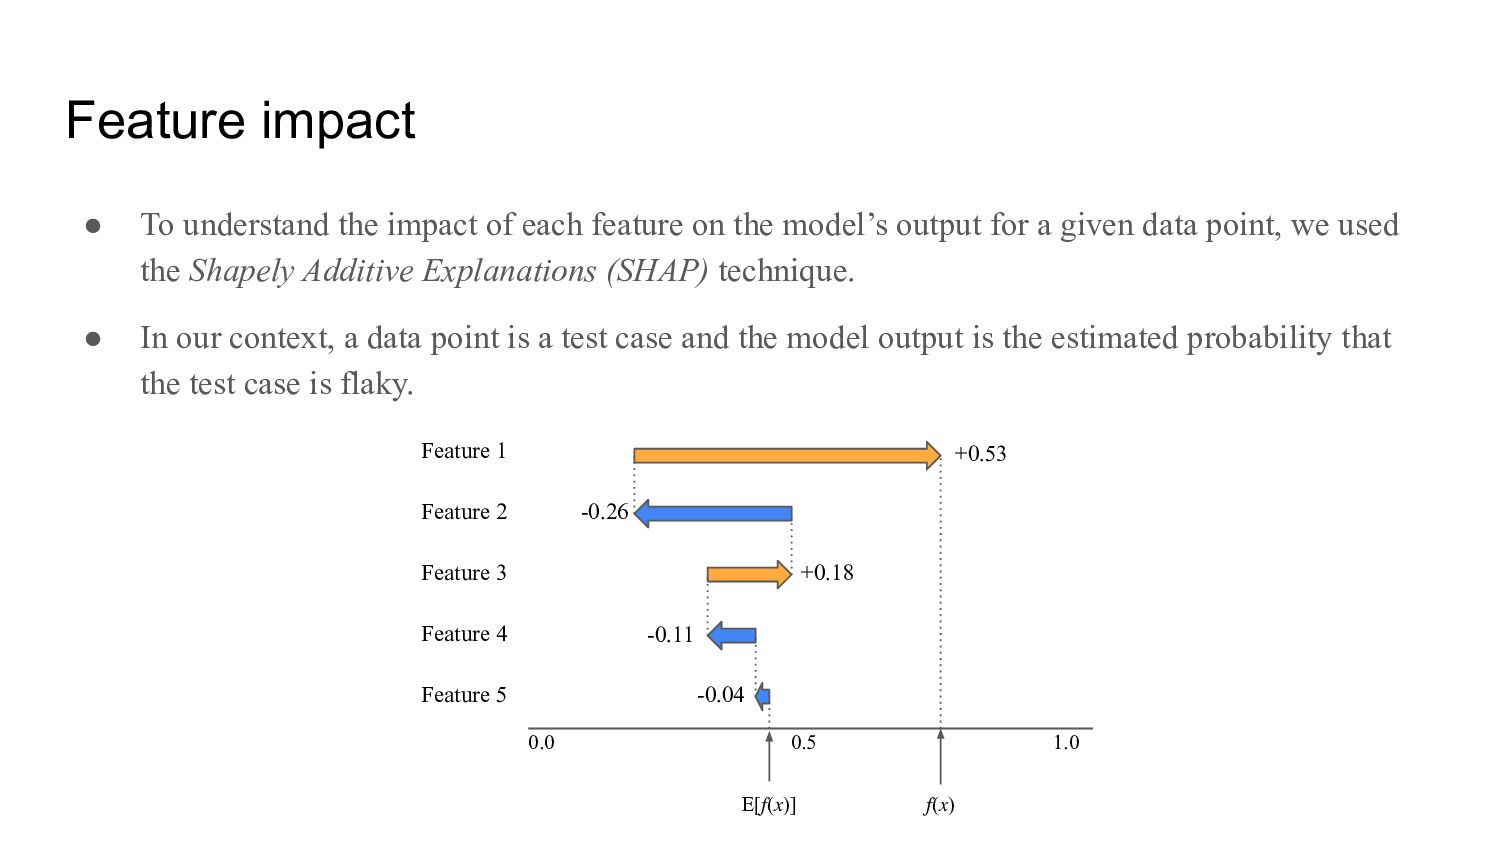
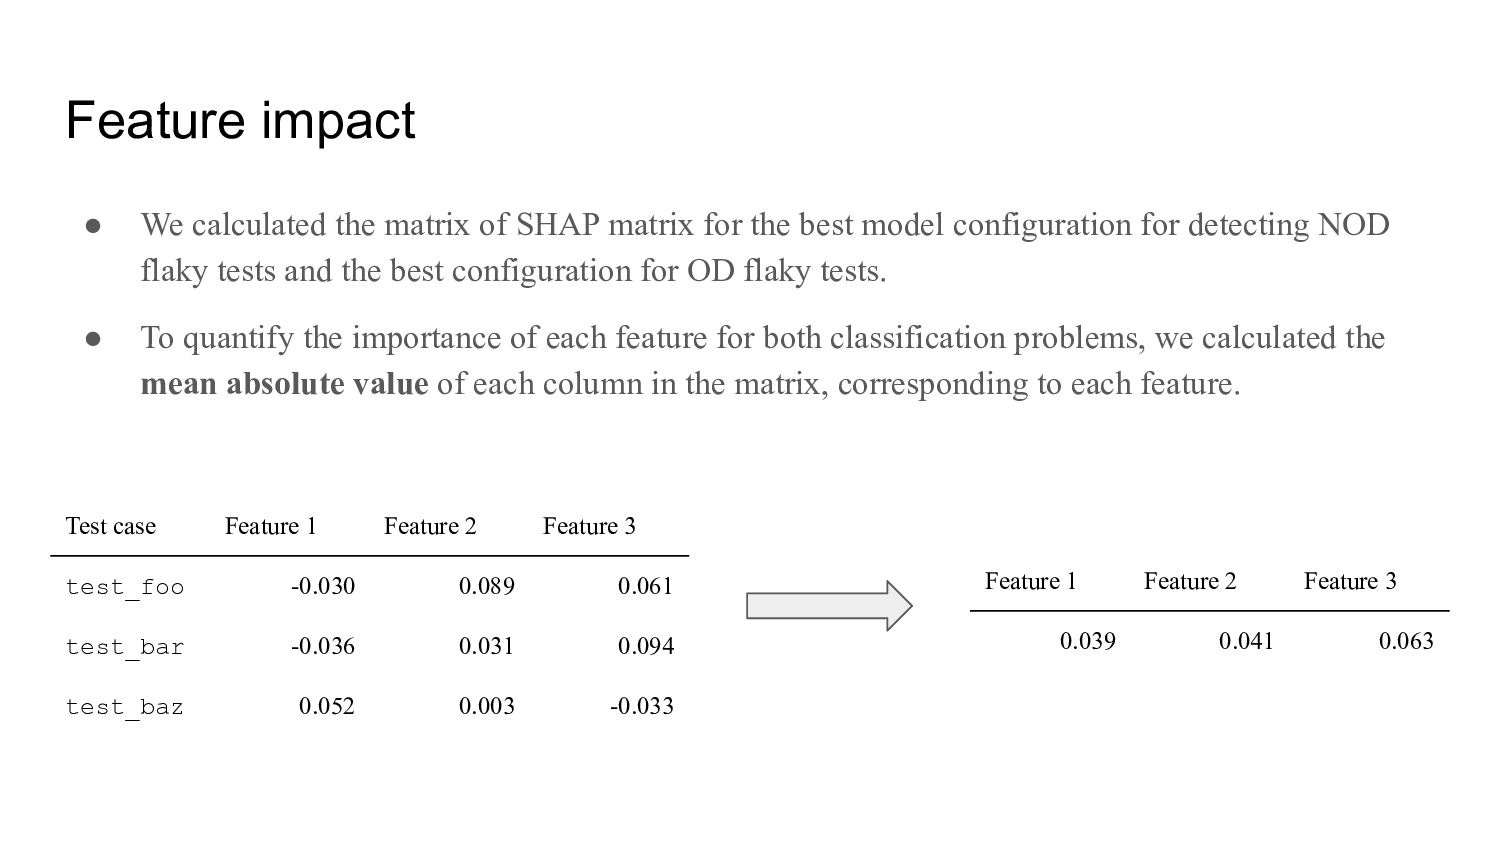
on the model’s output for a given data point, we used the Shapely Additive Explanations (SHAP) technique. • In our context, a data point is a test case and the model output is the estimated probability that the test case is flaky. 0.0 1.0 0.5 Feature 1 Feature 2 Feature 3 Feature 4 E[𝑓(𝑥)] Feature 5 𝑓(𝑥) -0.04 -0.11 +0.18 -0.26 +0.53
for the best model configuration for detecting NOD flaky tests and the best configuration for OD flaky tests. • To quantify the importance of each feature for both classification problems, we calculated the mean absolute value of each column in the matrix, corresponding to each feature. Test case Feature 1 Feature 2 Feature 3 test_foo -0.030 0.089 0.061 test_bar -0.036 0.031 0.094 test_baz 0.052 0.003 -0.033 Feature 1 Feature 2 Feature 3 0.039 0.041 0.063
increase in overall F1 score when detecting NOD flaky tests and a 17% increase when detecting OD flaky tests. • RQ2: The performance of the best OD configuration was broadly similar to that of the best NOD configuration. • RQ3: The most impactful feature for detecting NOD flaky tests was Max. Threads. For detecting OD flaky tests, Write Count the most impactful.