Upgrade to Pro — share decks privately, control downloads, hide ads and more …

Presentation at Open Innovation Symposium 2013

Harish Pillay
October 01, 2013

Presentation at Open Innovation Symposium 2013

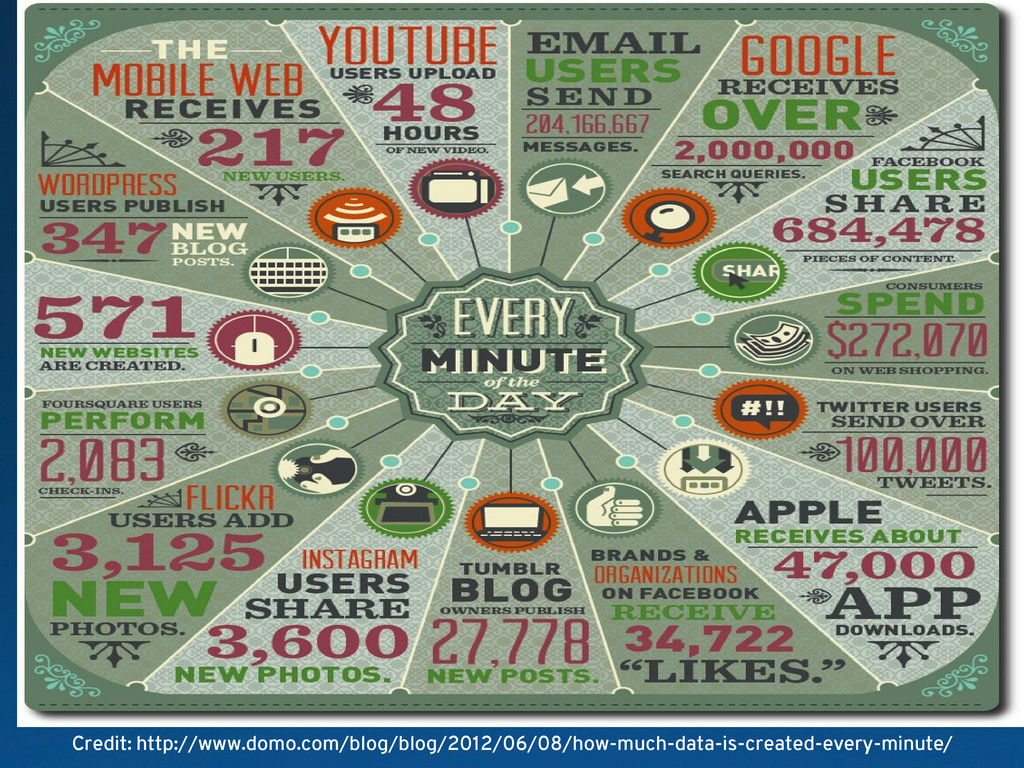
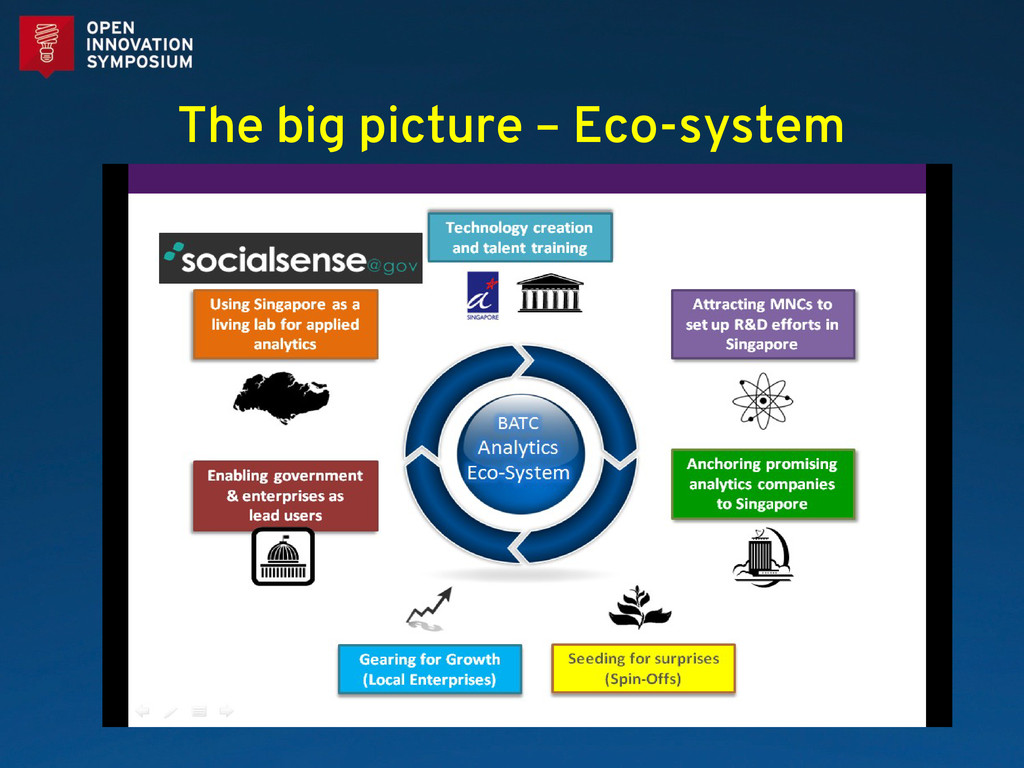
Why Big Data matters and how open source can help with the efforts in understanding and benefiting from big data analysis. Presentation jointly done with BATC of A-STAR.

This presentation was done after a speech by Minister Balakrishnan. The transcript of his speech is at: http://app.mewr.gov.sg/web/Contents/Contents.aspx?Yr=2013&ContId=1891

After him, the speaker was Red Hat CEO, Jim Whitehurst.

Harish Pillay

October 01, 2013
Tweet

More Decks by Harish Pillay

Other Decks in Science

Transcript

  1. Drama Centre, National Library Board October 1, 2013 GUEST-OF-HONOUR: Dr.

    Vivian Balakrishnan, Minister for the Environment and Water Resources
  2. Big Data: ➔ Comes from computational sciences ➔ Describes scenarios

    where the amount (volume) of data COMING IN vastly outstrips the software tools to store and even process it.
  3. What is Business Analytics spreadsheets scorecards dashboards pivot tables data

    warehousing month-end reports Prepared Data, Known Problem
  4. What is Business Analytics spreadsheets scorecards dashboards pivot tables data

    warehousing month-end reports Prepared Data, Known Problem text mining information visualisation social media analytics sentiment analysis unstructured data predictive analytics on-demand reports integrated data platform Raw Data, Unknown Problem
  5. What if: you can know how crowded the MRT train

    is and move to the platform next to the less crowded carriage?
  6. What does this mean? • Value proposition – different for

    different stakeholders • End-users?
  7. What does this mean? • Value proposition – different for

    different stakeholders • End-users? • Source for the best course(s) that fits my needs
  8. What does this mean? • Value proposition – different for

    different stakeholders • End-users? • Source for the best course(s) that fits my needs • Personalised recommendations
  9. What does this mean? • Value proposition – different for

    different stakeholders • End-users? • Source for the best course(s) that fits my needs • Personalised recommendations • Organisations?
  10. What does this mean? • Value proposition – different for

    different stakeholders • End-users? • Source for the best course(s) that fits my needs • Personalised recommendations • Organisations? • Holistic training programme for my employees
  11. What does this mean? • Value proposition – different for

    different stakeholders • End-users? • Source for the best course(s) that fits my needs • Personalised recommendations • Organisations? • Holistic training programme for my employees • Specific areas to build skills and capability
  12. What does this mean? • Training providers • Does this

    give me insights into my competitors?
  13. What does this mean? • Training providers • Does this

    give me insights into my competitors? • Where's my niche?
  14. What does this mean? • Training providers • Does this

    give me insights into my competitors? • Where's my niche? • Where's my blue-ocean?
  15. What does this mean? • Training providers • Does this

    give me insights into my competitors? • Where's my niche? • Where's my blue-ocean? • Policy-makers
  16. What does this mean? • Training providers • Does this

    give me insights into my competitors? • Where's my niche? • Where's my blue-ocean? • Policy-makers • Which areas to invest to build capability?
  17. What does this mean? • Training providers • Does this

    give me insights into my competitors? • Where's my niche? • Where's my blue-ocean? • Policy-makers • Which areas to invest to build capability? • Who are the key players to work with?
  18. What does this mean? • New businesses? • New services

    to offer? Offering insights as a service?
  19. What does this mean? • New businesses? • New services

    to offer? Offering insights as a service? • New businesses to co-create
  20. Are we missing something? • Using the tools and technology

    alone can’t address all your business needs
  21. Are we missing something? • Using the tools and technology

    alone can’t address all your business needs • What are the business problems?
  22. Are we missing something? • Using the tools and technology

    alone can’t address all your business needs • What are the business problems? • How real and painful are these problems?
  23. Are we missing something? • Using the tools and technology

    alone can’t address all your business needs • What are the business problems? • How real and painful are these problems? • Which analytical techniques to apply? What are the pros and cons to each technique?
  24. Are we missing something? • Using the tools and technology

    alone can’t address all your business needs • What are the business problems? • How real and painful are these problems? • Which analytical techniques to apply? What are the pros and cons to each technique? • How do you translate the business problems into viable solutions that can be deployed?
  25. Are we missing something? • Using the tools and technology

    alone can’t address all your business needs • What are the business problems? • How real and painful are these problems? • Which analytical techniques to apply? What are the pros and cons to each technique? • How do you translate the business problems into viable solutions that can be deployed?
  26. The Large Hadron Collider (LHC) produces millions of collisions every

    second in each detector, generating approximately one petabyte of data per second. http://home.web.cern.ch/about/updates/2013/04/animation-shows-lhc-data- processing
  27. But today’s computing systems aren't capable of recording at such

    rates ... http://home.web.cern.ch/about/updates/2013/04/animation-shows-lhc-data- processing
  28. So sophisticated selection systems are used for a fast electronic

    pre- selection, only passing one out of every 10,000 events ... http://home.web.cern.ch/about/updates/2013/04/animation-shows-lhc-data- processing
  29. Tens of thousands of processor cores then select 1% of

    the remaining events for analysis ... http://home.web.cern.ch/about/updates/2013/04/animation-shows-lhc-data- processing
  30. That's it: 1% of 1 in every 10,000 from 1

    petabyte Does science need to make that compromise? Can't we do better? http://home.web.cern.ch/about/updates/2013/04/animation-shows-lhc-data- processing
  31. 1. Sign up on: – openshift.redhat.com – github.com 2. Install

    Hadoop (and R) 3. Get data from data.gov.sg 4. Engage with BATC to bring your ideas to life