Upgrade to Pro
— share decks privately, control downloads, hide ads and more …
Speaker Deck
Features
Speaker Deck
PRO
Sign in
Sign up for free
Search
Search
RDS_Auroraパフォーマンスインサイトを使ってみる(PostgreSQLアンカンファレンス)
Search
hmatsu47
PRO
February 28, 2021
Technology
1.6k
0
Share
Embed
Copy iframe code
Copy JS code
Copy link
Start on current slide
RDS_Auroraパフォーマンスインサイトを使ってみる(PostgreSQLアンカンファレンス)
第 21 回 PostgreSQL アンカンファレンス@オンライン 2021/03/02
hmatsu47
PRO
February 28, 2021
More Decks by hmatsu47
See All by hmatsu47
ゲームで挑戦!VPC の気持ちになって IPv4/v6 パケットをルーティングしよう!
hmatsu47
PRO
0
20
続・名古屋城とデータセンター
hmatsu47
PRO
0
20
【再演】IPv6 VPC の実装パターンをいくつか
hmatsu47
PRO
0
21
名古屋城とデータセンター
hmatsu47
PRO
0
32
IPv6 に関する話
hmatsu47
PRO
0
23
さいきんの光ファイバーの話
hmatsu47
PRO
0
50
低いほうのレイヤを見てみる話
hmatsu47
PRO
0
26
IPv6 VPC の実装パターンをいくつか
hmatsu47
PRO
0
44
光ファイバーと IPv6 絡みの話
hmatsu47
PRO
0
60
Other Decks in Technology
See All in Technology
ファミコンでPHPを動かす / PHP on the Famicom
tomzoh
2
630
クラウドを使う側から、作る側へ / 大吉祥寺.pm 2026前夜祭
fujiwara3
6
1.3k
AI x 開発生産性を取り巻く予算戦略と投資対効果
i35_267
7
3.1k
Devsumi 2026 Summer 人もAIも使える共通基盤を事業の加速装置にする~デザインシステム運用に学ぶ組織レバレッジ~ 渡辺 凌央
legalontechnologies
PRO
1
290
AI、CDK と協働する Full TypeScript アプリケーション開発 / Full TypeScript Application with AI and CDK
geekplus_tech
2
490
【公開用】AI_Dev_Ex2026_AI_登壇資料
matsuritechnologies
PRO
2
560
VPCセキュリティ対応の最新事情
nagisa53
1
310
Multicaで30個のミニプロジェクトをAIエージェント運用して見えてきたこと
eiei114
1
650
テックカンファレンス三大ステークホルダーの文化人類学 ─ 違いを認め合う関係性作り
bash0c7
1
270
AI時代こそ、スケールしないことをしよう -「作る人」から「なぜ作るか」を考える人へ / Do Things That Don't Scale in the AI Era — From How to Why
kaminashi
1
110
複数プロダクトで進めるAI機能実装 ── 実践から得たリアルな学びとロードマップ実現への挑戦 / AICon2026_yanari
rakus_dev
1
280
AI時代におけるテストの基礎の再定義 / Rethinking the Fundamentals of Testing in the AI Era
mineo_matsuya
14
5.3k
Featured
See All Featured
Beyond borders and beyond the search box: How to win the global "messy middle" with AI-driven SEO
davidcarrasco
3
190
XXLCSS - How to scale CSS and keep your sanity
sugarenia
249
1.3M
Noah Learner - AI + Me: how we built a GSC Bulk Export data pipeline
techseoconnect
PRO
0
340
Marketing to machines
jonoalderson
1
5.6k
Agile Actions for Facilitating Distributed Teams - ADO2019
mkilby
0
220
Music & Morning Musume
bryan
47
7.3k
The Web Performance Landscape in 2024 [PerfNow 2024]
tammyeverts
12
1.2k
実際に使うSQLの書き方 徹底解説 / pgcon21j-tutorial
soudai
PRO
201
75k
Context Engineering - Making Every Token Count
addyosmani
9
1k
Mozcon NYC 2025: Stop Losing SEO Traffic
samtorres
1
410
WENDY [Excerpt]
tessaabrams
11
38k
Bash Introduction
62gerente
615
220k
Transcript
RDS / Aurora パフォーマンスインサイトを 使ってみる(PostgreSQL 編) 第 21 回 PostgreSQL
アンカンファレンス@オンライン 2021/03/02 まつひさ(hmatsu47)
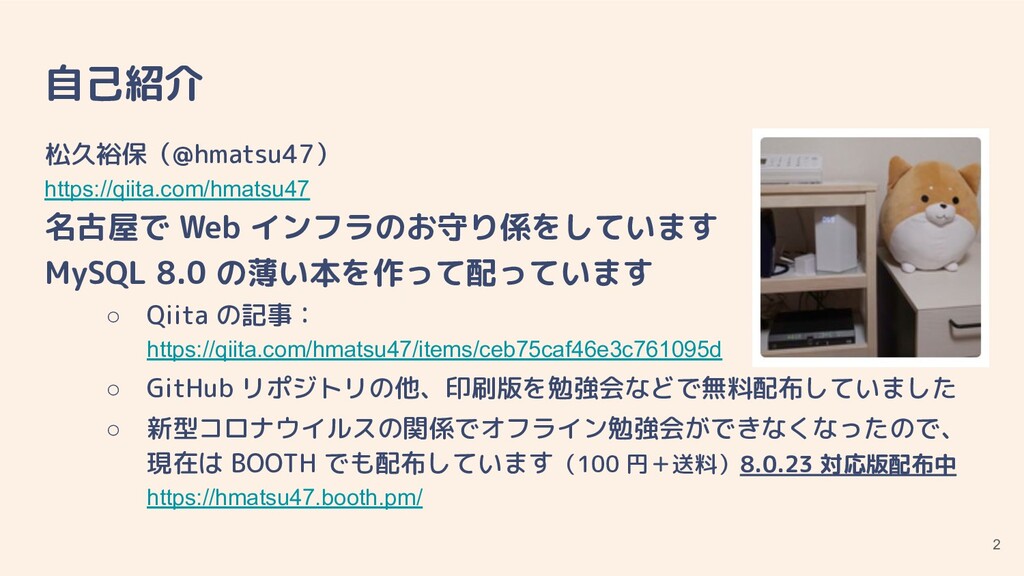
自己紹介 松久裕保(@hmatsu47) https://qiita.com/hmatsu47 名古屋で Web インフラのお守り係をしています MySQL 8.0 の薄い本を作って配っています ◦
Qiita の記事: https://qiita.com/hmatsu47/items/ceb75caf46e3c761095d ◦ GitHub リポジトリの他、印刷版を勉強会などで無料配布していました ◦ 新型コロナウイルスの関係でオフライン勉強会ができなくなったので、 現在は BOOTH でも配布しています(100 円+送料)8.0.23 対応版配布中 https://hmatsu47.booth.pm/ 2
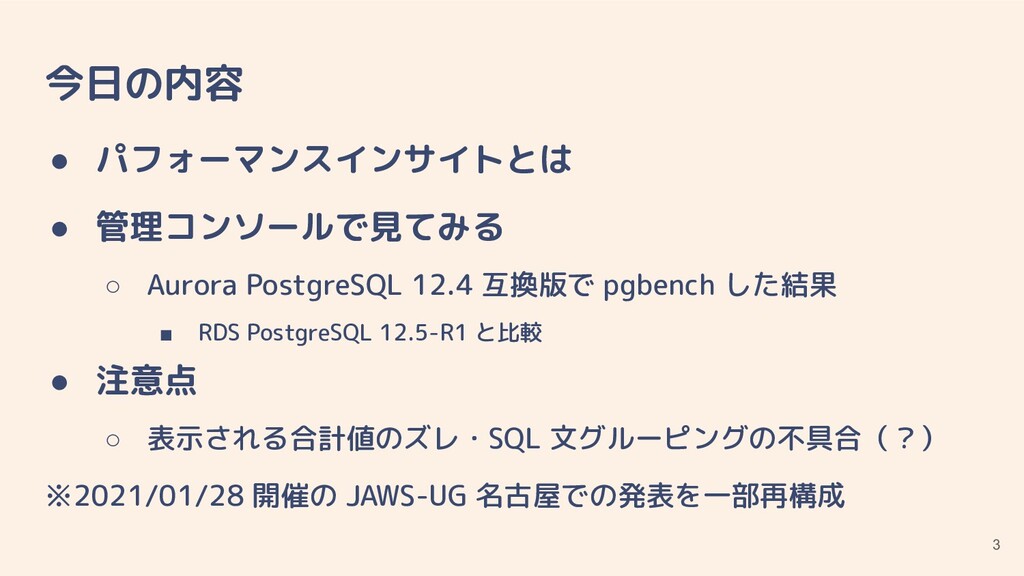
今日の内容 • パフォーマンスインサイトとは • 管理コンソールで見てみる ◦ Aurora PostgreSQL 12.4 互換版で
pgbench した結果 ▪ RDS PostgreSQL 12.5-R1 と比較 • 注意点 ◦ 表示される合計値のズレ・SQL 文グルーピングの不具合(?) ※2021/01/28 開催の JAWS-UG 名古屋での発表を一部再構成 3
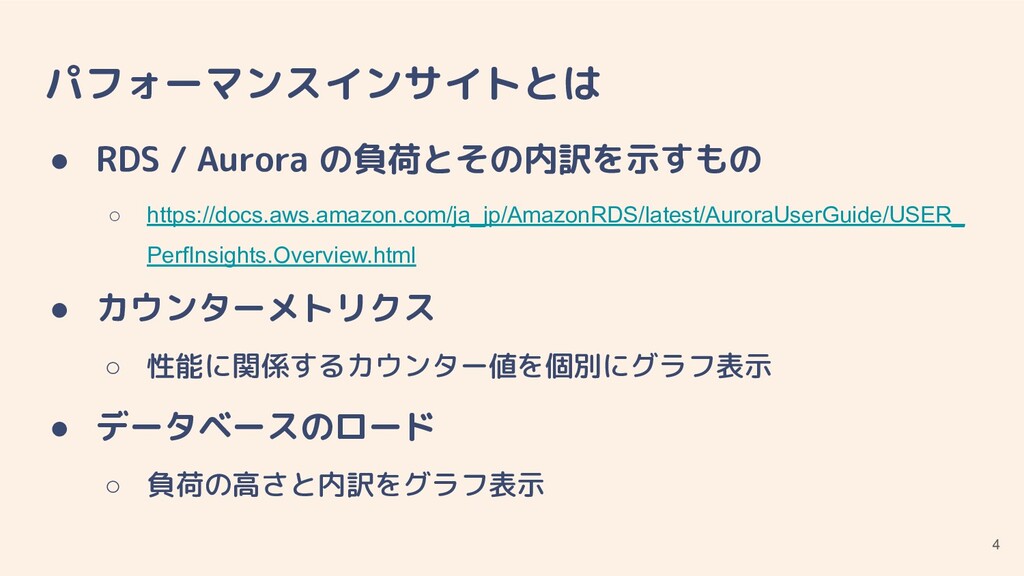
パフォーマンスインサイトとは • RDS / Aurora の負荷とその内訳を示すもの ◦ https://docs.aws.amazon.com/ja_jp/AmazonRDS/latest/AuroraUserGuide/USER_ PerfInsights.Overview.html •
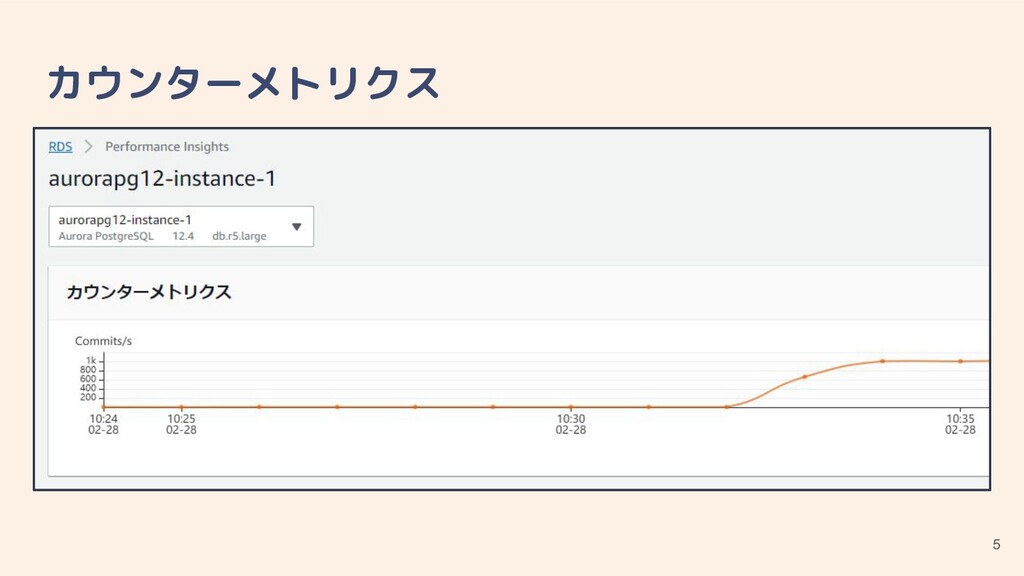
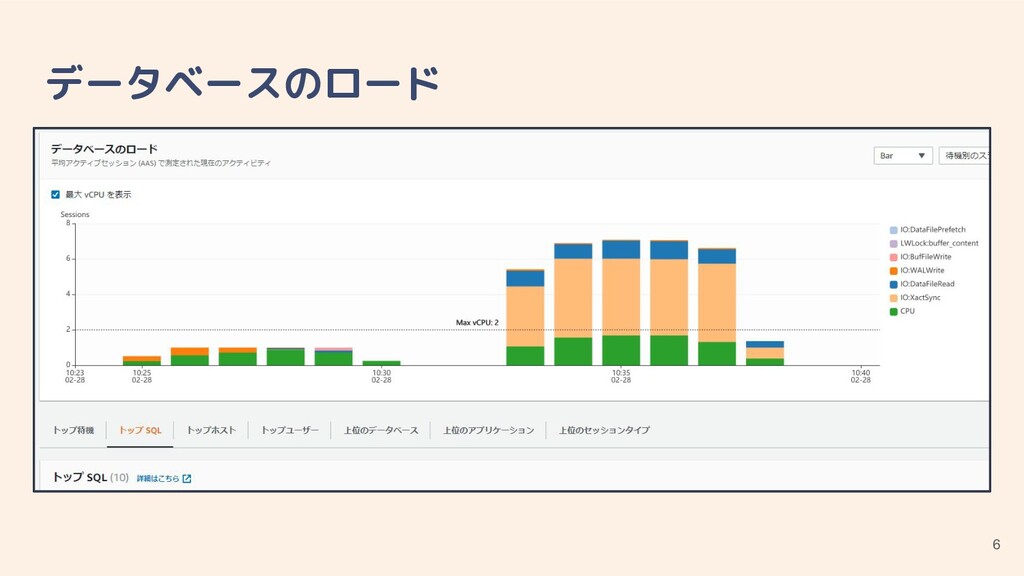
カウンターメトリクス ◦ 性能に関係するカウンター値を個別にグラフ表示 • データベースのロード ◦ 負荷の高さと内訳をグラフ表示 4
カウンターメトリクス 5
データベースのロード 6
データベースのロード • 合計:単位時間あたり平均コネクション数 • 内訳:待機イベント毎の所要時間 ◦ 上位 9 個(※)+ CPU
時間(緑)で計 10 個 (※)「上位 9 個」は選択期間内における上位 9 個 ◦ 正規化した SQL(文)上位 10 個の待機イベント内訳も表示可能 ▪ SQL(文)正規化(グルーピング) ≠ DB(テーブル)正規化 ▪ 空白・クォート等を揃え、 パラメータを「?」に置き換え 7
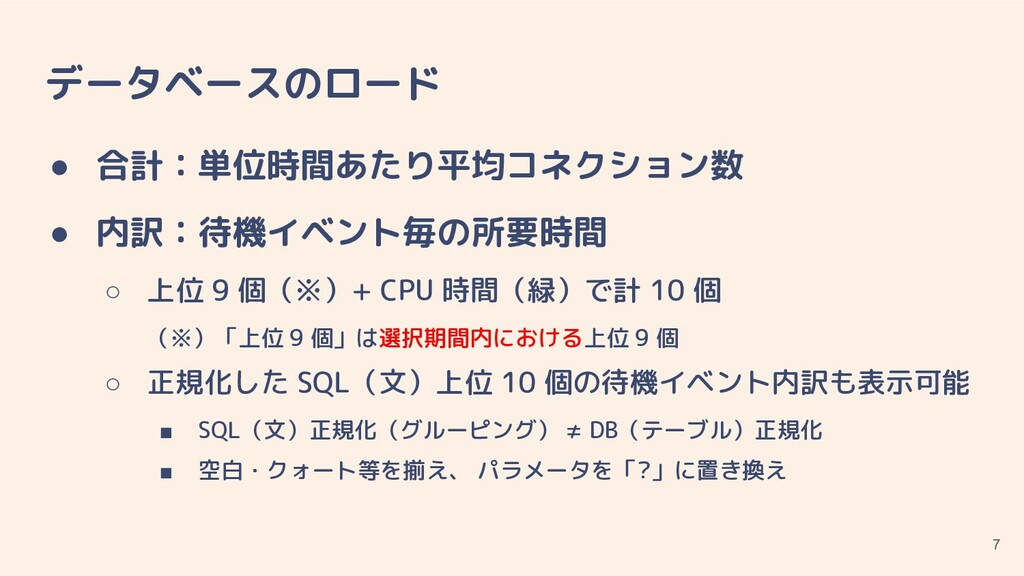
待機イベント 8
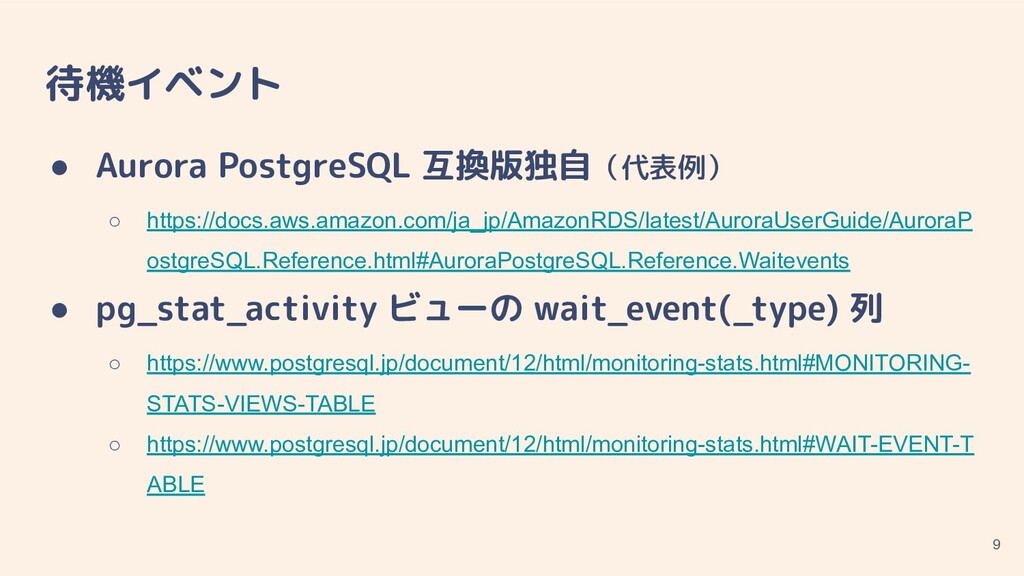
待機イベント • Aurora PostgreSQL 互換版独自(代表例) ◦ https://docs.aws.amazon.com/ja_jp/AmazonRDS/latest/AuroraUserGuide/AuroraP ostgreSQL.Reference.html#AuroraPostgreSQL.Reference.Waitevents • pg_stat_activity
ビューの wait_event(_type) 列 ◦ https://www.postgresql.jp/document/12/html/monitoring-stats.html#MONITORING- STATS-VIEWS-TABLE ◦ https://www.postgresql.jp/document/12/html/monitoring-stats.html#WAIT-EVENT-T ABLE 9
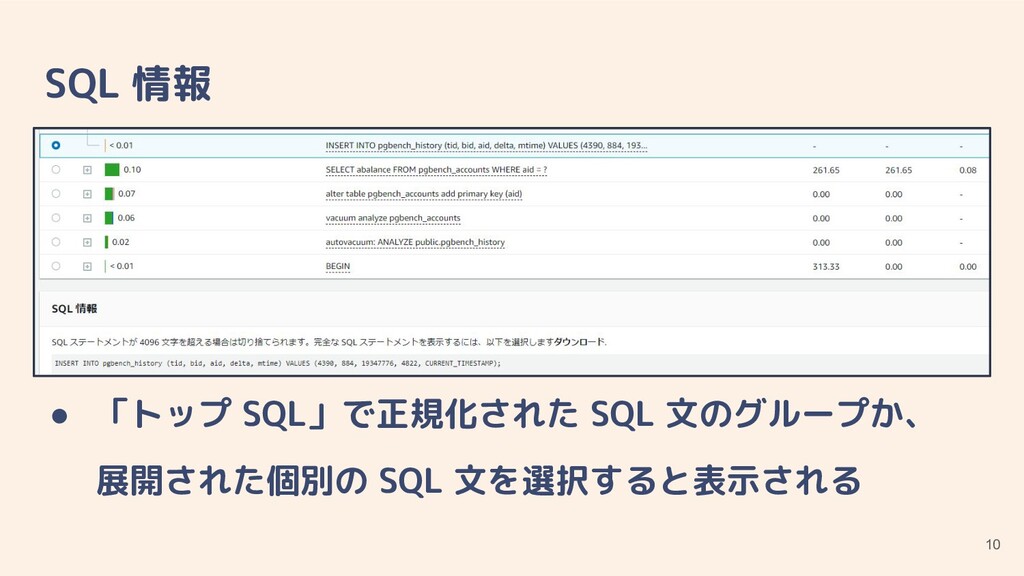
SQL 情報 • • 「トップ SQL」で正規化された SQL 文のグループか、 展開された個別の SQL
文を選択すると表示される 10
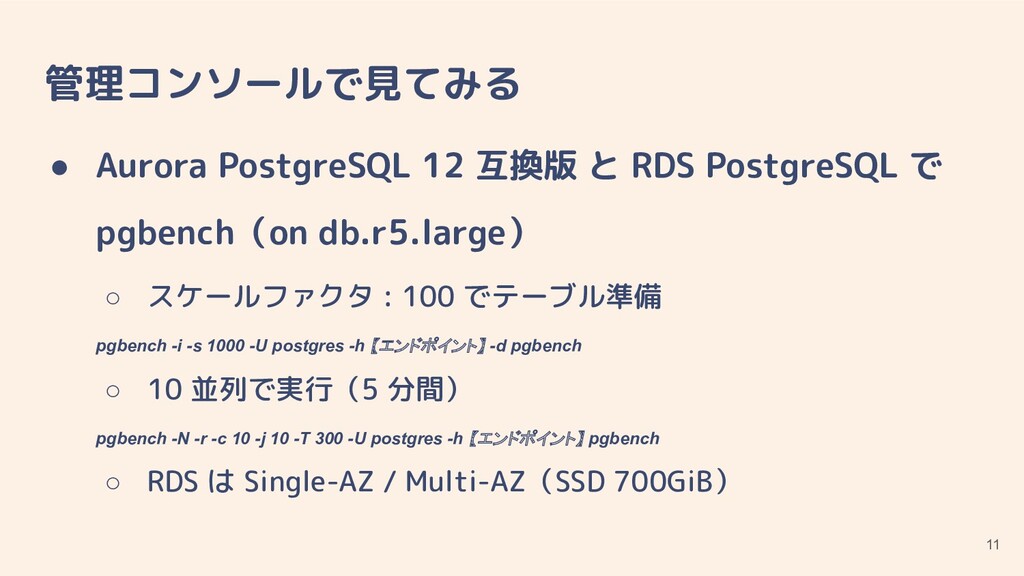
管理コンソールで見てみる • Aurora PostgreSQL 12 互換版 と RDS PostgreSQL で
pgbench(on db.r5.large) ◦ スケールファクタ : 100 でテーブル準備 pgbench -i -s 1000 -U postgres -h 【エンドポイント】 -d pgbench ◦ 10 並列で実行(5 分間) pgbench -N -r -c 10 -j 10 -T 300 -U postgres -h 【エンドポイント】 pgbench ◦ RDS は Single-AZ / Multi-AZ(SSD 700GiB) 11
pgbench 結果(参考) • Aurora PostgreSQL 12.4 互換版 number of transactions
actually processed: 300924 latency average = 9.970 ms tps = 1003.051684 (including connections establishing) tps = 1003.127591 (excluding connections establishing) statement latencies in milliseconds: 0.001 \set aid random(1, 100000 * :scale) 0.000 \set bid random(1, 1 * :scale) 0.000 \set tid random(1, 10 * :scale) 0.000 \set delta random(-5000, 5000) 0.359 BEGIN; 2.119 UPDATE pgbench_accounts SET abalance = abalance + :delta WHERE aid = :aid; 1.417 SELECT abalance FROM pgbench_accounts WHERE aid = :aid; 1.039 INSERT INTO pgbench_history (tid, bid, aid, delta, mtime) VALUES (:tid, :bid, :aid, :delta, CURRENT_TIMESTAMP); 5.035 END; 12
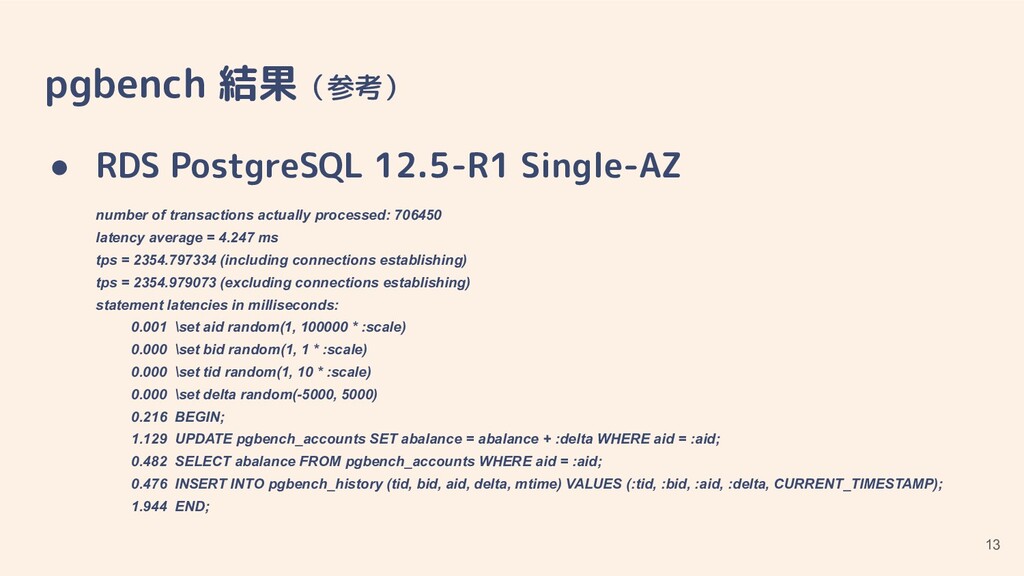
pgbench 結果(参考) • RDS PostgreSQL 12.5-R1 Single-AZ number of transactions
actually processed: 706450 latency average = 4.247 ms tps = 2354.797334 (including connections establishing) tps = 2354.979073 (excluding connections establishing) statement latencies in milliseconds: 0.001 \set aid random(1, 100000 * :scale) 0.000 \set bid random(1, 1 * :scale) 0.000 \set tid random(1, 10 * :scale) 0.000 \set delta random(-5000, 5000) 0.216 BEGIN; 1.129 UPDATE pgbench_accounts SET abalance = abalance + :delta WHERE aid = :aid; 0.482 SELECT abalance FROM pgbench_accounts WHERE aid = :aid; 0.476 INSERT INTO pgbench_history (tid, bid, aid, delta, mtime) VALUES (:tid, :bid, :aid, :delta, CURRENT_TIMESTAMP); 1.944 END; 13
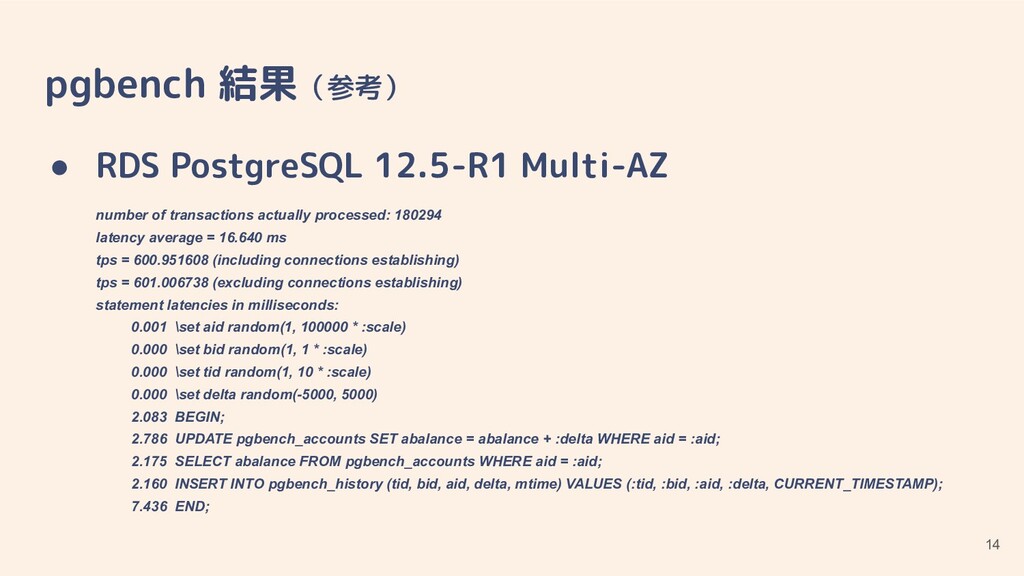
pgbench 結果(参考) • RDS PostgreSQL 12.5-R1 Multi-AZ number of transactions
actually processed: 180294 latency average = 16.640 ms tps = 600.951608 (including connections establishing) tps = 601.006738 (excluding connections establishing) statement latencies in milliseconds: 0.001 \set aid random(1, 100000 * :scale) 0.000 \set bid random(1, 1 * :scale) 0.000 \set tid random(1, 10 * :scale) 0.000 \set delta random(-5000, 5000) 2.083 BEGIN; 2.786 UPDATE pgbench_accounts SET abalance = abalance + :delta WHERE aid = :aid; 2.175 SELECT abalance FROM pgbench_accounts WHERE aid = :aid; 2.160 INSERT INTO pgbench_history (tid, bid, aid, delta, mtime) VALUES (:tid, :bid, :aid, :delta, CURRENT_TIMESTAMP); 7.436 END; 14
注意点 [1] • 選択期間内の上位 9 個 ≠ 対象時間の上位 9 個の場合
(※)CPU を含めて 10 個 ◦ 一部の待機イベントが漏れる・合計値が本来より低くなる ▪ 対象時間に計測された待機イベントが 10 個以上の場合も?(未確認) • API で値を取得してみるとわかる ◦ https://docs.aws.amazon.com/ja_jp/AmazonRDS/latest/AuroraUserGuide/USER_ PerfInsights.API.html 15
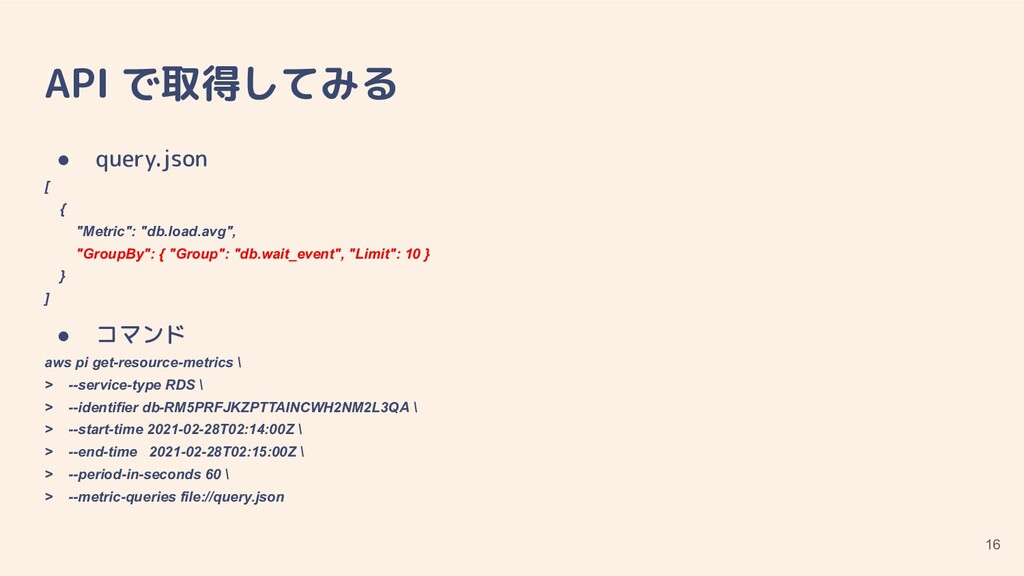
API で取得してみる • query.json [ { "Metric": "db.load.avg", "GroupBy": {
"Group": "db.wait_event", "Limit": 10 } } ] • コマンド aws pi get-resource-metrics \ > --service-type RDS \ > --identifier db-RM5PRFJKZPTTAINCWH2NM2L3QA \ > --start-time 2021-02-28T02:14:00Z \ > --end-time 2021-02-28T02:15:00Z \ > --period-in-seconds 60 \ > --metric-queries file://query.json 16
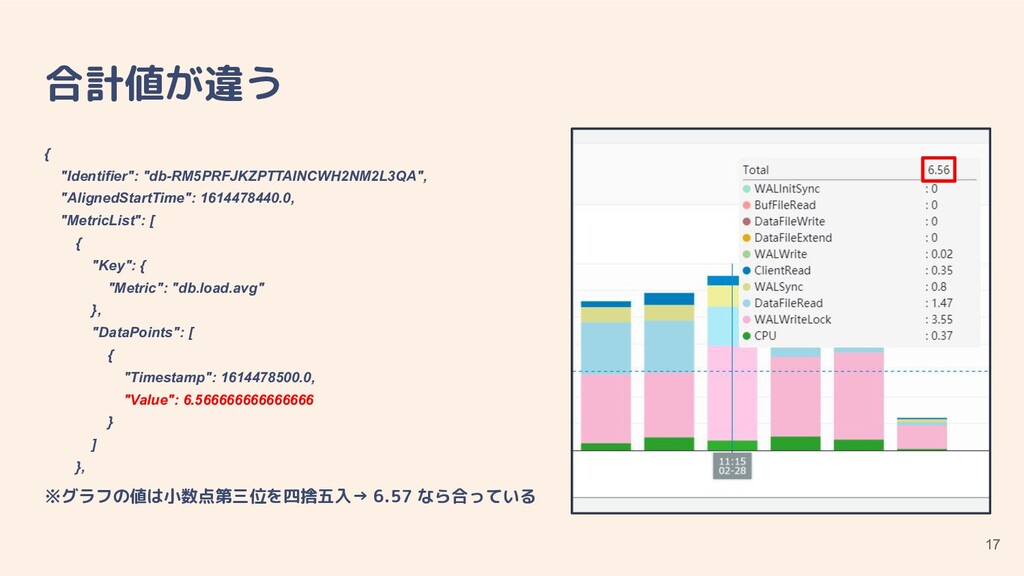
合計値が違う { "Identifier": "db-RM5PRFJKZPTTAINCWH2NM2L3QA", "AlignedStartTime": 1614478440.0, "MetricList": [ { "Key":
{ "Metric": "db.load.avg" }, "DataPoints": [ { "Timestamp": 1614478500.0, "Value": 6.566666666666666 } ] }, ※グラフの値は小数点第三位を四捨五入→ 6.57 なら合っている 17
{ "Key": { "Metric": "db.load.avg", "Dimensions": { "db.wait_event.type": "LWLock", "db.wait_event.name":
"ProcArrayLock" } }, "DataPoints": [ { "Timestamp": 1614478500.0, "Value": 0.016666666666666666 } ] } 原因らしきもの 18 この項目は、対象時間では (CPU を含んだ順位で) 7 位だったが、選択期間内 全体では 9 位圏外だった
注意点 [2] • • • • トップ SQL の正規化(グルーピング)がおかしい? ◦
2 つに分かれてしまうことがある(何らかの意図がある?) 19
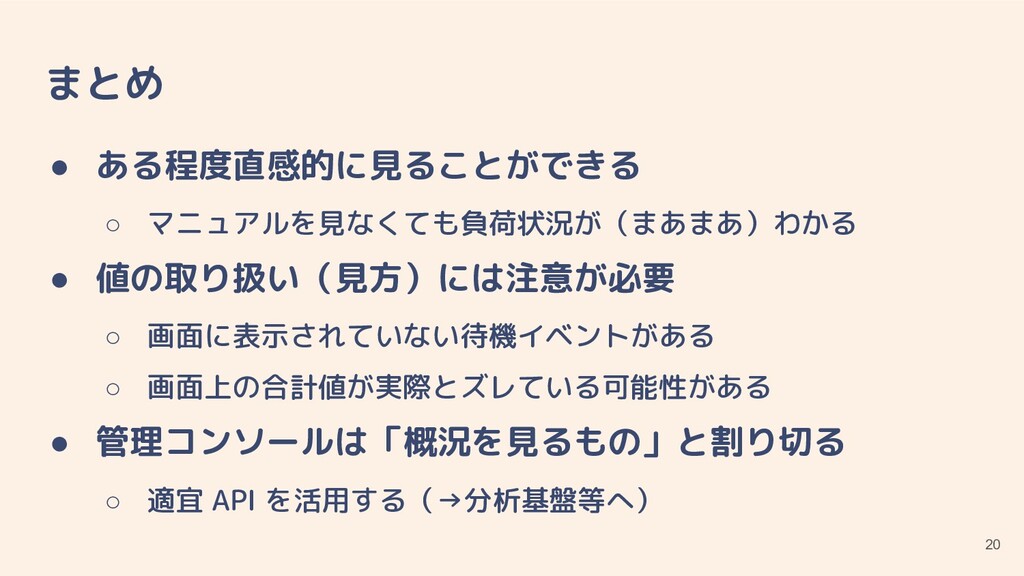
まとめ • ある程度直感的に見ることができる ◦ マニュアルを見なくても負荷状況が(まあまあ)わかる • 値の取り扱い(見方)には注意が必要 ◦ 画面に表示されていない待機イベントがある ◦
画面上の合計値が実際とズレている可能性がある • 管理コンソールは「概況を見るもの」と割り切る ◦ 適宜 API を活用する(→分析基盤等へ) 20
![注意点 [1] • 選択期間内の上位 9 個 ≠ 対象時間の上位 9 個の場合](https://files.speakerdeck.com/presentations/0652543ce8ff44918d1447cf87f74552/slide_14.jpg)
![注意点 [2] • • • • トップ SQL の正規化(グルーピング)がおかしい? ◦](https://files.speakerdeck.com/presentations/0652543ce8ff44918d1447cf87f74552/slide_18.jpg)