Upgrade to Pro
— share decks privately, control downloads, hide ads and more …
Speaker Deck
Features
Speaker Deck
PRO
Sign in
Sign up for free
Search
Search
Beyond grep – PyCon JP
Search
Hynek Schlawack
October 10, 2015
Programming
3.8k
1
Share
Embed
Copy iframe code
Copy JS code
Copy link
Start on current slide
Beyond grep – PyCon JP
Hynek Schlawack
October 10, 2015
More Decks by Hynek Schlawack
See All by Hynek Schlawack
Python’s True Superpower
hynek
0
270
Design Pressure
hynek
0
1.8k
Subclassing, Composition, Python, and You
hynek
3
560
Classy Abstractions @ Python Web Conf
hynek
0
240
On the Meaning of Version Numbers
hynek
0
430
Maintaining a Python Project When It’s Not Your Job
hynek
1
2.5k
How to Write Deployment-friendly Applications
hynek
0
2.6k
Solid Snakes or: How to Take 5 Weeks of Vacation
hynek
2
6k
Get Instrumented: How Prometheus Can Unify Your Metrics
hynek
4
11k
Other Decks in Programming
See All in Programming
エンジニア向け会社紹介/Findy Company Profile
findyinc
6
360k
AIキャラアプリkaiwaの低遅延音声通話基盤をどう作ったか - AWS Gravitonで支える低遅延・低コストAI Agent基盤
mogamit
0
180
Embedded SREと共に達成した会員管理システムのAWS移行 - SRE NEXT 2026 ランチスポンサーセッション
niftycorp
PRO
1
2.8k
【やさしく解説 設計編 #1】「ドメイン駆動」と「実装駆動」ってなに? 〜設計の考え方を、たとえ話で学ぼう〜
panda728
PRO
1
120
ルールを書いて終わらせないハーネスエンジニアリング
yug1224
4
1.7k
霧の中の代数的エフェクト
funnyycat
1
410
The Bowling Game - From Imperative to Functional Programming - Part 1
philipschwarz
PRO
0
340
LaravelLive Japan の裏方のすべて — 第188回 PHP勉強会@東京 (2026-06-24)
suguruooki
2
150
任せる範囲はこう広がった / How the Scope of AI Delegation Has Expanded
nrslib
1
270
광주소프트웨어마이스터고등학교 DevFest 특강 - 바이브 코딩 시대에서 주니어 개발자로 살아남는 방법
utilforever
1
150
AI時代の仕事技芸論〜ソフトウェア開発で「遊ぶように働く」職人的熟達のすすめ(スクフェス仙台 2026バージョン)
kuranuki
0
680
ITヒヤリハットを整理してみた ~ライフサイクルと原因から考える再発防止策~
koukimiura
1
110
Featured
See All Featured
Un-Boring Meetings
codingconduct
0
350
"I'm Feeling Lucky" - Building Great Search Experiences for Today's Users (#IAC19)
danielanewman
230
23k
Automating Front-end Workflow
addyosmani
1370
210k
Design in an AI World
tapps
1
260
Heart Work Chapter 1 - Part 1
lfama
PRO
8
36k
Mozcon NYC 2025: Stop Losing SEO Traffic
samtorres
1
410
Intergalactic Javascript Robots from Outer Space
tanoku
273
27k
Prompt Engineering for Job Search
mfonobong
0
380
StorybookのUI Testing Handbookを読んだ
zakiyama
31
6.8k
Joys of Absence: A Defence of Solitary Play
codingconduct
1
420
The Organizational Zoo: Understanding Human Behavior Agility Through Metaphoric Constructive Conversations (based on the works of Arthur Shelley, Ph.D)
kimpetersen
PRO
0
390
Improving Core Web Vitals using Speculation Rules API
sergeychernyshev
21
1.5k
Transcript
Beyond grep Pragmatic Logging & Metrics Hynek Schlawack
None
ͩΩͷ΅! @hynek https://hynek.me https://github.com/hynek
www.variomedia.de
ox.cx/b
Agenda
Agenda
Agenda
Agenda
Errors
Errors
Requirements
Requirements •fast
Requirements •fast •once
Requirements •fast •once
Requirements •fast •once •context
Requirements •fast •once •context
None
None
None
None
None
None
None
None
None
None
Raven-Python
Raven-Python Transports:
Raven-Python Transports: • gevent
Raven-Python Transports: • gevent • aiohttp
Raven-Python Transports: • gevent • aiohttp • Twisted
Raven-Python Transports: • gevent • aiohttp • Twisted • …8
others
Raven-Python Integrations: Transports: • gevent • aiohttp • Twisted •
…8 others
Raven-Python Integrations: • logging Transports: • gevent • aiohttp •
Twisted • …8 others
Raven-Python Integrations: • logging • Django Transports: • gevent •
aiohttp • Twisted • …8 others
Raven-Python Integrations: • logging • Django • WSGI Transports: •
gevent • aiohttp • Twisted • …8 others
Raven-Python Integrations: • logging • Django • WSGI • …9
others Transports: • gevent • aiohttp • Twisted • …8 others
Vanilla from raven import Client client = Client("https://yoursentry") try: 1
/ 0 except ZeroDivisionError: client.captureException()
Vanilla from raven import Client client = Client("https://yoursentry") try: 1
/ 0 except ZeroDivisionError: client.captureException()
Vanilla from raven import Client client = Client("https://yoursentry") try: 1
/ 0 except ZeroDivisionError: client.captureException()
Vanilla @client.capture_exceptions def foo(): raise Exception()
Django INSTALLED_APPS = ( … "raven.contrib.django.raven_compat", … )
Progress!
Progress! ✓
Metrics
Metrics?
Metrics? • numbers in a DB
Metrics? • numbers in a DB • guessing vs knowing
–D. J. Bernstein “Measure. Don’t speculate.”
System Metrics vs App Metrics • load • network traffic
• I/O • …
System Metrics vs App Metrics • load • network traffic
• I/O • … • counters
System Metrics vs App Metrics • load • network traffic
• I/O • … • counters • timers
System Metrics vs App Metrics • load • network traffic
• I/O • … • counters • timers • gauges
System Metrics vs App Metrics • load • network traffic
• I/O • … • counters • timers • gauges • …
Aggregation
Correlation
Math
Math • # reqs / s?
Math • # reqs / s? • worst 0.01% ⟨req
time⟩?
Math • # reqs / s? • worst 0.01% ⟨req
time⟩? • don’t try this alone!
Monitoring
Monitoring • latency
Monitoring • latency • error rates
Monitoring • latency • error rates • anomalies
Storage
Librato Metrics
Graphite 800 pound gorilla
Grafana
InfluxDB Graphite++ in Go
InfluxDB Graphite++ in Go
Prometheus Metrics & Monitoring
Prometheus Metrics & Monitoring
Prometheus Metrics & Monitoring
Prometheus Metrics & Monitoring
Prometheus Metrics & Monitoring
Prometheus Metrics & Monitoring
Collecting
Approaches
Approaches 1. external aggregation: StatsD, Riemann
Approaches 1. external aggregation: StatsD, Riemann + no state, simple
Approaches 1. external aggregation: StatsD, Riemann + no state, simple
– no direct introspection
Approaches 1. external aggregation: StatsD, Riemann + no state, simple
– no direct introspection 2. aggregate in-app, deliver to DB
Approaches 1. external aggregation: StatsD, Riemann + no state, simple
– no direct introspection 2. aggregate in-app, deliver to DB + in-app dashboard, useful in dev
Approaches 1. external aggregation: StatsD, Riemann + no state, simple
– no direct introspection 2. aggregate in-app, deliver to DB + in-app dashboard, useful in dev – state w/i app
None
(g|py)?statsd(py|-client)? import statsd c = statsd.StatsClient( "statsd.local", 8125 )
(g|py)?statsd(py|-client)?
(g|py)?statsd(py|-client)? c.incr("foo")
(g|py)?statsd(py|-client)? c.incr("foo") c.timing("stats.timed", 320)
Scales from greplin import scales from greplin.scales.meter import MeterStat STATS
= scales.collection( "/Resource", MeterStat("reqs"), scales.PmfStat("request_time") )
Scales from greplin import scales from greplin.scales.meter import MeterStat STATS
= scales.collection( "/Resource", MeterStat("reqs"), scales.PmfStat("request_time") )
Scales
Scales STATS.reqs.mark()
Scales STATS.reqs.mark() with STATS.request_time.time():
Scales STATS.reqs.mark() with STATS.request_time.time(): do_something_expensive()
Dashboard Scales
Dashboard Scales
Dashboard Scales … "request_time": { "count": 567315293, "99percentile": 0.10978688716888428, "75percentile":
0.013181567192077637, "min": 0.0002448558807373047, "max": 30.134822130203247, "98percentile": 0.08934824466705339, "95percentile": 0.027234303951263434, "median": 0.009176492691040039, "999percentile": 0.14235656142234793, "stddev": 0.01676855570363413, "mean": 0.013247184020535955 }, …
from greplin.scales import graphite pusher = graphite.GraphitePeriodicPusher( "graphite.host", 2003, period=30,
prefix="yourapp", ) pusher.allow("**") pusher.start()
Prometheus
Prometheus import random, time from prometheus_client import \ start_http_server, Summary
Prometheus import random, time from prometheus_client import \ start_http_server, Summary
FUNC_TIME = Summary( "func_seconds", "Time spent in func")
Prometheus import random, time from prometheus_client import \ start_http_server, Summary
FUNC_TIME = Summary( "func_seconds", "Time spent in func") @FUNC_TIME.time() def func(t): time.sleep(t)
Prometheus import random, time from prometheus_client import \ start_http_server, Summary
FUNC_TIME = Summary( "func_seconds", "Time spent in func") @FUNC_TIME.time() def func(t): time.sleep(t) if __name__ == '__main__': start_http_server(8000) while True: func(random.random())
Prometheus # HELP func_seconds Time spent in func # TYPE
func_seconds summary func_seconds_count 78.0 func_seconds_sum 37.8028838634491
Progress! ✓
Progress! ✓ ✓
Logging
Splunk
Splunk
Papertrail
loggly
ELK Elasticsearch + Logstash + Kibana
None
None
Logstash
Elasticsearch Logstash
Elasticsearch Logstash
Elasticsearch Logstash Kibana
Graylog
Graylog
Graylog
Graylog
None
None
Goal @400000005270e0d604afce64 { "event": "logged_in", "user": "guido", "ip": "8.8.8.8", "referrer":
"http://google.com" }
Context & Format
structlog
BoundLogger structlog
Original Logger BoundLogger structlog e.g. logging.Logger
Original Logger BoundLogger bind values log.bind(key=value) Context structlog
Original Logger BoundLogger bind values log.bind(key=value) Context log events log.info(event,
another_key=another_value) + structlog
Original Logger BoundLogger Processor 1 Processor n Return Value Return
Value bind values log.bind(key=value) Context log events log.info(event, another_key=another_value) + structlog
>>> import structlog >>> log = structlog.get_logger() >>> log.error("ohai", why=42,
wtf=True) why=42 wtf=True event='ohai'
>>> import structlog >>> log = structlog.get_logger() >>> log.error("ohai", why=42,
wtf=True) why=42 wtf=True event='ohai'
>>> import structlog >>> log = structlog.get_logger() >>> log.error("ohai", why=42,
wtf=True) why=42 wtf=True event='ohai'
>>> import structlog >>> log = structlog.get_logger() >>> log.error("ohai", why=42,
wtf=True) why=42 wtf=True event='ohai'
>>> from structlog import get_logger >>> log = get_logger() >>>
log = log.bind(user='anonymous', some_key=23) >>> log = log.bind(user='hynek', another_key=42) >>> log.info('user.logged_in', happy=True) some_key=23 user='hynek' another_key=42 happy=True event='user.logged_in'
>>> from structlog import get_logger >>> log = get_logger() >>>
log = log.bind(user='anonymous', some_key=23) >>> log = log.bind(user='hynek', another_key=42) >>> log.info('user.logged_in', happy=True) some_key=23 user='hynek' another_key=42 happy=True event='user.logged_in'
>>> from structlog import get_logger >>> log = get_logger() >>>
log = log.bind(user='anonymous', some_key=23) >>> log = log.bind(user='hynek', another_key=42) >>> log.info('user.logged_in', happy=True) some_key=23 user='hynek' another_key=42 happy=True event='user.logged_in'
>>> from structlog import get_logger >>> log = get_logger() >>>
log = log.bind(user='anonymous', some_key=23) >>> log = log.bind(user='hynek', another_key=42) >>> log.info('user.logged_in', happy=True) some_key=23 user='hynek' another_key=42 happy=True event='user.logged_in'
>>> from structlog import get_logger >>> log = get_logger() >>>
log = log.bind(user='anonymous', some_key=23) >>> log = log.bind(user='hynek', another_key=42) >>> log.info('user.logged_in', happy=True) some_key=23 user='hynek' another_key=42 happy=True event='user.logged_in'
def view(request): log = logger.bind(request=request) log.info("view_rendered") return "hello, world"
def view(request): log = logger.bind(request=request) log.info("view_rendered") return "hello, world"
def view(request): log = logger.bind(request=request) log.info("view_rendered") return "hello, world"
def request_extractor(_, __, event): req = event.pop("request", None) if req
is not None: event.update({ "client_addr": req.client_addr, "user_id": req.authenticated_userid, }) return event
def request_extractor(_, __, event): req = event.pop("request", None) if req
is not None: event.update({ "client_addr": req.client_addr, "user_id": req.authenticated_userid, }) return event
def request_extractor(_, __, event): req = event.pop("request", None) if req
is not None: event.update({ "client_addr": req.client_addr, "user_id": req.authenticated_userid, }) return event
def request_extractor(_, __, event): req = event.pop("request", None) if req
is not None: event.update({ "client_addr": req.client_addr, "user_id": req.authenticated_userid, }) return event
{"client_addr": "192.168.42.42", "user_id": null, "event": "view_rendered"}
import logging, sys logger = logging.getLogger() logger.addHandler( logging.StreamHandler( sys.stdout )
)
import logging, sys logger = logging.getLogger() logger.addHandler( logging.StreamHandler( sys.stdout )
)
Capture
Capture • into files
Capture • into files • to syslog / a queue
Capture • into files • to syslog / a queue
• pipe into a logging agent
None
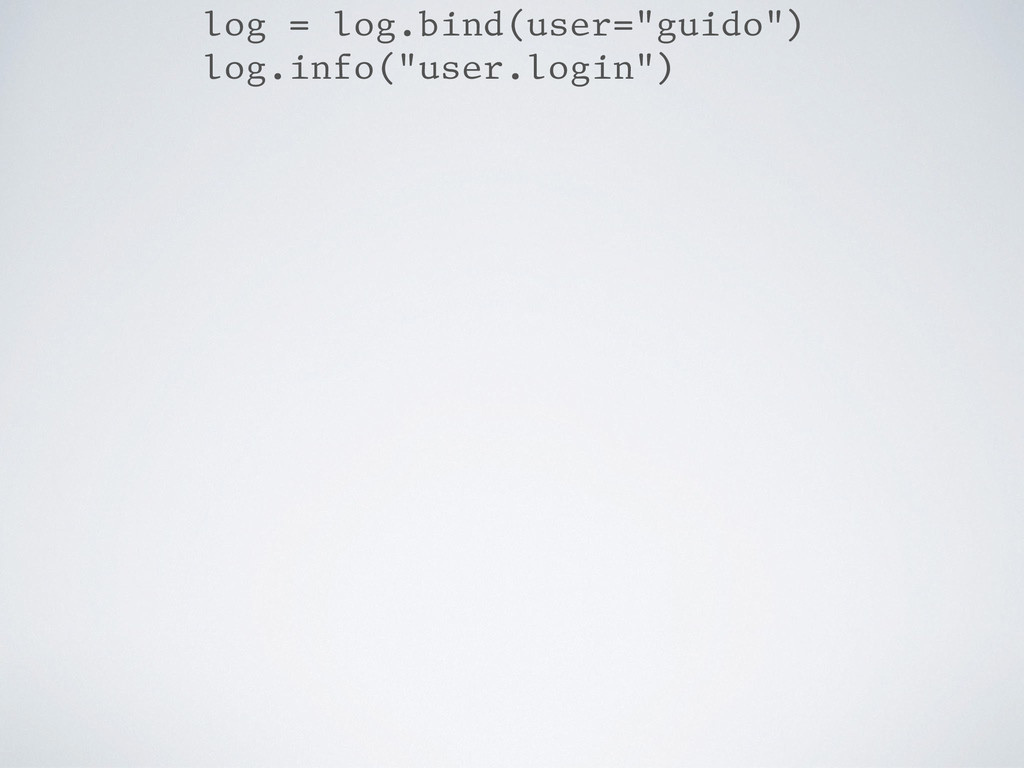
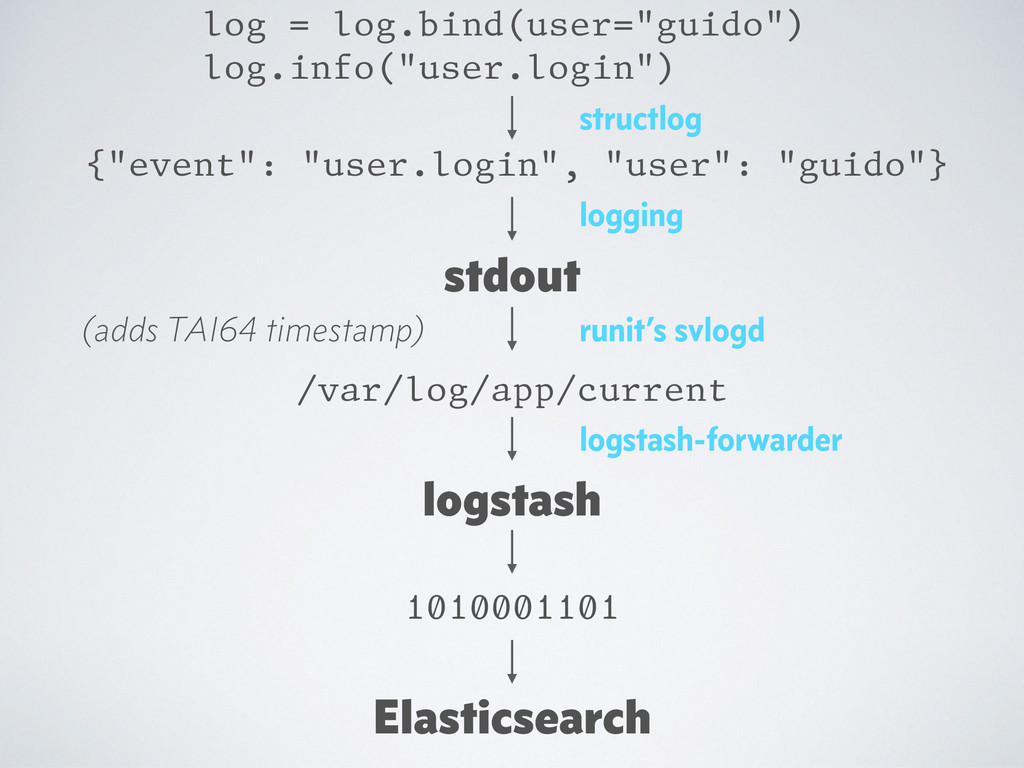
log = log.bind(user="guido") log.info("user.login")
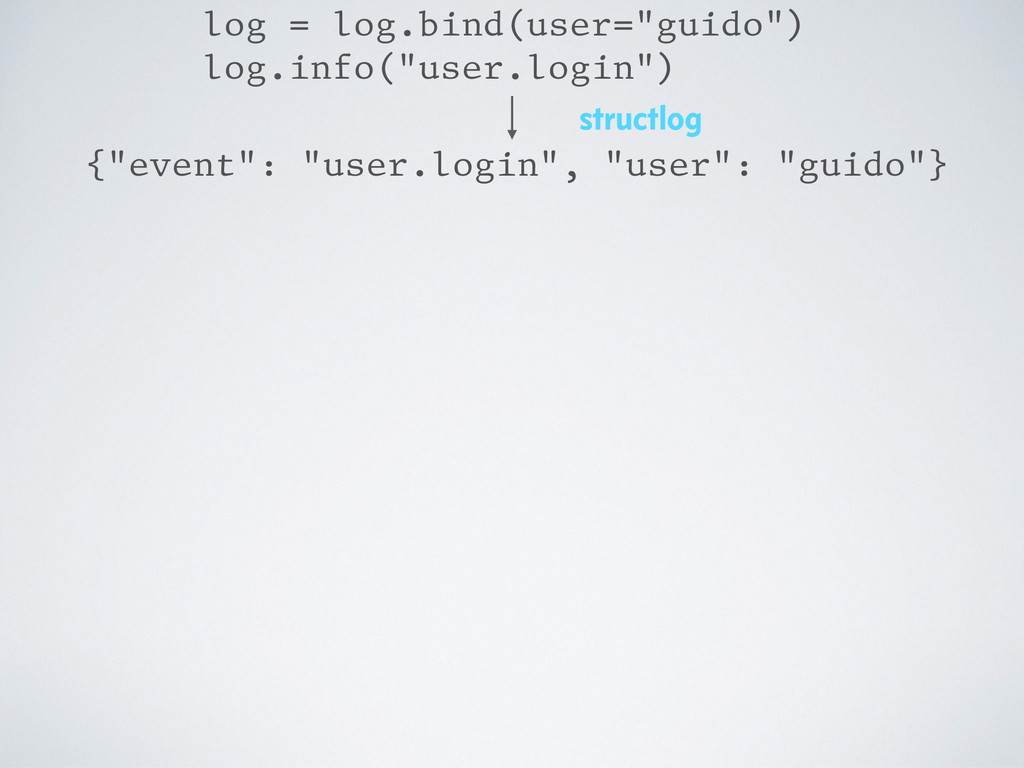
{"event": "user.login", "user": "guido"} log = log.bind(user="guido") log.info("user.login") structlog
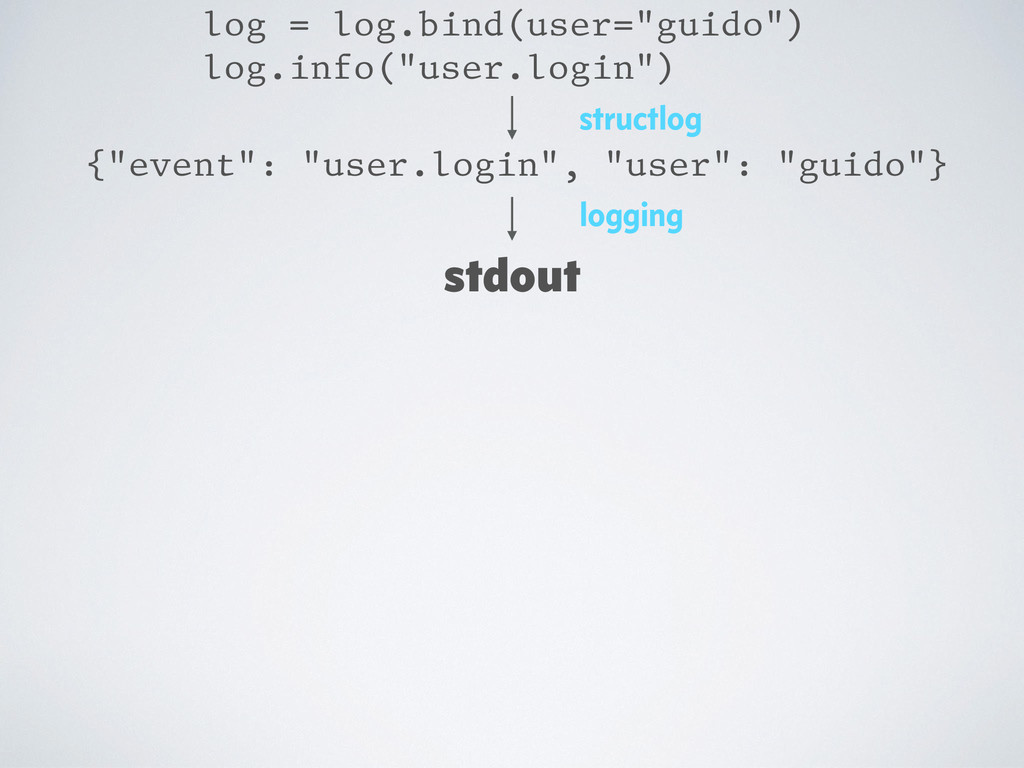
{"event": "user.login", "user": "guido"} log = log.bind(user="guido") log.info("user.login") structlog stdout
logging
{"event": "user.login", "user": "guido"} log = log.bind(user="guido") log.info("user.login") structlog stdout
logging /var/log/app/current runit’s svlogd (adds TAI64 timestamp)
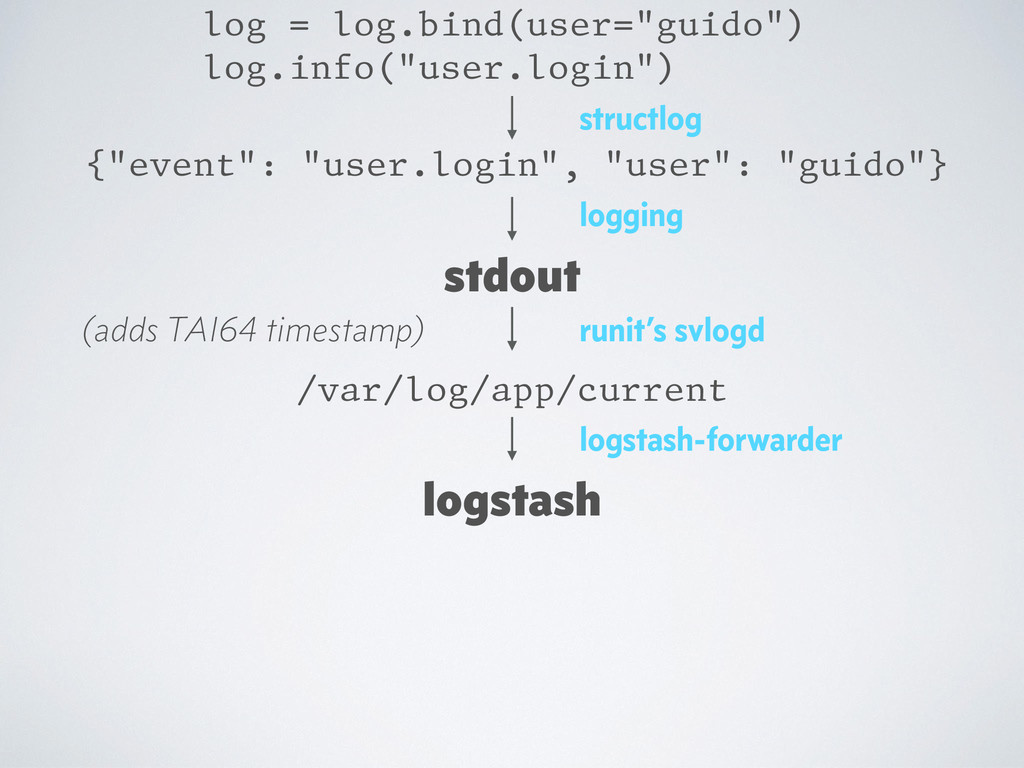
{"event": "user.login", "user": "guido"} log = log.bind(user="guido") log.info("user.login") structlog logstash-forwarder
logstash stdout logging /var/log/app/current runit’s svlogd (adds TAI64 timestamp)
{"event": "user.login", "user": "guido"} log = log.bind(user="guido") log.info("user.login") structlog logstash-forwarder
logstash 1010001101 Elasticsearch stdout logging /var/log/app/current runit’s svlogd (adds TAI64 timestamp)
Progress! ✓ ✓
Progress! ✓ ✓ ✓
Wait a Minute…
Wait a Minute…
Ugh try: STATS.time.timing(): something() except Exception as e: log.error("omg", exc_info=e)
raven_client.captureError() STATS.errors.mark()
Ugh try: STATS.time.timing(): something() except Exception as e: log.error("omg", exc_info=e)
raven_client.captureError() STATS.errors.mark()
Awww try: something() except Exception as e: log.exception("omg")
Errors
Errors • logging integration
Errors • logging integration • structlog
Errors • logging integration • structlog • web apps: error
views
Error View @view_config(context=Exception) def err(exc, request): return Response( "oops: "
+ raven_client.captureException() )
None
Metrics measure from outside
WSGI Servers
WSGI Servers • gunicorn: --statsd-host <host>
WSGI Servers • gunicorn: --statsd-host <host> • uWSGI:
WSGI Servers • gunicorn: --statsd-host <host> • uWSGI: • --stats-push
statsd:<host>
WSGI Servers • gunicorn: --statsd-host <host> • uWSGI: • --stats-push
statsd:<host> • --carbon <host>
Middleware def timing_tween_factory(handler, registry): def timing_tween(request): with STATS.request_time.time(): return handler(request)
return timing_tween
Middleware def timing_tween_factory(handler, registry): def timing_tween(request): with STATS.request_time.time(): return handler(request)
return timing_tween
Extract from Logs
Extract from Logs logstash
Extract from Logs logstash • StatsD
Extract from Logs logstash • StatsD • Graphite
Extract from Logs logstash • StatsD • Graphite • librato
Extract from Logs logstash • StatsD • Graphite • librato
• …
Extract from Logs logstash • StatsD • Graphite • librato
• … or structlog
Leverage Monitoring
Remaining
Remaining 1. measure code paths
Remaining 1. measure code paths 2. expose gauges
Summary
Summary
Summary
Summary
Summary
ox.cx/b @hynek vrmd.de