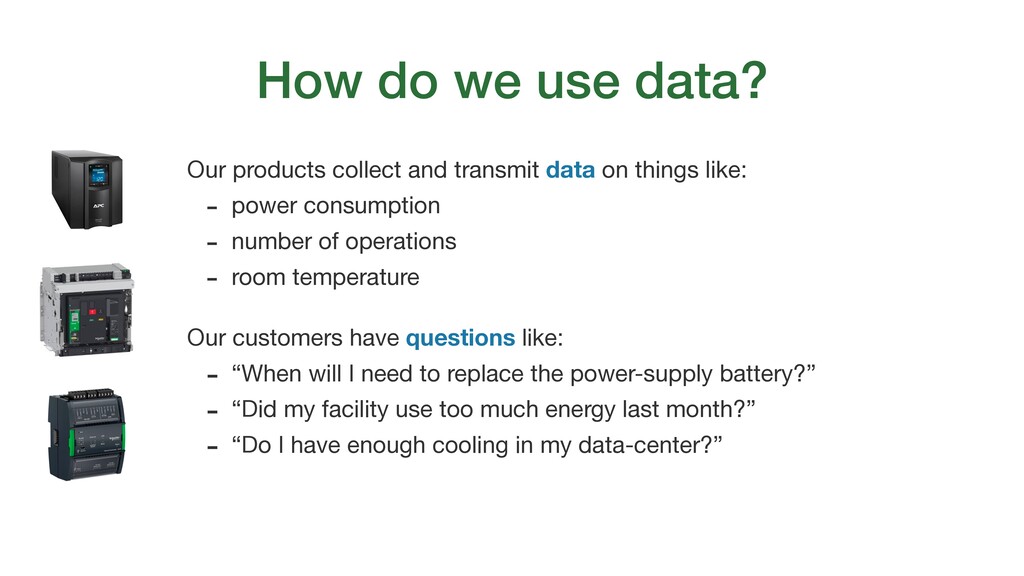
data on things like: - power consumption - number of operations - room temperature Our customers have questions like: - “When will I need to replace the power-supply battery?” - “Did my facility use too much energy last month?” - “Do I have enough cooling in my data-center?”
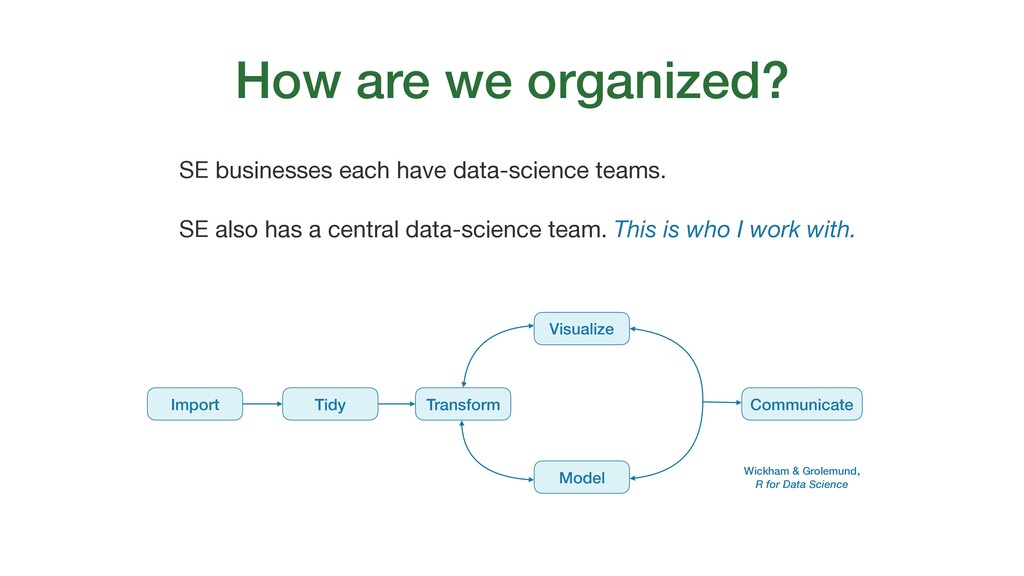
central data-science team. This is who I work with. Import Tidy Transform Visualize Model Communicate Wickham & Grolemund, R for Data Science How are we organized?
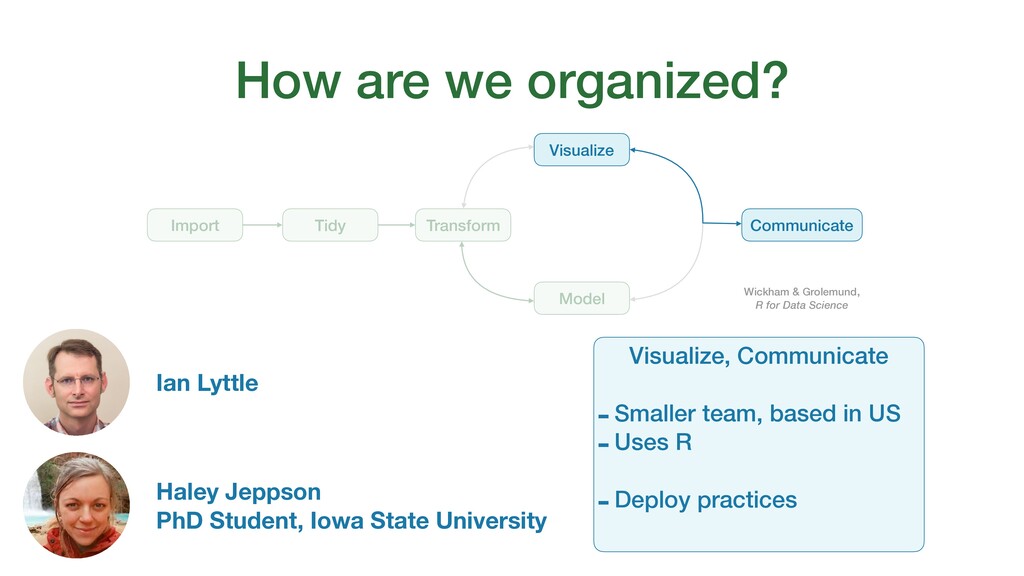
Wickham & Grolemund, R for Data Science Import, Tidy, Transform, Model -Larger team, based in France -Uses Python -Deploy models and data as web services https://exchange.se.com/develop Visualize, Communicate -Smaller team, based in US -Uses R -Deploy practices
Wickham & Grolemund, R for Data Science Visualize, Communicate -Smaller team, based in US -Uses R -Deploy practices Ian Lyttle Haley Jeppson PhD Student, Iowa State University
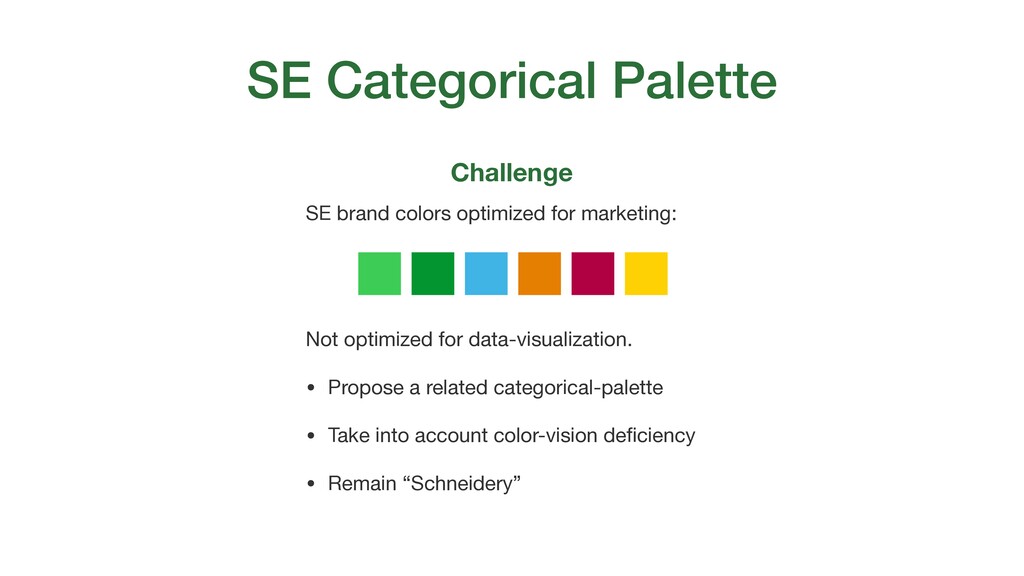
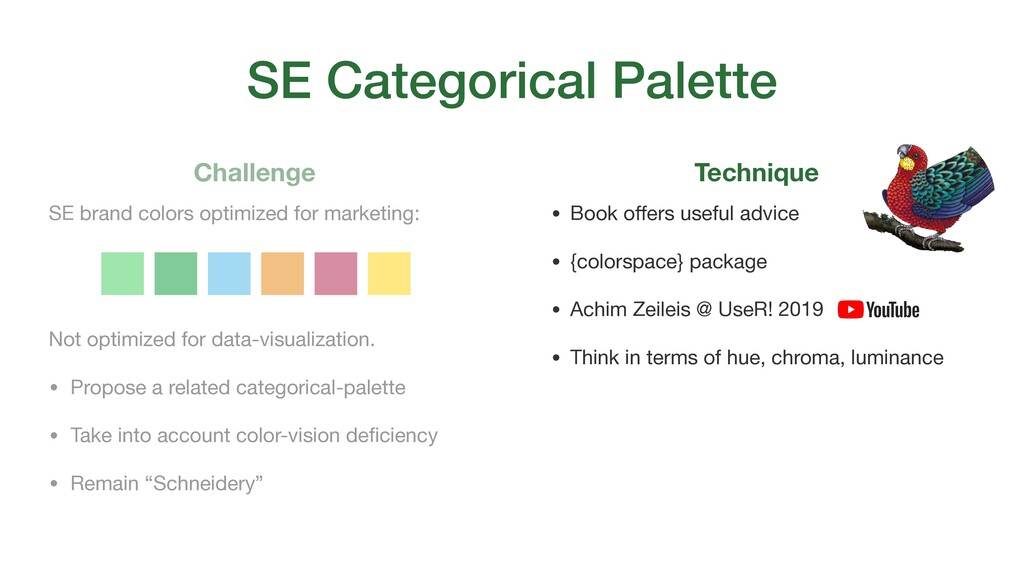
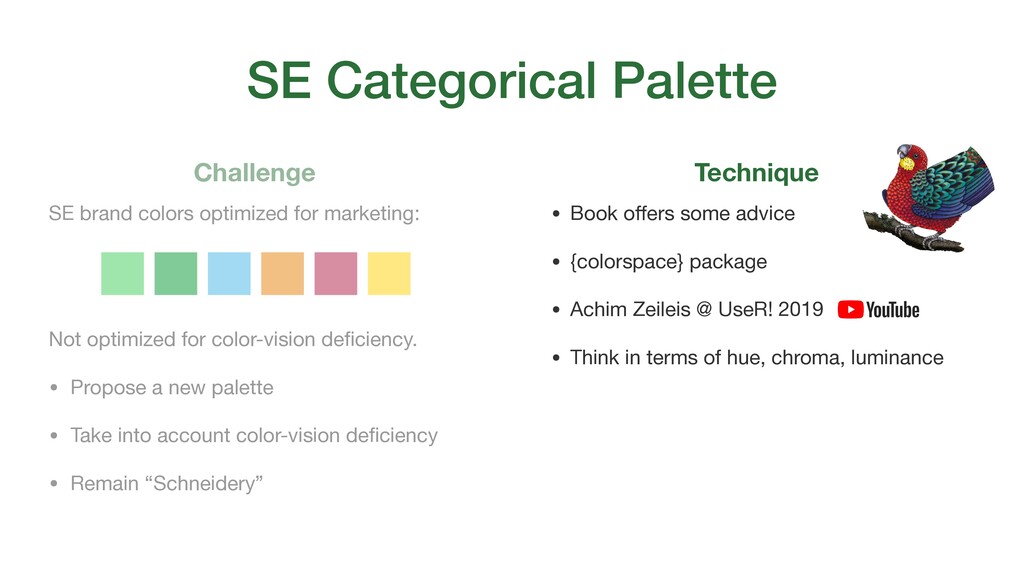
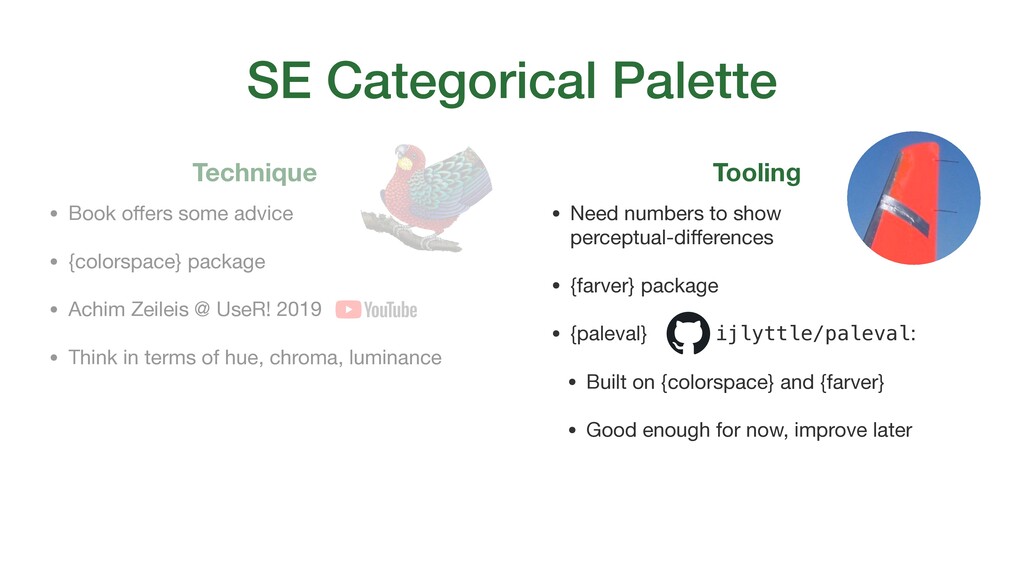
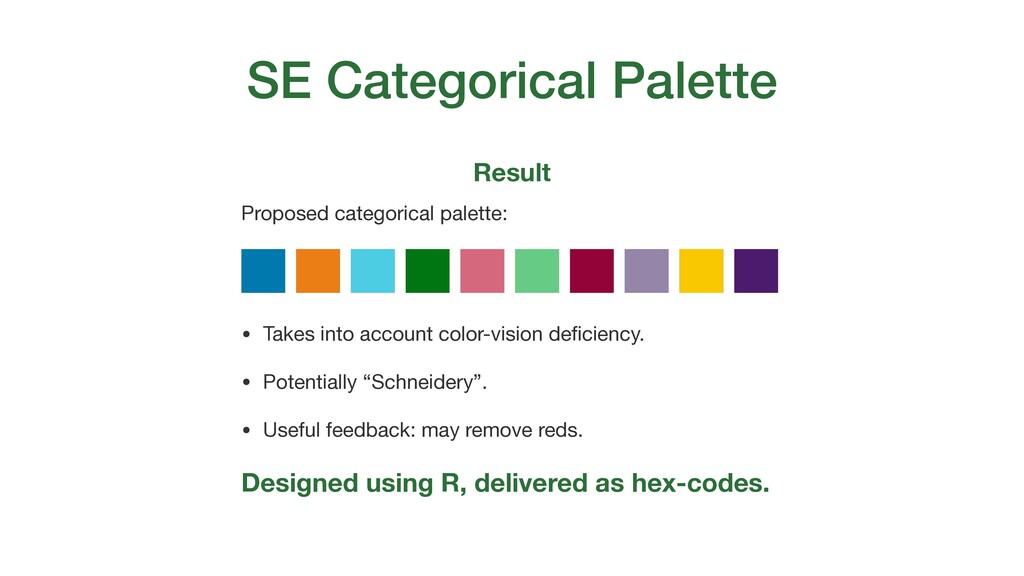
optimized for color-vision deficiency. • Propose a new palette • Take into account color-vision deficiency • Remain “Schneidery” Challenge Technique • Book offers some advice • {colorspace} package • Achim Zeileis @ UseR! 2019 • Think in terms of hue, chroma, luminance
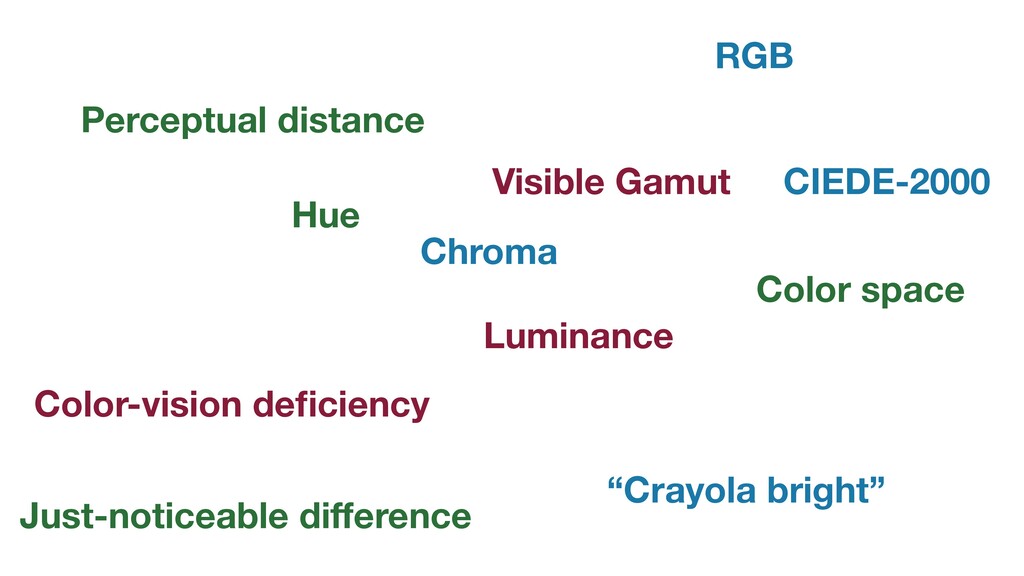
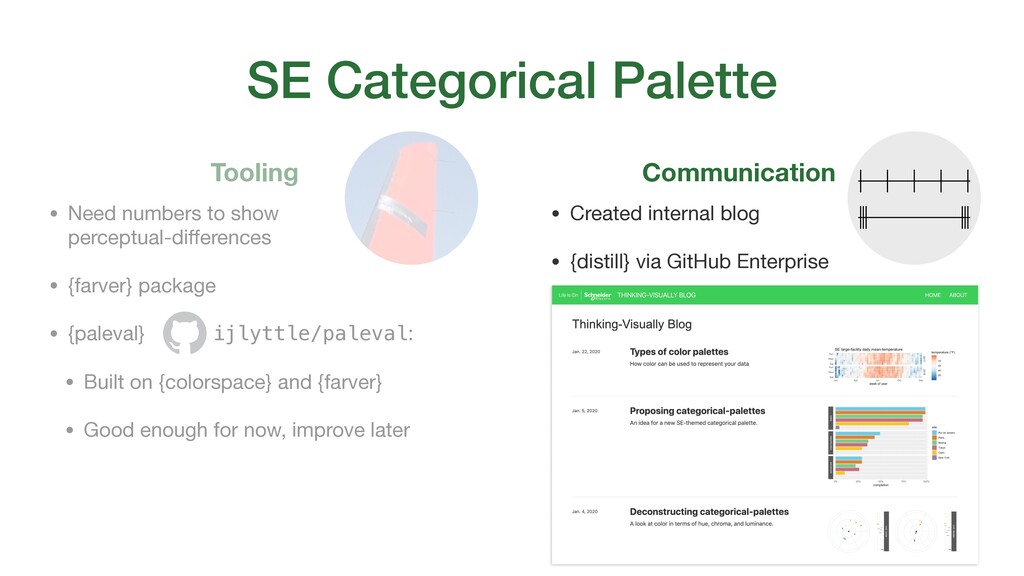
{colorspace} package • Achim Zeileis @ UseR! 2019 • Think in terms of hue, chroma, luminance • Need numbers to show perceptual-differences • {farver} package • {paleval} ijlyttle/paleval: • Built on {colorspace} and {farver} • Good enough for now, improve later Tooling
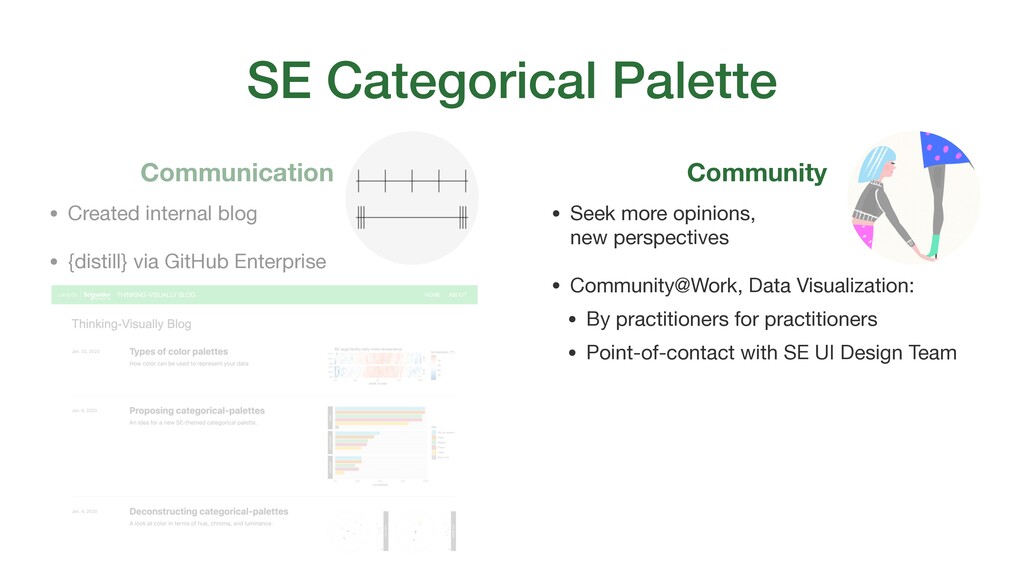
{farver} package • {paleval} ijlyttle/paleval: • Built on {colorspace} and {farver} • Good enough for now, improve later Tooling • Created internal blog • {distill} via GitHub Enterprise Communication
Community@Work, Data Visualization: • By practitioners for practitioners • Point-of-contact with SE UI Design Team Community • Created internal blog • {distill} via GitHub Enterprise Communication