Upgrade to Pro — share decks privately, control downloads, hide ads and more …

The J&K Bank by iqbalwani

Avatar for iqbalwani2 iqbalwani2
December 01, 2014

The J&K Bank by iqbalwani

Major Project on J&K Bank

Avatar for iqbalwani2

iqbalwani2

December 01, 2014
Tweet

Other Decks in Education

Transcript

  1. Analysis of Working Capital in Banking (J&K) SUBMITTED IN PARTIAL

    FULFILMENT OF Degree of Bachelor of Business Administration (2013-2014) Submitted by:Mohd Iqbal Wani PRATAP UNIVERSITY JAIPUR TO
  2. CONTENTS Chapter Acknowledgement Declaration Executive Summary Research statement Objective &

    Methodology Chapter-1 Introduction to the Organization i. Overview of the Industry ii. Profile of the Organization iii. Product & Services of J & K Bank Chapter-2 Conceptual Discussions i. Introduction to Working Capital ii. Method of Working Capital Finance iii. Classification of Working Capital iv. Managing of Working Capital Chapter-3 Financial of Working Capital of J&K Bank Chapter-4 Analysis of Working Capital of J&K Bank i) Ratio Analysis ii) Funds Flow Analysis iii) Budgeting Summary, Conclusion, Suggestion and Limitation and References & Bibliography
  3. ACKNOWLEDGEMENT achieve any goal. These must be awarded by guidance,

    assistance and co- operation of many people to make it enable. And I am thankful to God that I got them all. I am extremely grateful and remain indebted to my guide Mr. For his invaluable guidance and constant support throughout this project. I am I am even grateful to the employees of J&K Bank for supporting me towards making this study meaningful. Finally I acknowledge with deep gratitude, the immense support I received from my family and friends who have encouraged me, have been a source of inspiration and helped me in continuing my effort. This project was a great source of learning and value addition for me. thankful to his for valuable suggestions, which have benefited me a lot while developing this project. Concentration, dedication and application are necessary but not sufficient to
  4. The project on “Jammu & Kashmir Bank” is exclusively done

    by me at J&K Bank, NowgamBranch, Srinagar and I assure that it is not submitted in any other institute. Mohd Iqbal Wani BBA (3rdYear) STUDENT DECLARATION
  5. Executive Summary I did my summer training programmed in J&K

    Bank. My project was based on the procedure of “ANALYSIS OF WORKING CAPITAL IN INDIAN BANKING”. I got the exposure of banking sector which is a very important sector of the Indian economy. The sector has made a marked improvement in the liberalization period. The Jammu and Kashmir Bank Limited was incorporated on 1st October, 1938 and commenced its business from 4th July, 1939 at in Kashmir (India). The Bank was the first in the country as a State owned bank. According to the extended Central laws of the state, Jammu & Kashmir Bank was defined as a government. Company as per the provision of Indian companies‟ act 1956.In the year 1971, the Bank received the status of scheduled bank. It was declared as “A” Class bank by RBI in 1976. Today the bank has more than 500 branches across the country and has recently become a billion Dollar company. The total business turnover at the end of December 2012 was Rs 79000 Crores, an increase of 21.5% over the previous fiscal year. The Net Profit of the bank almost doubled during the said period as it increased from Rs 309 Crores to nearly Rs 600 Crores. Notably, Mustaq Ahmad, who is known as prudent banker having almost 40 years of experience at his back, was appointed chairman and chief executive officer of the bank in October 2010.Soon after assuming the charge; he revisited certain business areas of the bank and renewed the strategy for achieving solid growth in the fundamentals of the bank. My project is concerned with Working Capital in Indian banking. Firstly I would like to give an introduction to working capital- Working capital is critical for daily management of cash flows to settle bills, wages and other variable cost. The working capital cycle is the period of time which elapses between the point at which cash begins to be expended on the production of a product and the collection of cash from sale of the product to its customers. Working capital requirements can be financed from both internally generated resources (selling current assets) and externally acquired alternatives (borrowing and securing current assets). In the Indian context of banking, a major
  6. part of the working capital requirements are met by bank

    credit. As critical part of this project report is three cases of working capital has been taken which are comprehensive enough to cover all the aspects of working capital.
  7. Research Statement How management of Working Capital does take place

    in corporate banking? Objective of the study The study will try to achieve the following aims:  To understand meaning of working capital in terms of RBI guidelines.  To study different ways of classification of working capital.  To study how working capital affects overall profitability of banks.  To study RBI guidelines on sale or purchase of working capital.  To analyze current trend of working capital in banking context.  To understand finance to the working capital. Methodology The study includes descriptive research and based on the secondary data. Sources of data Entire information is collected through a secondary source i.e. through a data, which have been gathered for some other purposes. Some of the sources of secondary data are;  Books on working capital and handbook on banking information etc.  Information collected from various sites on internet.  Articles from Magazines like Business World, Financial Express etc.  Information collected from J&K Bank staff at G.K.1 New Delhi.  Information collected from investerWords.com.
  8. 1.1 OVERVIEW OF THE INDUSTRY AS A WHOLE Banking in

    India The economic reforms undertaken in the last 15 years have brought about a considerable improvement in the health of banks and financial institutions in India. The banking sector is a very important sector of the Indian economy. The sector has made marked improvements in the liberalization period. There has been extraordinary progress in the financial health of the commercial banks with respect to capital adequacy, profitability assets quality and risk management. Deregulation has opened new doors for banks to increase revenues by entering into to investment banking, insurance, credit cards, depository services, mortgage, securitization etc. Currently, banking in India is generally fairly mature in terms of supply, product range and reach even through reach in rural India still remains a challenge for the private sector and foreign banks. In terms of quality of assets and capital adequacy, Indian banks are considered to have clean, strong and transparent balance sheet relative to other banks in comparable economies in its region. The Reserve Bank of India is an autonomous body, with minimal pressure from the government. The stated policy of the bank of Indian Rupee is to manage volatility but without any fixed exchange rate and this has mostly been true. With the growth in the Indian economy expected to be strong for quite some time especially in its services sector the demand for banking services are expected to be strong. In March 2006, the Reserve Bank of India allowed Warburg Pincus to increase its stake in Kotak Mahindra Bank (a private sector bank) to 10%. This is the first time an investor has been allowed to hold more than 5% in a private sector bank since the RBI announced norms in 2005 that any stake exceeding 5% in the private sector banks would need to be vetted by them. Currently, India has 96 scheduled commercial banks (SCBs) 31 private sector banks and 27 are public sector banks and 38 foreign banks. They have a combined network of over 53000 branches and 49000 ATMs. According to a report by ICRA Limited, a rating agency, the
  9. public sector banks hold over 75 percent of total assets

    of the banking industry with the private and foreign banks holding 18.2% and 6.5% is just say. Liberalization and globalization have created a more challenging environment in banking sector as well as the other segments of the financial sector such as mutual funds, non-banking finance companies, post offices, capital market, venture capitalist etc. Now the challenge faced by the sector would be gaining profitability, reinforcing technology, maintaining global standards, corporate governance, risk management and the most important of all, to establish customer intimacy. 1.2 PROFILE OF THE ORGANISATION Brief History of the Bank Jammu and Kashmir Bank Limited was incorporated on 1st October, 1938 and commenced its business from 4th July 1939 at in Kashmir (India). The bank was the first in the country as a state owned bank. “In my opinion the bank should be an organ of public interest and not an instrument for the government or the shareholders to achieve their own end.” (Maharaja Hari Singh) According to the extended central laws of the state, Jammu and Kashmir Bank was defined as a government company as per the provision of Indian companies act 1956. In the year 1971, the bank received the status of scheduled bank. It was declared as “A” class bank by RBI in 1976.
  10. Today the bank has more than 500 branches across the

    country and has recently become a billion dollar company. o Incorporated in 1938 as a limited company. o Governed by the companies act and banking regulation bank of India. o Regulated by the Reserve Bank of India and SEBI. o Listed on the NSE and BSE. o 53 percent owned by the government of J&K. Unique characteristics of the bank o Private sector bank deposit government holding 53 percent of equity. o Sole banker and lender of last resort to the government of J&K. o Plan and non-plan fund, taxes and non-taxes revenues routed through the bank. o Salaries of government officials disbursed by the Bank. Mission Statement: “Our mission is two- fold: To provide the people of J&K international quality financial service and solutions and to be a super specialist bank in the rest of the country. The two together will makes the most profitable bank in the country.”
  11. Vision Statement: “To catalyze economic transformation and capitalize on growth.”

    Board of Directors of J&K Bank Mushtaq Ahmad (Chairman and CEO) Past Performance o The bank has delivered a strong performance in 2011. o The bank strategy of consolidation re-engineering, re-pricing and re-organization has resulted in productive and efficient growth, robust balance sheet top notch assets book and substantial provision. o The bank aggregate business crossed yet another psychological mark and stood Rs70869.57 crores at the end of financial year 2010-2011. o The bank total business increased by Rs 10575.18 crores from the previous figure of 60294.39 Crores, registering a growth of 17.54%. o The bank continued its prudent approach in expanding quality credit assets in line with its policy on credit risk management. Its net advance increased by Rs 3136.41 Crores. o The Bank‟s performance in the recovery of NPAs during the year continued to be good. o Investment portfolio increased by Rs 5,739.52 Crores from 13956.25 and 19695.77 as on 2011. o The Bank has earned an income of Rs 26.14 crores from the Insurance business. In life insurance mobilized a business of Rs 103.02 crores and in non-life segment Rs 59.36 crores was mobilized during the year.
  12. o The gross profit for the financial year 2010-11 stood

    at Rs 1149.49 crores. o The highest ever net profit of Rs 615.2 crores. Area Branches Metro 39 Urban 168 Semi-Urban 118 Rural 223 Total 548 Future Planning and Turnover To build a global brand we need to do two things- go global physically and second more importantly, have a unique business model product offering and services standards, all of which are globally recognized. We have taken initial step to achieve the first. As of today, after the state government. Our second largest shareholders are foreign institutional investors with a combined stake of almost 36%. The total turnover increased 60294.39 crores to 70869.57 is 10575.18 crores. This growth is registered of 17.54%.
  13. 1.3 Products and Services Financial Products o Personal finance o

    Specialized finance o Agriculture and Allied Finances o Business Loan o Micro finance. Deposit Products o Savings Banks Account o Current Deposit o Term Deposit. o Depositors Pension Technology based financial service o Anywhere Banking o Internet Banking o ATM Services o Debit and Credit Cards o Merchant acquiring Depository services o Dematerializations o Stock broking Services through investment o Depository Participant of NSDL and CDSL.
  14. Constituents of Current assets 1) Cash at bank 2) Cash

    in hand 3) Bills receivables 4) Sundry debtors 5) Inventories of stock as; a) Raw material b) Work in progress c) Stores and spares d) Finished goods 6) Temporary investment of surplus fund 7) Prepaid expenses 8) Accrued income 9) Marketable securities
  15. Method of Working Capital There are four methods of financing

    working capital gap. In order to explain the methods we took an example of projected financial results of ABC traders this is as follows: (Resin Lacks) Liabilities Amount Assets Amount Capital 4.00 Fixed Assets 1.00 Unsecured Loans 2.00 Cash in hand 1.25 Sundry Creditors 3.25 Stocks 10.00 C/C Limit 10.00 Sundry Debtors 7.00 Total 19.25 Total 19.25
  16. Sales : Rs 60 Laces Purchases : Rs 59.15 Lacs

    Cost of Sales :Rs 60 Lacs Gross Profit : Rs 4 Lacs Net Profit : Rs 1.5 Lacs CA : Rs 18.25 Lacs (Assets which are realizable within one year) CL : Rs 13.25 Lacs (Liabilities which are payable within one year) NWC = CA-CL =5.00 Lacs Current Ratio = CA/CL =18.25/13.25 = 1.37:1
  17. Holding Periods: Stocks = stock*365/Cost of Sales = 65 Days

    Debtors = Debtors*365/Sales = 43 Days Creditors = Creditors*365/Purchases = 20 Days A. Traditional Method Particulars Holding Periods Amount Margin% Margin Amt MPBF Stocks 65 10 25 2.5 7.5 Sundry Debtors 43 7 50 3.5 3.5
  18. Working Expenses 0.25 100 0.25 Nil Total 17.25 6.25 11

    Less Creditors 20 3025 Amount Sectioned 7075 Deficit in NWC = Rs 2.25 Lacs B. First Method of Finance S.No. Particulars Holding Period Amount A Current Assets Stock 65 10 S. Debtors 43 7 Others 0.25 Total 17.25 B Current Liabilities S. Creditors 20 3.25
  19. Others Nil Nil Total 3.25 C. Working Capital Gap A-B

    14.00 D. Stipulated margin @ 25% in SSI and 40 % in trading units of “A” 4.31 E. Projected NWC 4.00 F. MPBF C-(D or E whichever is higher) 9.69
  20. C. Second Method of Finance S. No. Particulars Holding Period

    Amount A. Current Assets Stock in Trade 65 Days 10.00 S. Debtors 43 Days 7.00 Others 0.25 Total 17.25 B. Current Liabilities S. Creditors 20 days 3.25 Others Nil Total 3.25 C. Working Capital Gap (A-B) 14.00 D. Stipulated Margin @ 25% 25% of WCG 3.50 E. Projected NWC 4.00 F. MPBF C-(D or E whichever is higher) 10.00
  21. D. Turnover Method S. No. Particulars Amount A. Accepted sales

    60.00 Lacs B. Working Capital Requirement @ 25% of A 15.00 Lacs C. Margin @ 5% of A 3.00 Lacs D. Projected NWC 4.00 Lacs E. Permissible Limit = B-( C or D whichever is higher) 11.00 Lacs
  22. Balance Sheet of Jammu and Kashmir Bank ------------------- in Rs.

    Cr. ------------------- Mar '11 Mar '10 Mar '09 Mar '08 Mar '07 12 mths 12 mths 12 mths 12 mths 12 mths Capital and Liabilities: Total Share Capital 48.49 48.49 48.49 48.49 48.49 Equity Share Capital 48.49 48.49 48.49 48.49 48.49 Share Application Money 0.00 0.00 0.00 28.10 0.00 Preference Share Capital 0.00 0.00 0.00 0.00 0.00 Reserves 3,430.19 2,961.97 2,574.37 2,232.34 1,960.24 Revaluation Reserves 0.00 0.00 0.00 0.00 0.00 Net Worth 3,478.68 3,010.46 2,622.86 2,308.93 2,008.73 Deposits 44,675.94 37,237.16 33,004.10 28,593.26 25,194.2 Borrowings 1,104.65 1,100.21 996.63 751.79 620.19 Total Debt 45,780.59 38,337.37 34,000.73 29,345.05 25,814.4 Other Liabilities & Provisions 1,248.88 1,198.97 1,069.67 1,102.02 823.31 Total Liabilities 50,508.15 42,546.80 37,693.26 32,756.00 28,646.5 Mar '11 Mar '10 Mar '09 Mar '08 Mar '07 12 mths 12 mths 12 mths 12 mths 12 mths Assets Cash & Balances with RBI 2,974.96 2,744.73 2,302.95 3,219.97 1,854.77 Balance with Banks, Money at Call 573.85 1,869.51 2,971.81 1,217.27 1,758.99 Advances 26,193.64 23,057.23 20,930.41 18,882.61 17,079.9
  23. Investments 19,695.77 13,956.25 10,736.33 8,757.66 7,392.19 Gross Block 788.10 561.35

    517.90 471.32 433.63 Accumulated Depreciation 396.47 358.54 321.61 289.10 256.94 Net Block 391.63 202.81 196.29 182.22 176.69 Capital Work In Progress 2.13 1.32 3.13 9.79 6.76 Other Assets 676.17 714.95 552.34 486.47 377.19 Total Assets 50,508.15 42,546.80 37,693.26 32,755.99 28,646.5 Contingent Liabilities 18,189.26 8,291.77 6,578.22 7,959.21 1,844.39 Bills for collection 8,790.08 3,799.74 3,502.74 3,933.76 1,996.48 Book Value (Rs) 717.58 621.00 541.04 470.49 414.36
  24. Financials of J&K Bank (B/S as on 2010-011) PARTICULARS AMOUNT(2010)

    AMOUNT(2011) Capital and liabilities Capital 484,922 484,922 Reserve and Surplus 34,301,946 29,619,706 Deposit 446,759,350 372,371,604 Borrowings 11,046,502 11,002,064 Other liabilities and provision 12,488,814 11,989,652 TOTAL 505,081,534 425,467,948 ASSETS Cash and balance with RBI 29,749,638 27,447,263 Balance with Banks 5,738,477 18,695,109 Investment 196,957,679 139,562,473 Advances 261,936,350 230,572,250 Fixed Assets 3,937,702 2,041,332 Other assets 6,761,688 7,149,521 TOTAL 505,081,534 425,467,948 Contingent liabilities 255,176,641 114,992,485 BALANCE SHEET AS ON 31ST March 2009-2010
  25. PARTICULARS AMOUNT AS ON 31ST MARCH 2009 („000‟omitted) AMOUNT AS

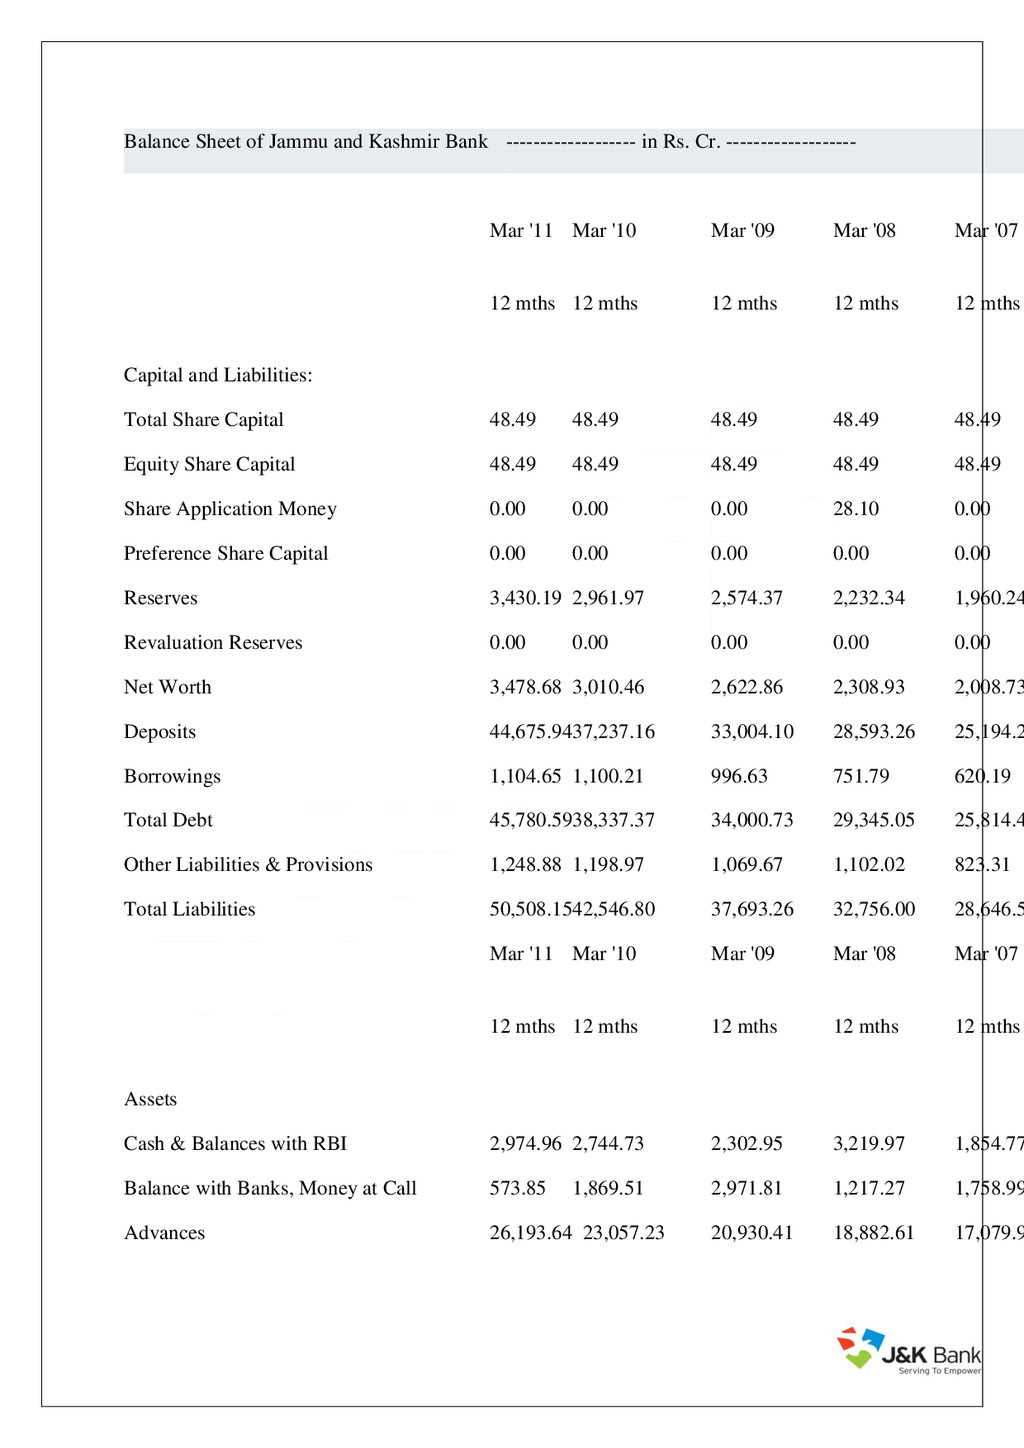
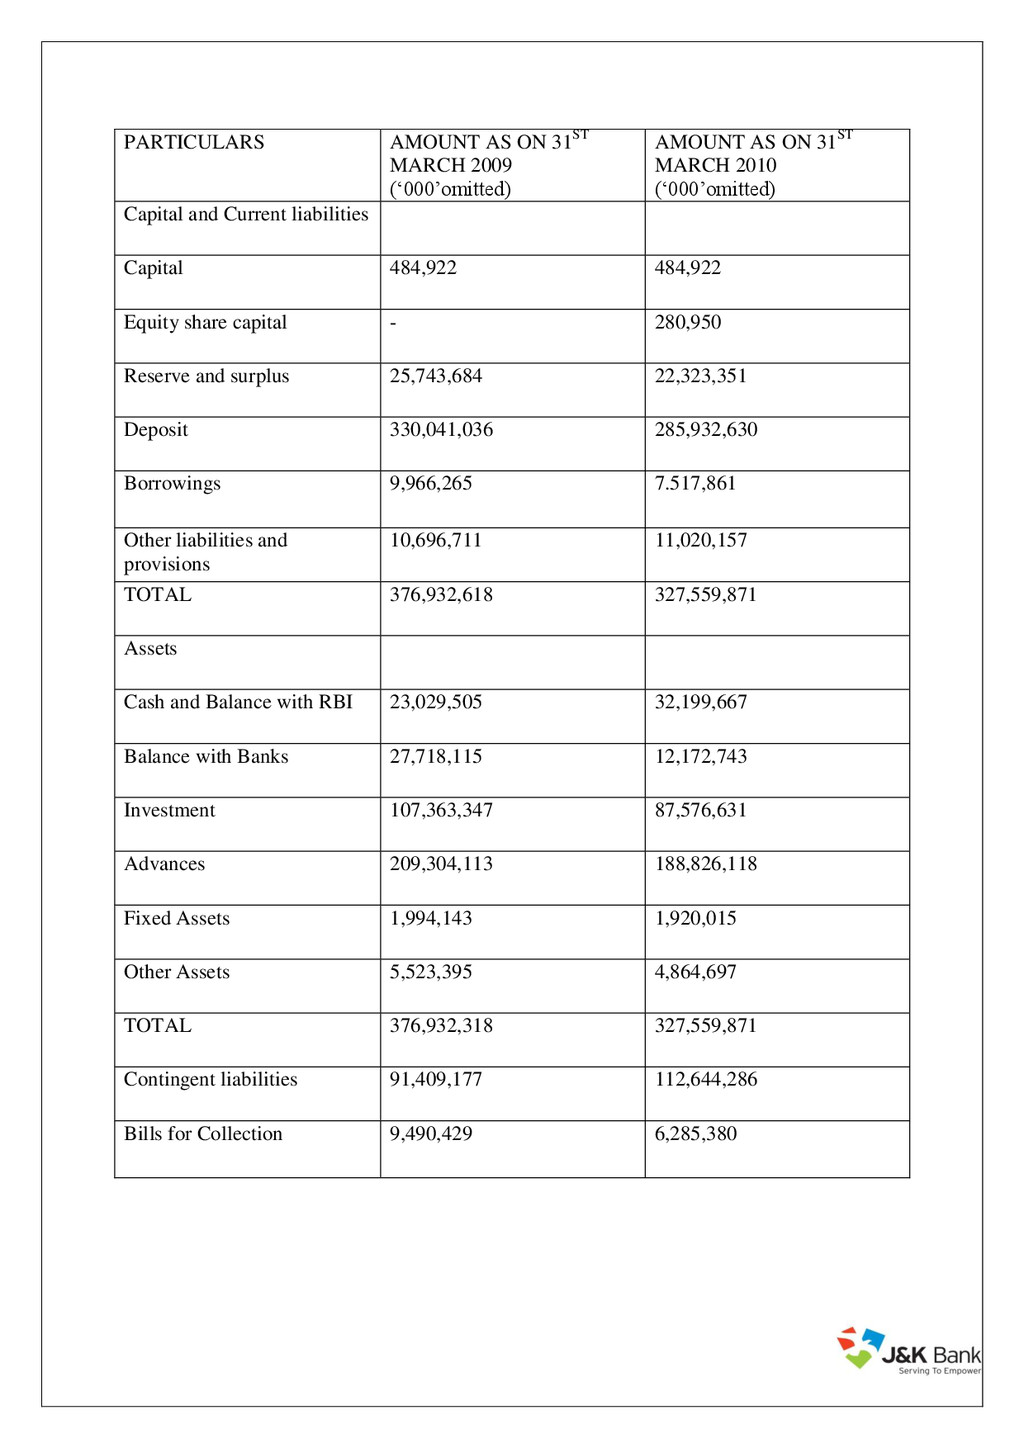
    ON 31ST MARCH 2010 („000‟omitted) Capital and Current liabilities Capital 484,922 484,922 Equity share capital - 280,950 Reserve and surplus 25,743,684 22,323,351 Deposit 330,041,036 285,932,630 Borrowings 9,966,265 7.517,861 Other liabilities and provisions 10,696,711 11,020,157 TOTAL 376,932,618 327,559,871 Assets Cash and Balance with RBI 23,029,505 32,199,667 Balance with Banks 27,718,115 12,172,743 Investment 107,363,347 87,576,631 Advances 209,304,113 188,826,118 Fixed Assets 1,994,143 1,920,015 Other Assets 5,523,395 4,864,697 TOTAL 376,932,318 327,559,871 Contingent liabilities 91,409,177 112,644,286 Bills for Collection 9,490,429 6,285,380
  26. ANALYSIS OF WORKING CAPITAL The analysis of working capital can

    be conducted through a number of devices, such as: 1. Ratio analysis. 2. Fund flow analysis. 3. Budgeting. 1. RATIO ANALYSIS A ratio is a simple arithmetical expression one number to another. The technique of ratio analysis can be employed for measuring short-term liquidity or working capital position of a firm. The following ratios can be calculated for these purposes: 1. Current ratio. 2. Quick ratio 3. Gross Profit Ratio 4. Fixed Assets turnover ratio 5. Receivables turnover. 6. Payable turnover ratio. 7. Working capital turnover ratio. 8. Net Profit Ratio 9. Ratio of current liabilities to tangible net worth. 10. Total assets turnover ratio. 2. FUND FLOW ANALYSIS Fund flow analysis is a technical device designated to the study the source from which additional funds were derived and the use to which these sources were put. The funds flow analysis consists of a. Preparing schedule of changes of working capital b. Statement of sources and application of funds.
  27. It is an effective management tool to study the changes

    in financial position (working capital) business enterprise between beginning and ending of the financial dates. 3. WORKING CAPITAL BUDGETING A budget is a financial and / or quantitative expression of business plans and polices to be pursued in the future period time. Working capital budget as a part of the total budge ting process of a business is prepared estimating future long term and short term working capital needs and sources to finance them, and then comparing the budgeted figures with actual performance for calculating the variances, if any, so that corrective actions may be taken in future. He objective working capital budget is to ensure availability of funds as and needed, and to ensure effective utilization of these resources. The successful implementation of working capital budget involves the preparing of separate budget for each element of working capital, such as, cash, inventories and receivables etc.
  28. Calculation of Ratios 1. Current Ratio: - Current ratio is

    calculated by current assets upon current liabilities. It measures short term paying ability of the firm. Year 2009 2010 2011 Current Assets 37371.65 42343.9 50116.52 Current Liabilities 36623.6 41347.8 49259.3 Current Ratio 1.02 1.02 1.01 Significance: - An ideal current ratio is 2:1. This ratio is used for short term paying ability of the firm. Approximate of 1 of current ratio the creditors will be able to get their payment in full. 2. Quick Ratio: - This ratio is also known as liquid ratio. It measures short term paying ability by measuring short term liquidity. Year 2009 2010 2011 Liquid assets 37371.65 42343.9 50116.52 Current liabilities 36623.6 41347.8 49259.3 Liquid Ratio 1.024 1.02 1.01 . Significance: - This ratio is able to payment for its creditors. This ideal figure is 1.
  29. 3. Gross profit ratio: - Gross profit ratio indicates the

    efficiency of the production or operation of trading. It expresses relation between gross profit and net sales. G.P. Ratio= Gross profit/net sales* 100 Year 2009 2010 2011 Gross profit 774.45 958.21 1149.49 Net Sales 53934.51 60294.39 70869.57 G.P.R. 14.3% 15.8% 16.2% Significance:- This ratio indicates the degree to which the selling price of goods per unit may decline without resulting in losses from operations to the firm. If there is continuous increment in gross profit ratio then it means the selling price of goods is increasing day by day. 4. Net Profit Ratio: - Net profit ratio indicates efficiency of P&L A/C of the firm. It intends relation between net profit and net sales. Net Profit Ratio= N.P. /Net sales*100 Year 2009 2010 2011 Net Profit 409.84 512.38 615.2 Net sales 53934.51 60294.39 70869.57 N.P.R 7.5% 8.4% 8.6% \\Significance: - Net profit ratio indicates net margin on sales. This margin is continuously increasing year to year.
  30. 5. Fixed assets Turnover Ratio: - It indicates the investment

    in fixed assets has been judicious or not. It calculated by the following formula; FATOR = Net sales /Net fixed assets Net fixed assets = Fixed assets – depreciation Year 2009 2010 2011 Net sales 53934.51 60294.39 70869.57 Net fixed assets 1,994,1.43 3,937,7.02 1,920,0.15 FATOR 2.7 Times 1.53 Times 3.69 Times Significance: - It indicates the extent to which the investment in fixed assets contributes towards sales. It compared with the previous period, it indicates whether the investment in fixed assets has been judicious or not. 6. Working capital Turnover Ratio: - Working capital ratio is talking about utilization of working capital for the firm. Working capital turnover ratios express the relation between net sales and working capital. It is calculate by the following formula; WCTOR = Net Sales/Working capital Year 2009 2010 2011 Net Sales 53934.51 60294.39 70869.57 Working capital 37371.65 42343.9 50116.52 WCTOR 1.44 Times 1.42 Times 1.41 Times 7. Total assets turnover ratio: - Total assets turnover ratio intends to the total assets to total turnover. It indicates to efficiency of total assets and total turnover. This ratio is very important for estimate the position of the firm. This ratio is calculated by the following formula;
  31. TATOR = Total assets/total turnover Year 2009 2010 2011 Total

    assets 376,932,318 327,559,871 425,467,948 Turnover 53934.51 60294.39 70869.57 TATOR 69% 54% 60% Significance;- The Bank‟s aggregate business crossed yet another psychological mark and stood at ` 70,869.57 Crores at the end of the financial year 2010-11. The Bank‟s total business increased by ` 10,575.18 Crores from the previous year‟s figure of ` 60,294.39 Crores, registering a growth of 17.54% The above parameters are used for critical analysis of financial position. With the evaluation of each component, the financial position from different angles is tried to be presented in well and systematic manner. By critical analysis with the help of different tools, it becomes clear how the financial manager handles the finance matters in profitable manner in the critical challenging atmosphere, there commendation are made which would suggest the organization in formulation of a healthy and strong position financially with proper management system. I sincerely hope, through the evaluation of various percentage, ratios and comparative analysis, the organization would be able to conquer it‟s in efficiencies and makes the desired changes.
  32. ANALYSIS OF FINANCIAL STATEMENTS: Financial statement is a collection of

    data organized according to logical and consistent accounting procedure to convey an under-standing of some financial aspects of a business firm. It may show position at a moment in time, as in the case of balance sheet or may reveal a series of activities over a given period of time, as in the case of an income statement. Thus, the term „financial statements‟ generally refers to the two statements (1) The position statement or Balance sheet. (2) The income statement or the profit and loss Account. OBJECTIVES OF FINANCIAL STATEMENTS: According to accounting Principal Board of America (APB) states. The following objectives of financial statements: - 1. To provide reliable financial information about economic resources and obligation of a business firm. 2. To provide other needed information about charges in such economic resources and obligation. 3. To provide reliable information about change in net resources (recourses less obligations) missing out of business activities. 4. To provide financial information those assets in estimating the learning potential of the business. LIMITATIONS OF FINANCIAL STATEMENTS: Though financial statements are relevant and useful for a concern, still they do not present a final picture a final picture of a concern. The utility of these statements is dependent upon a number of factors. The analysis and interpretation of these statements must be done carefully otherwise misleading conclusion may be drawn. Financial statements suffer from the following limitations: - 1. Financial statements do not given a final picture of the concern. The data given in these statements is only approximate. The actual value can only be determined when the business is sold or liquidated.
  33. 2. Financial statements have been prepared for different accounting periods,

    generally one year, during the life of a concern. The costs and incomes are apportioned to different periods with a view to determine profits etc. The allocation of expenses and income depends upon the personal judgment of the accountant. The existence of contingent assets and liabilities also make the statements imprecise. So the financial statements are at the most interim reports rather than the final picture of the firm. 3. The financial statements are expressed in monetary value, so they appear to give final and accurate position. The value of fixed assets in the balance sheet neither represent the value for which fixed assets can be sold nor the amount which will be required to replace these assets. The balance sheet is prepared on the presumption of a going concern. The concern is expected to continue in future. So, the fixed assets are shown at cost less accumulated depreciation. Moreover, there are certain assets in the balance sheet which will realize nothing at the time of liquidation but they are shown in the balance sheets. 4. The financial statements are prepared on the basis of historical costs or original costs. The value of assets decreases with the passage of time current price changes are not taken into account. The statements are not prepared with the keeping in view the economic conditions. The balance sheet loses the significance of being an index of current economic realities. Similarly, the profitability shown by the income statements may be representing the earning capacity of the concern. 5. There are certain factors which have a bearing on the financial position and operating result of the business but they do not become a part of these statements because they cannot be measured in monetary terms. The basic limitation of the traditional financial statements comprising the balance sheet, profit & loss A/c is that they do not give all the information regarding the financial operation of the firm. Nevertheless, they provide some extremely useful information to the extent the balance sheet mirrors the financial position on a particular data in lines of the structure of the basis of assets, liabilities etc. and the profit & loss A/c shows the result of operation during a certain period in terms revenue obtained and cost incurred during the year.
  34. CONCLUSION Working capital may be regarded as the life blood

    of business. Working capital is of major importance to internal and external analysis because of its close relationship with the current day-to-day operations of a business. Every business needs funds for two purposes. * Long term funds are required to create production facilities through purchase of fixed assets such as plants, machineries, lands, buildings & etc * Short term funds are required for the purchase of raw materials, payment of wages, and other day-to-day expenses. . It is otherwise known as revolving or circulating capital It is nothing but the difference between current assets and current liabilities. i.e. Working Capital = Current Asset – Current Liability. Businesses use capital for construction, renovation, furniture, software, equipment, or machinery. It is also commonly used to purchase inventory, or to make payroll. Capital is also used often by businesses to put a down payment down on a piece of commercial real estate. Working capital is essential for any business to succeed. It is becoming increasingly important to have access to more working capital when we need it. Importance of Adequate Working Capital A business firm must maintain an adequate level of working capital in order to run its business smoothly. It is worthy to note that both excessive and inadequate working capital positions are harmful. Working capital is just like the heart of business. If it becomes weak, the business can hardly prosper and survive. No business can run successfully without an adequate amount of working capital. Danger of inadequate working capital When working capital is inadequate, a firm faces the following problems. Fixed Assets cannot efficiently and effectively be utilized on account of lack of sufficient working capital. Low liquidity position may lead to liquidation of firm. When a firm is unable to meets its debts at maturity, there is an unsound position. Credit worthiness of the
  35. firm may be damaged because of lack of liquidity. Thus

    it will lose its reputation. There by, a firm may not be able to get credit facilities. It may not be able to take advantages of cash discount. It is helpful for us, as a business owner, to think of working capital in terms of five components: 1. Cash and equivalents. This most liquid form of working capital requires constant supervision. A good cash budgeting and forecasting system provides answers to key questions such as: Is the cash level adequate to meet current expenses as they come due? What is the timing relationship between cash inflow and outflow? When will peak cash needs occur? When and how much bank borrowing will be needed to meet any cash shortfalls? When will repayment be expected and will the cash flow cover it? 2. Accounts receivable. Many businesses extend credit to their customers. If you do, is the amount of accounts receivable reasonable relative to sales? How rapidly are receivables being collected? Which customers are slow to pay and what should be done about them? 3. Inventory. Inventory is often as much as 50 percent of a firm's current assets, so naturally it requires continual scrutiny. Is the inventory level reasonable compared with sales and the nature of your business? What's the rate of inventory turnover compared with other companies in your type of business? 4. Accounts payable. Financing by suppliers is common in small business; it is one of the major sources of funds for entrepreneurs. Is the amount of money owed suppliers reasonable relative to what you purchase? What is your firm's payment policy doing to enhance or detract from your credit rating?
  36. 5. Accrued expenses and taxes payable. These are obligations of

    your company at any given time and represent a future outflow of cash.
  37. FINDINGS Ratio analysis can be used by financial executives to

    check upon the efficiency with which working capital is being used in the enterprise. The following are the important ratios to measure the efficiency of working capital. The following, easily calculated, ratios are important measures of working capital utilization. Ratio Formulae Result Interpretation ` Average Stock * 365/ Cost of Goods Sold = x days On average, you turn over the value of your entire stock every x days. You may need to break this down into product groups for effective stock management. Obsolete stock, slow moving lines will extend overall stock turnover days. Faster production, fewer product lines, just in time ordering will reduce average days. Receivables Ratio (in days) Debtors * 365/ Sales = x days It takes you on average x days to collect monies due to you. If you‟re official credit terms are 45 day and it takes you 65 days... why? One or more large or slow debts can drag out the average days. Effective debtor management will minimize the days. Payables Ratio (in days) Creditors * 365/ Cost of Sales (or Purchases) = x days On average, you pay your suppliers every x days. If you negotiate better credit terms this will increase. If you pay earlier, say, to get a discount this will decline. If you simply defer paying your suppliers (without agreement) this will also increase - but your reputation, the quality of service and any flexibility provided by your suppliers may suffer.
  38. Current Ratio Total Current Assets/ Total Current Liabilities = x

    times Current Assets are assets that you can readily turn in to cash or will do so within 12 months in the course of business. Current Liabilities are amount you are due to pay within the coming 12 months. For example, 1.5 times means that you should be able to lay your hands on $1.50 for every $1.00 you owe. Less than 1 time e.g. 0.75 means that you could have liquidity problems and be under pressure to generate sufficient cash to meet oncoming demands. Quick Ratio (Total Current Assets - Inventory)/ Total Current Liabilities = x times Similar to the Current Ratio but takes account of the fact that it may take time to convert inventory into cash. Working Capital Ratio (Inventory + Receivables - Payables)/ Sales As % Sales A high percentage means that working capital needs are high relative to your sales. Other working capital measures include the following: Bad debts expressed as a percentage of sales. Cost of bank loans, lines of credit, invoice discounting etc. Debtor concentration - degree of dependency on a limited number of customers. Once ratios have been established for our business, it is important to track them over time and to compare them with ratios for other comparable businesses or industry sectors.
  39. SUMMARY Cash flows in a cycle into, around and out

    of a business. It is the business's life blood and every manager's primary task is to help keep it flowing and to use the cash flow to generate profits. If a business is operating profitably, then it should, in theory, generate cash surpluses. If it doesn't generate surpluses, the business will eventually run out of cash and expire. The faster a business expands, the more cash it will need for working capital and investment. The cheapest and best sources of cash exist as working capital right within business. Good management of working capital will generate cash will help improve profits and reduce risks. Bear in mind that the cost of providing credit to customers and holding stocks can represent a substantial proportion of a firm's total profits. There are two elements in the business cycle that absorb cash - Inventory (stocks and work- in-progress) and Receivables (debtors owing you money). The main sources of cash are Payables (your creditors) and Equity and Loans. Each component of working capital (namely inventory, receivables and payables) has two dimensions ........TIME ......... and MONEY. When it comes to managing working capital - TIME IS MONEY. If you can get money to move faster around the cycle (e.g. collect monies due from debtors more quickly) or reduce the amount of money tied up (e.g. reduce inventory levels relative to sales), the business will generate more cash or it will need to borrow less money to fund working capital. As a consequence, you could reduce the cost of bank interest or you'll have additional free money available to support additional sales growth or investment. Similarly, if you can negotiate improved terms with suppliers e.g. get longer credit or an increased credit limit, you effectively create free finance to help fund future sales.
  40. CONCLUSION Any change in the working capital will have an

    effect on a business's cash flows. A positive change in working capital indicates that the business has paid out cash, for example in purchasing or converting inventory, paying creditors etc. Hence, an increase in working capital will have a negative effect on the business's cash holding. However, a negative change in working capital indicates lower funds to pay off short term liabilities (current liabilities), Therefore we can say that working capital plays a very important role in Corporate Banking. o Without working capital any business cannot run. The bank aggregate business crossed yet another psychological mark and stood Rs70869.57 crores at the end of financial year 2010-2011. o The bank total business increased by Rs 10575.18 crores from the previous figure of 60294.39 Crores, registering a growth of 17.54%. o The bank continued its prudent approach in expanding quality credit assets in line with its policy on credit risk management. Its net advance increased by Rs 3136.41 Crores. o The Bank‟s performance in the recovery of NPAs during the year continued to be good. o Investment portfolio increased by Rs 5,739.52 Crores from 13956.25 and 19695.77 as on 2011. o The Bank has earned an income of Rs 26.14 crores from the Insurance business. In life insurance mobilized a business of Rs 103.02 crores and in non-life segment Rs 59.36 crores was mobilized during the year. o The gross profit for the financial year 2010-11 stood at Rs 1149.49 crores. o The highest ever net profit of Rs 615.2 crores. which may have bad repercussions to the future of the company.
  41. SUGGESTION After a lot of research of working capital, I

    am able to say that there should be more liquid surplus for smooth running of any business. But under the corporate banking this is more prominent requirement. Because in banking, working capital is more exchangeable as compare other organization. When we provide term loan to our customer as per RBI guidelines. Loan can be short term or long term. Profitability of the bank is also affect by working capital. Generally, all things are affected by working capital under in a house. The J&K Bank is the only private sector bank in the country assigned with the responsibility of convening State Level Banker‟s Committee meetings. The bank continued to discharge its lead bank responsibility in 12 out of 22 districts of J&K State satisfactory.
  42. REFERENCES AND BIBLIOGRAPHY During the completion of this project work

    I have taken references from various sources which include:  Annual report of The Jammu and Kashmir Bank ltd.  Magazines such as Business Economics, Newspaper such as Greater Kashmir, Bank Dairy, Bank Catalogue, Bank magazine etc.  Yearly journals of the Jammu and Kashmir Bank Ltd.  Website of the bank; www.jkbank.net www.jkbank.com www.rbi.org.in  Circulars of J&K Bank