Upgrade to Pro — share decks privately, control downloads, hide ads and more …

ITT 2016 - Björn Rabenstein - Instrumenting Code for Modern Service Monitoring

ITT 2016 - Björn Rabenstein - Instrumenting Code for Modern Service Monitoring

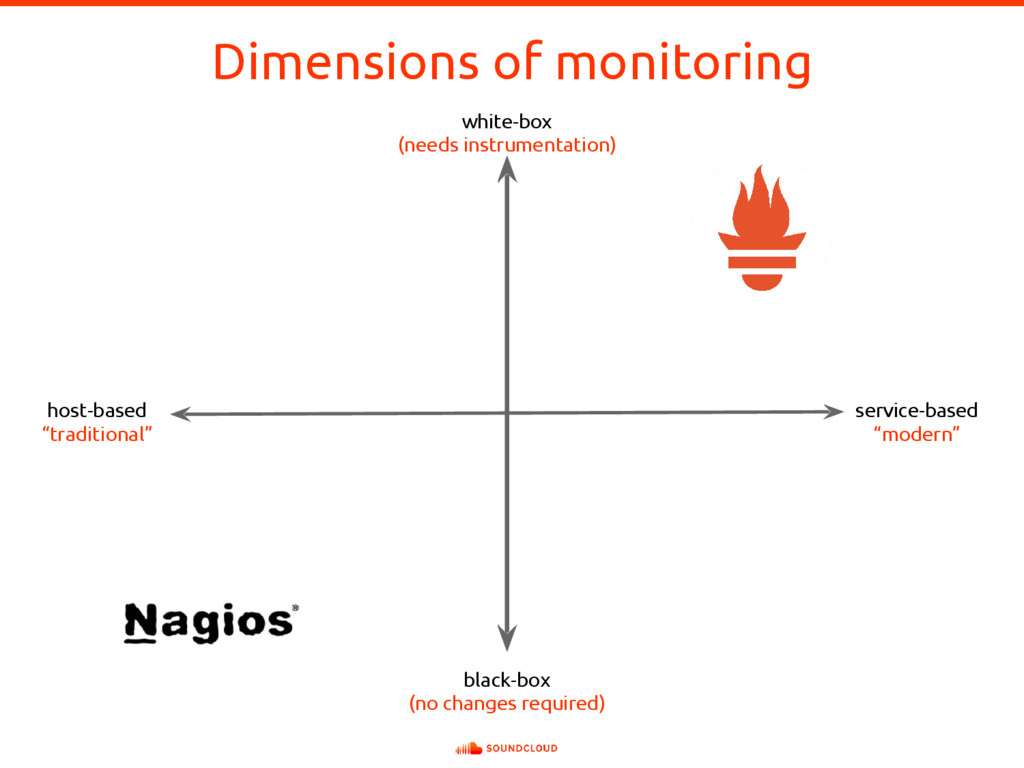
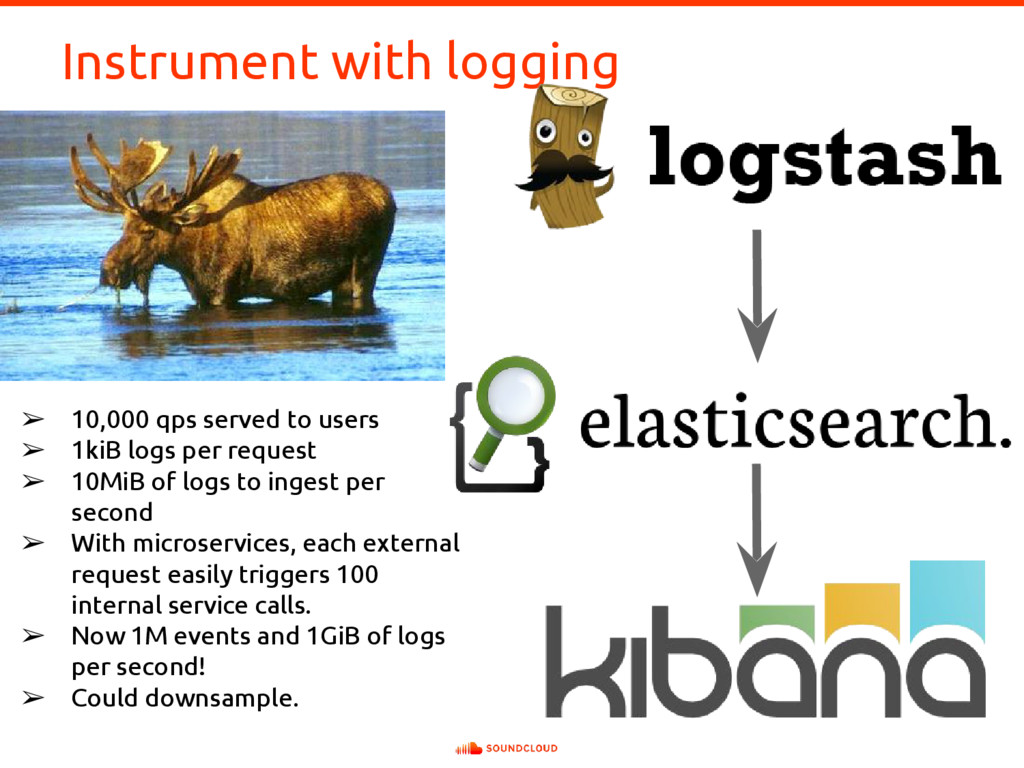
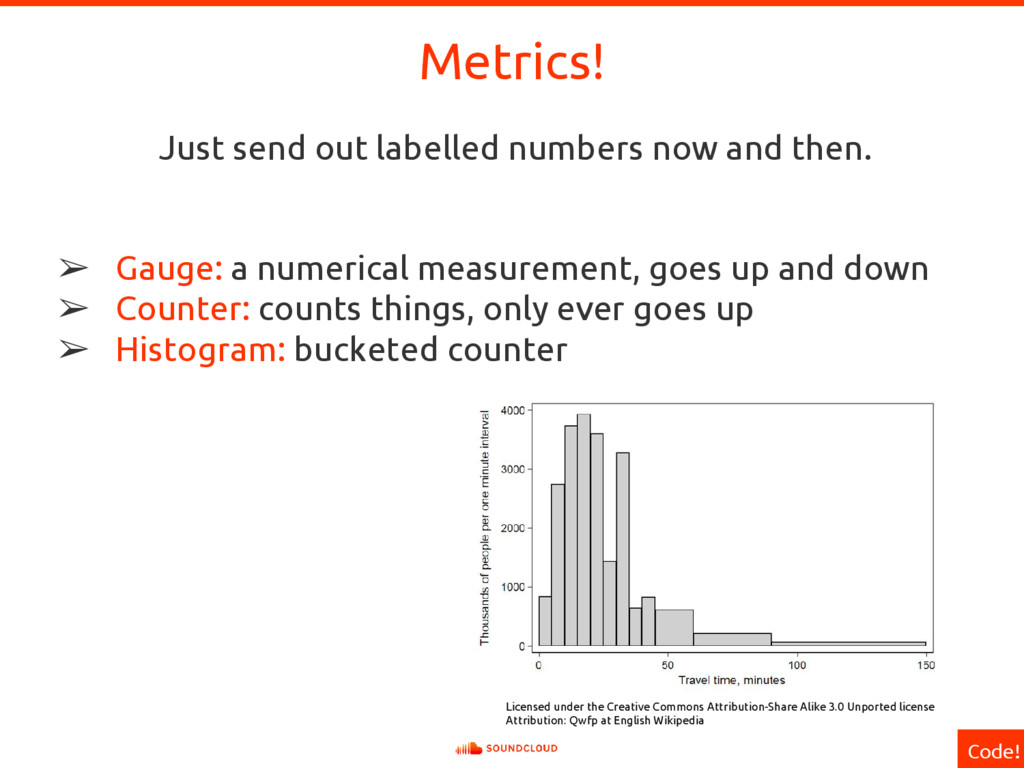
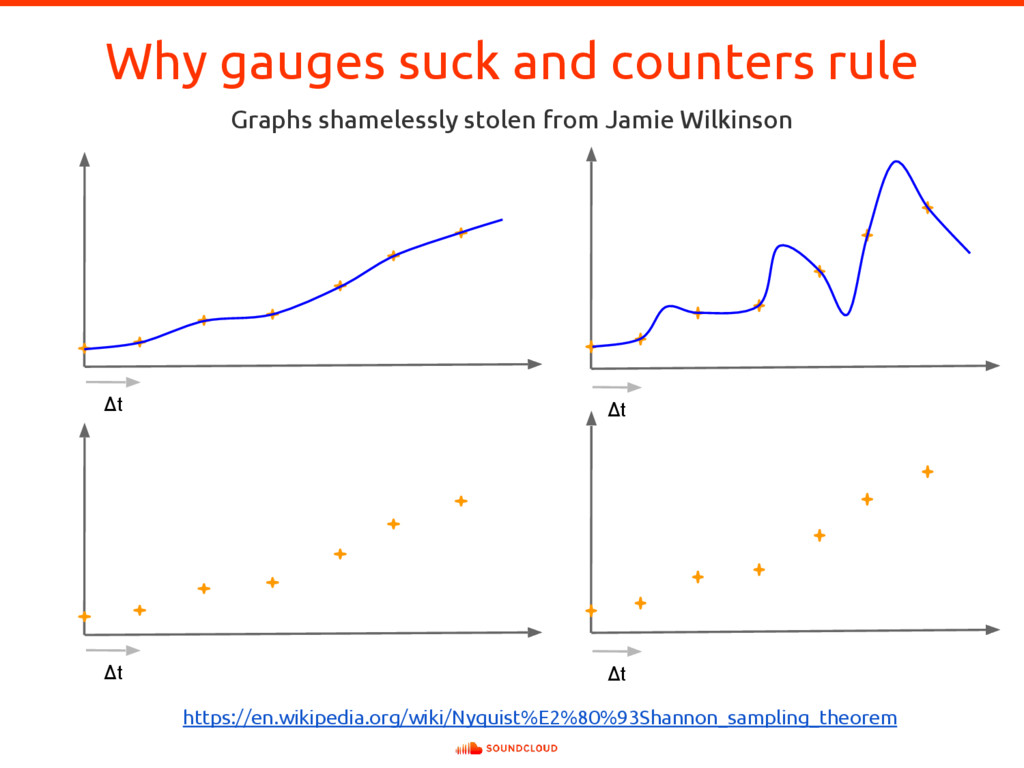
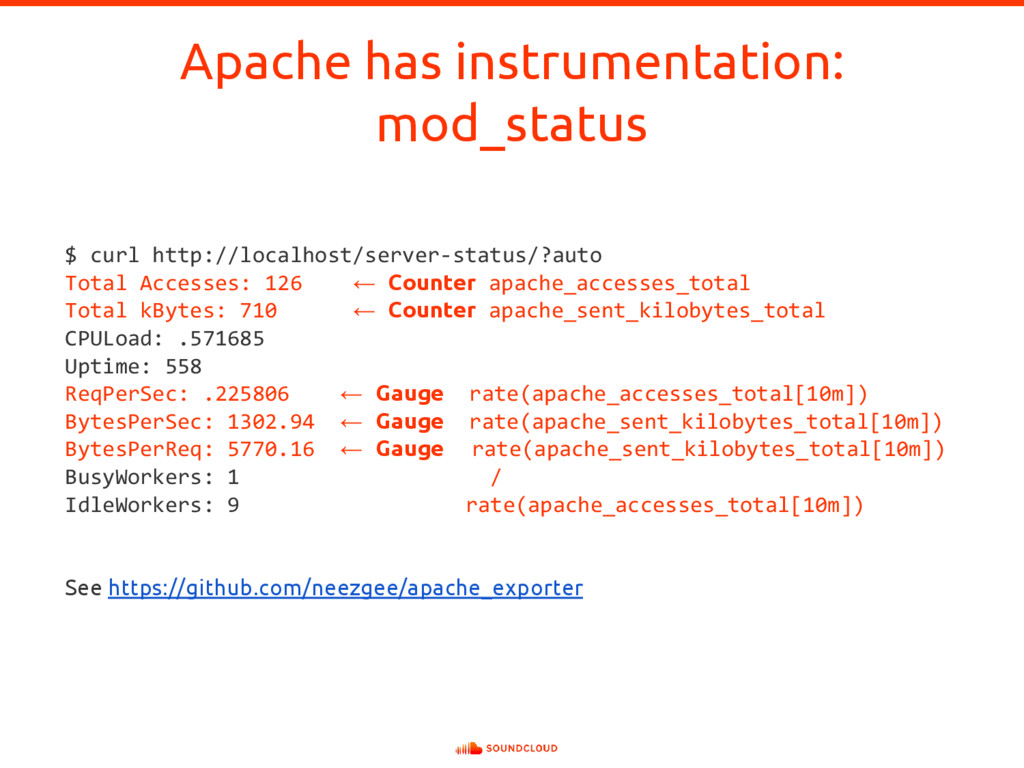
In complex and dynamic distributed systems, instrumenting application code to expose suitable metrics is of paramount importance for meaningful whitebox monitoring. But what are suitable metrics? In which ways are they useful? And how do they differ from logging? Using Prometheus as an example for a next-generation service monitoring system, all those questions will be answered. To put the learned lessons into action, Björn Rabenstein instruments a toy HTTP service on stage.

Istanbul Tech Talks

April 05, 2016
Tweet

More Decks by Istanbul Tech Talks

Other Decks in Programming

Transcript

  1. Instrumenting Code for Modern Service Monitoring Istanbul Tech Talks 2016-04-05

    Björn “Beorn” Rabenstein, Production Engineer, SoundCloud Ltd.
  2. …refers to an ability to monitor or measure the level

    of a product's performance, to diagnose errors and to write trace information. Programmers implement instrumentation in the form of code instructions that monitor specific components in a system (for example, instructions may output logging information to appear on screen). Instrumentation… (according to Wikipedia)
  3. Challenges of service-based monitoring Scale and semantics ➢ Need a

    fleet-wide 3,048m view. ◦ What’s my overall 99th percentile latency? ◦ How many qps am I serving on the /foo endpoint? ◦ What’s my error percentage serving from the US-East data center? ➢ Still need to be able to drill down for troubleshooting. ◦ Which instance causes those errors I’m seeing? ◦ How does the canary instance compare to the others in terms of resource usage and latency? ➢ Meaningful alerting. ◦ Symptom-based alerting for pages, cause-based alerting for warnings. ◦ See Rob Ewaschuk’s My philosophy on alerting https://goo.gl/2vrpSO
  4. Monitor everything On all levels. Ideally with the same system.

    Level What to monitor (examples) What exposes metrics (example) Host (OS, hardware) Hardware failure, provisioning, host resources. Node exporter Container Resource usage, performance characteristics. cAdvisor Application Latency, errors, qps, internal state. Your own code Orchestration Cluster resources, scheduling. Kubernetes components
  5. Instrument with logging ➢ 10,000 qps served to users ➢

    1kiB logs per request ➢ 10MiB of logs to ingest per second ➢ With microservices, each external request easily triggers 100 internal service calls. ➢ Now 1M events and 1GiB of logs per second! ➢ Could downsample.
  6. ➢ Gauge: a numerical measurement, goes up and down ➢

    Counter: counts things, only ever goes up ➢ Histogram: bucketed counter Metrics! Just send out labelled numbers now and then. Code! Licensed under the Creative Commons Attribution-Share Alike 3.0 Unported license Attribution: Qwfp at English Wikipedia
  7. Why gauges suck and counters rule Graphs shamelessly stolen from

    Jamie Wilkinson Δt Δt Δt Δt https://en.wikipedia.org/wiki/Nyquist%E2%80%93Shannon_sampling_theorem
  8. Apache has instrumentation: mod_status $ curl http://localhost/server-status/?auto Total Accesses: 126

    ← Counter apache_accesses_total Total kBytes: 710 ← Counter apache_sent_kilobytes_total CPULoad: .571685 Uptime: 558 ReqPerSec: .225806 ← Gauge rate(apache_accesses_total[10m]) BytesPerSec: 1302.94 ← Gauge rate(apache_sent_kilobytes_total[10m]) BytesPerReq: 5770.16 ← Gauge rate(apache_sent_kilobytes_total[10m]) BusyWorkers: 1 / IdleWorkers: 9 rate(apache_accesses_total[10m]) See https://github.com/neezgee/apache_exporter
  9. Collect metrics With Prometheus from… Level What to monitor (examples)

    What exposes metrics (example) Host (OS, hardware) Hardware failure, provisioning, host resources. Node exporter Container Resource usage, performance characteristics. cAdvisor Application Latency, errors, qps, internal state. Your own code Orchestration Cluster resources, scheduling. Kubernetes components