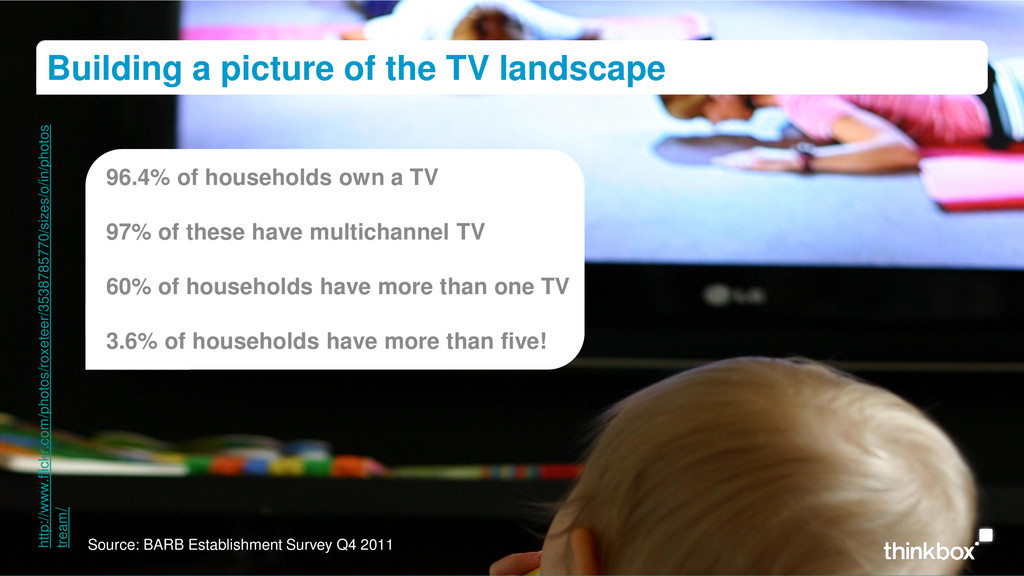
households own a TV 97% of these have multichannel TV 60% of households have more than one TV 3.6% of households have more than five! Building a picture of the TV landscape
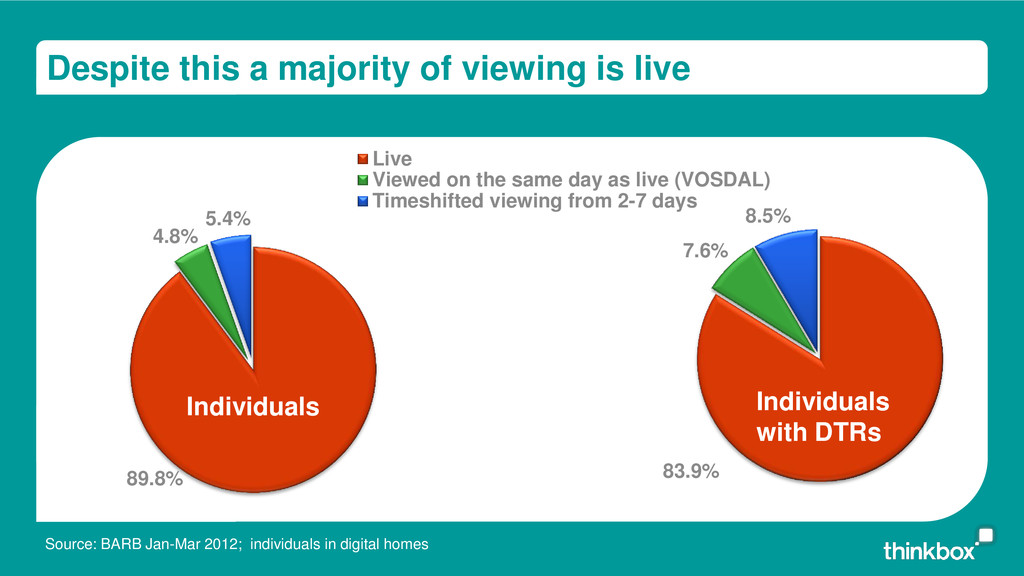
Individuals with DTRs 89.8% 4.8% 5.4% Live Viewed on the same day as live (VOSDAL) Timeshifted viewing from 2-7 days 83.9% 7.6% 8.5% Individuals Individuals with DTRs Source: BARB Jan-Mar 2012; individuals in digital homes
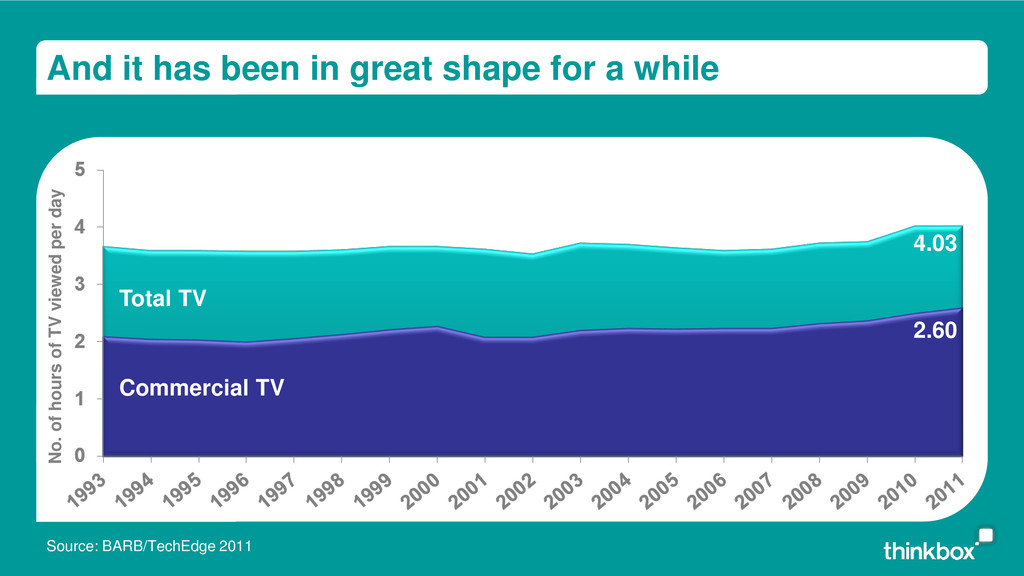
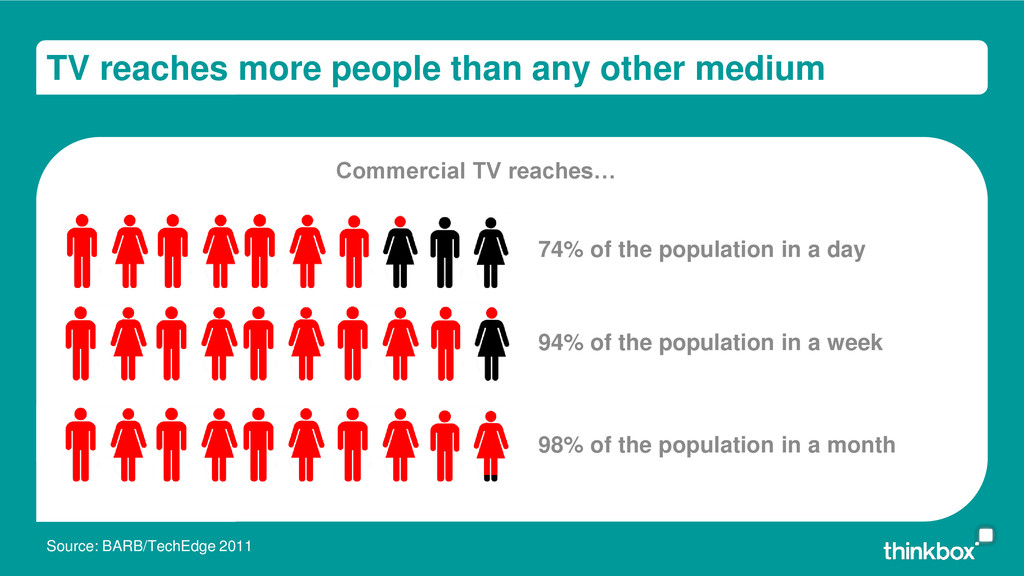
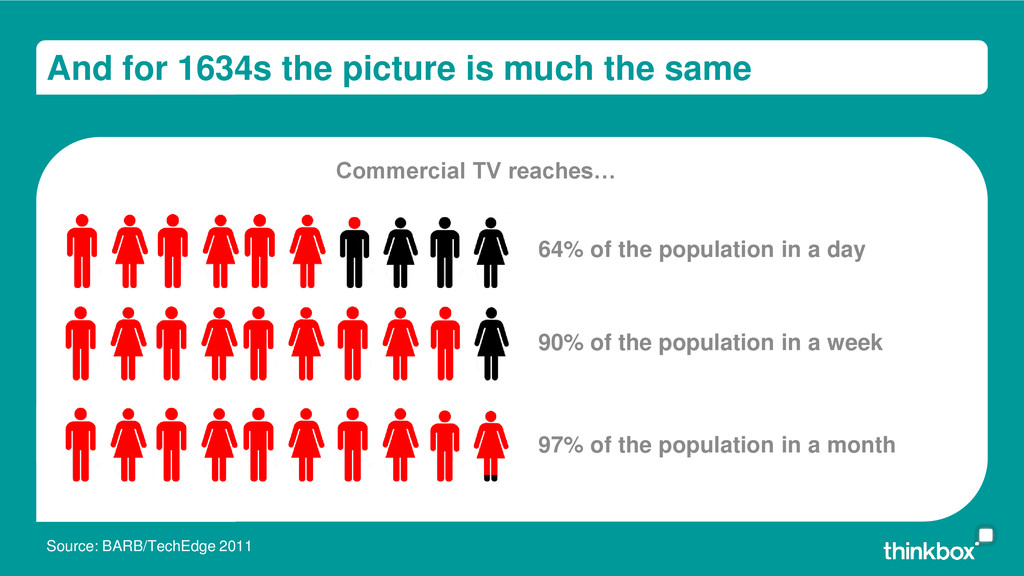
BARB/TechEdge 2011 Commercial TV Total TV 64% of the population in a day 90% of the population in a week 97% of the population in a month Commercial TV reaches…
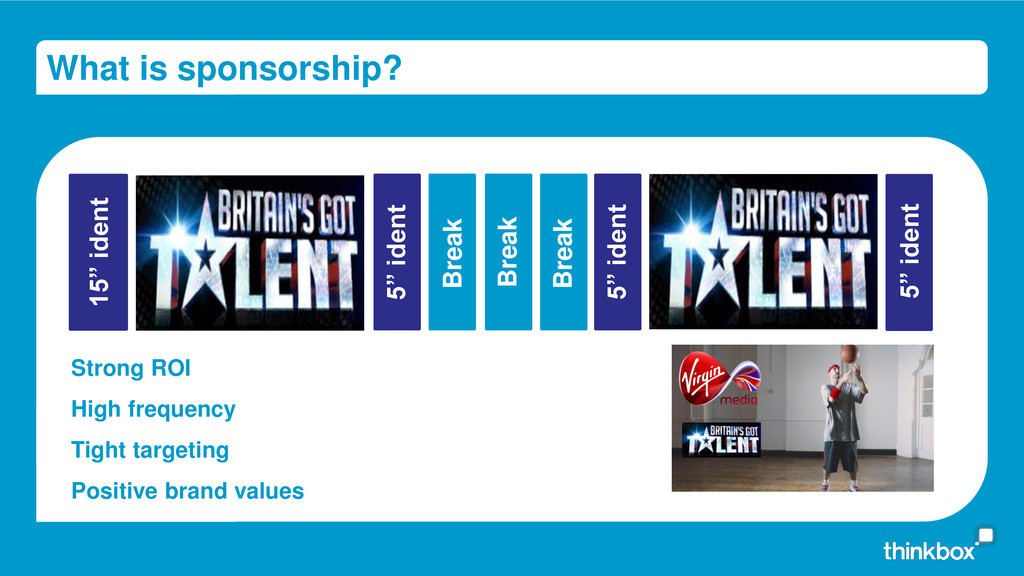
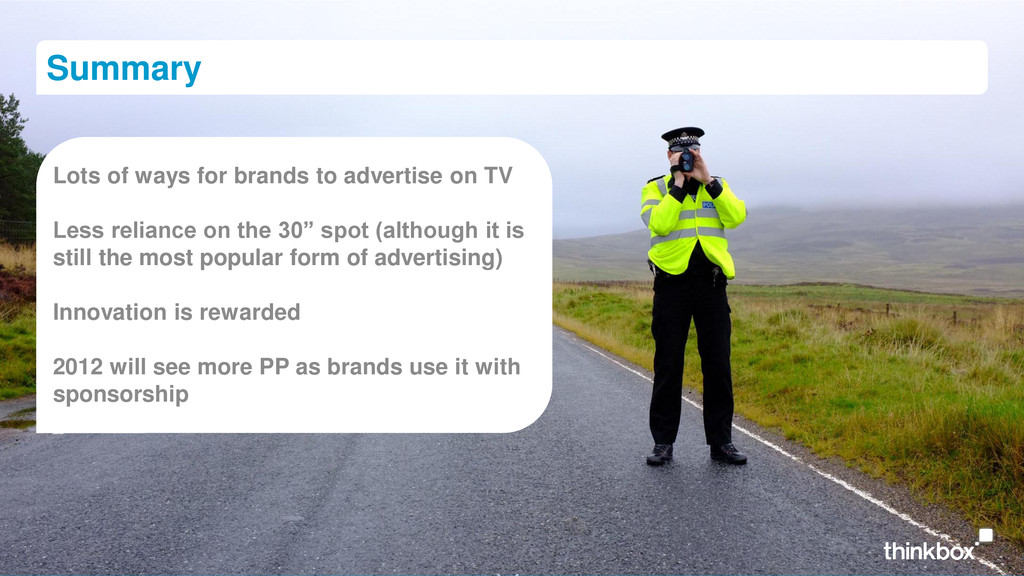
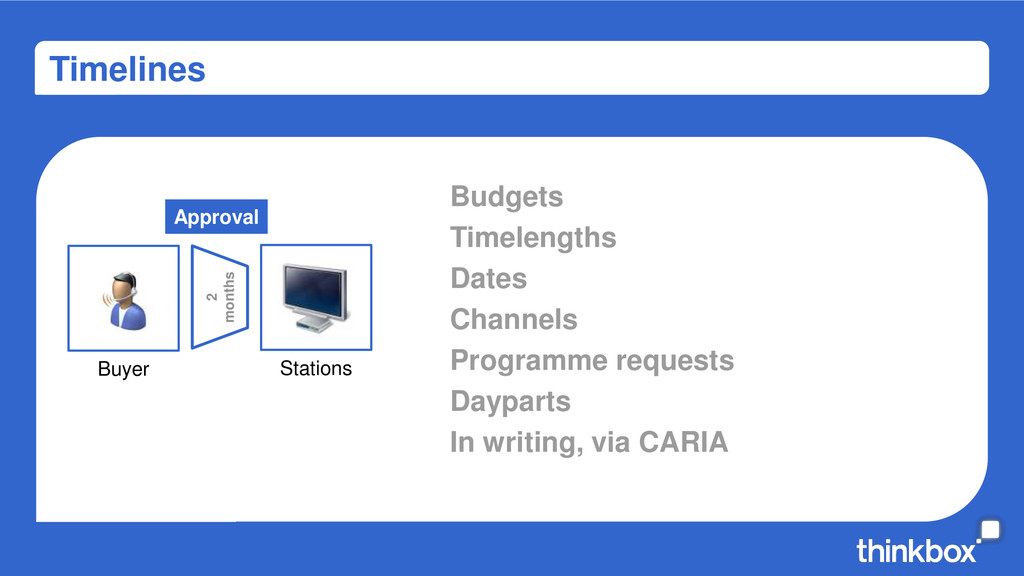
Less reliance on the 30” spot (although it is still the most popular form of advertising) Innovation is rewarded 2012 will see more PP as brands use it with sponsorship
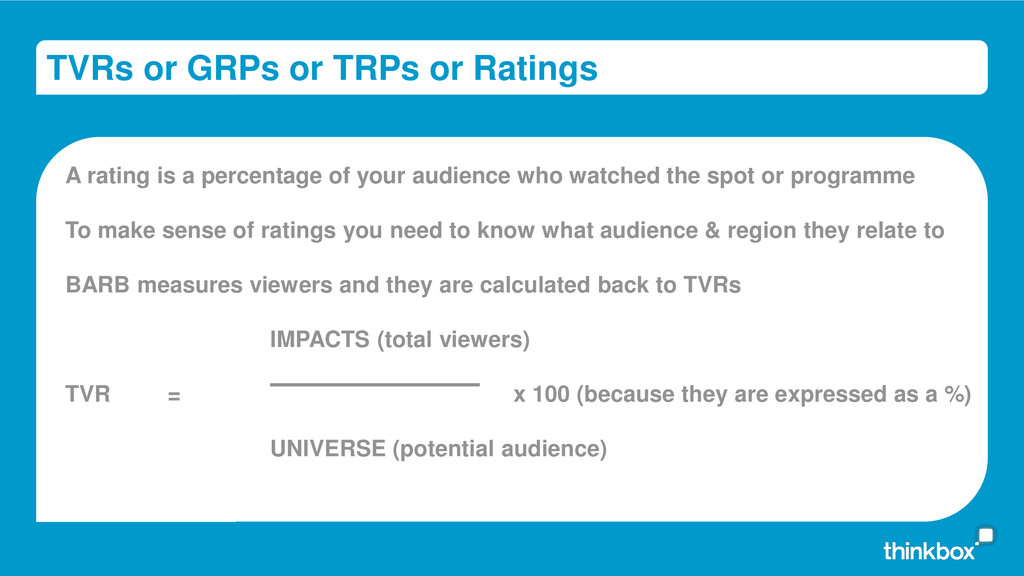
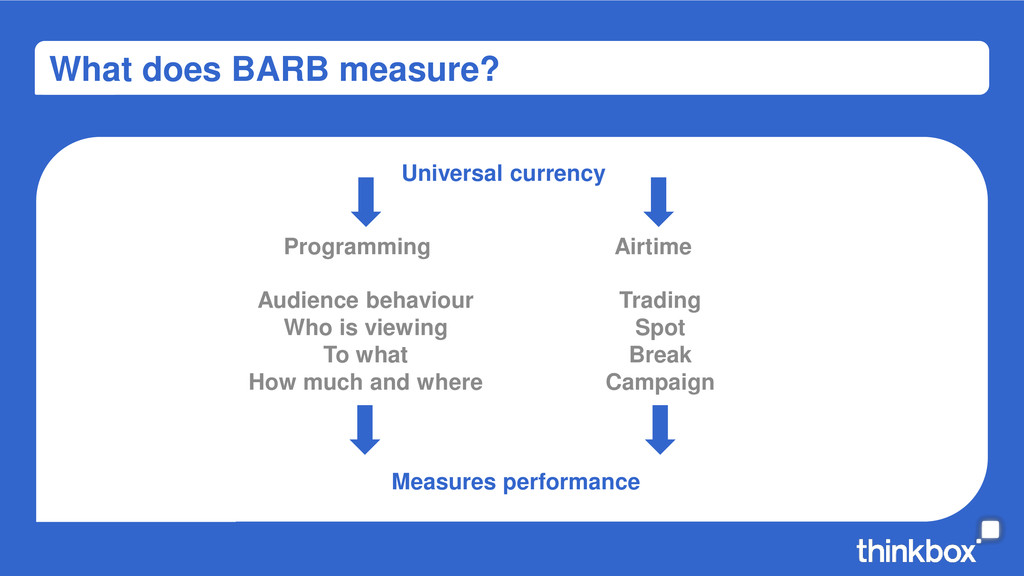
a percentage of your audience who watched the spot or programme To make sense of ratings you need to know what audience & region they relate to BARB measures viewers and they are calculated back to TVRs IMPACTS (total viewers) TVR = x 100 (because they are expressed as a %) UNIVERSE (potential audience)
1000 impacts Negotiate a discount vs the average price in market Transparent demand and supply mechanism Constantly moving as viewing and demand changes
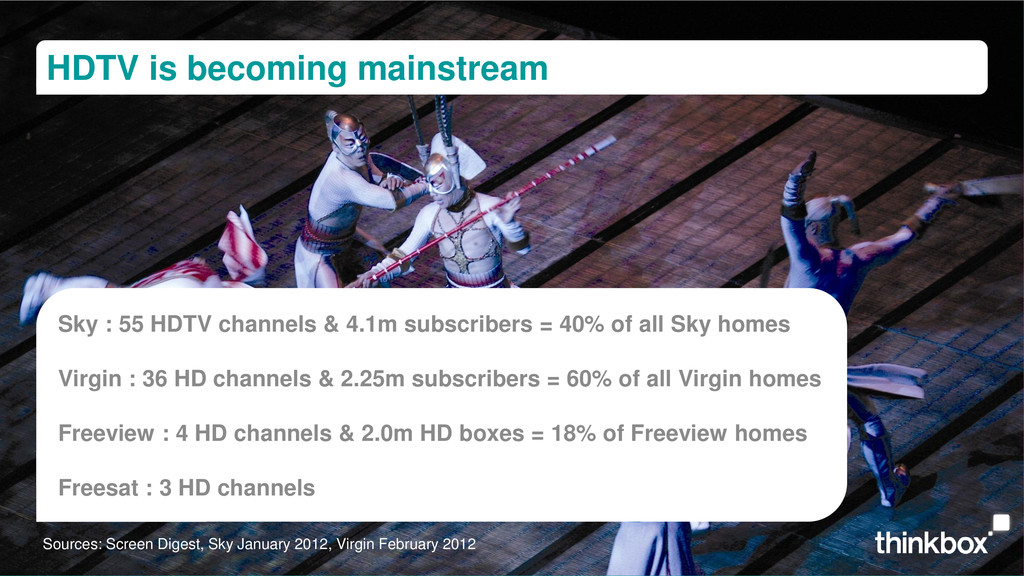
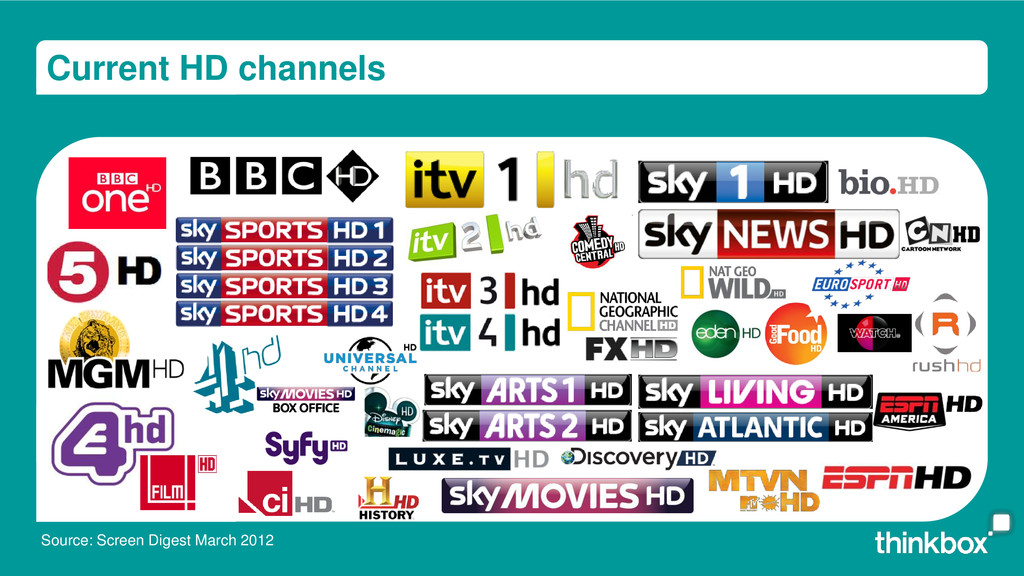
4.1m subscribers = 40% of all Sky homes Virgin : 36 HD channels & 2.25m subscribers = 60% of all Virgin homes Freeview : 4 HD channels & 2.0m HD boxes = 18% of Freeview homes Freesat : 3 HD channels Sources: Screen Digest, Sky January 2012, Virgin February 2012
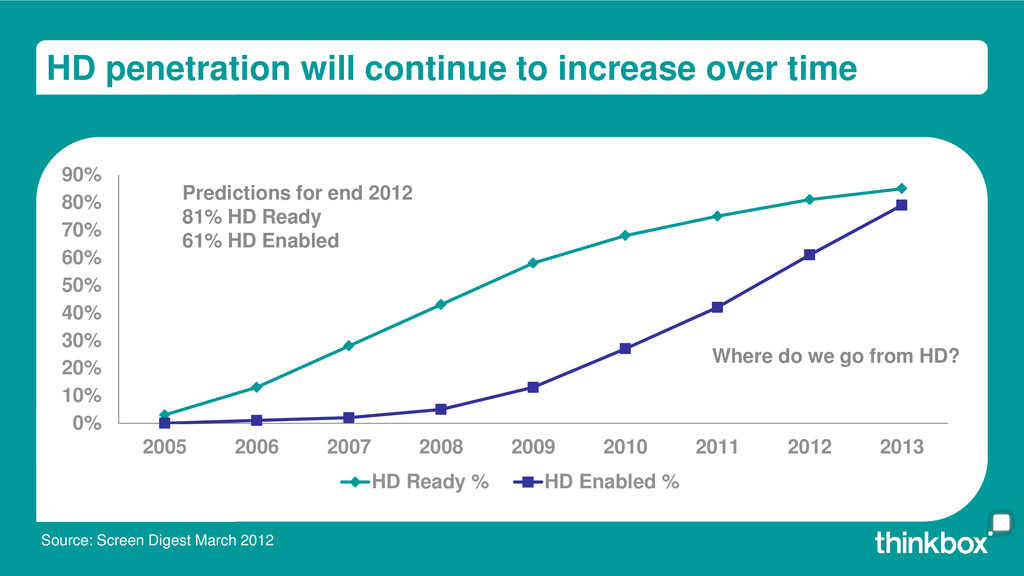
Digest March 2012 0% 10% 20% 30% 40% 50% 60% 70% 80% 90% 2005 2006 2007 2008 2009 2010 2011 2012 2013 HD Ready % HD Enabled % Predictions for end 2012 81% HD Ready 61% HD Enabled Where do we go from HD?
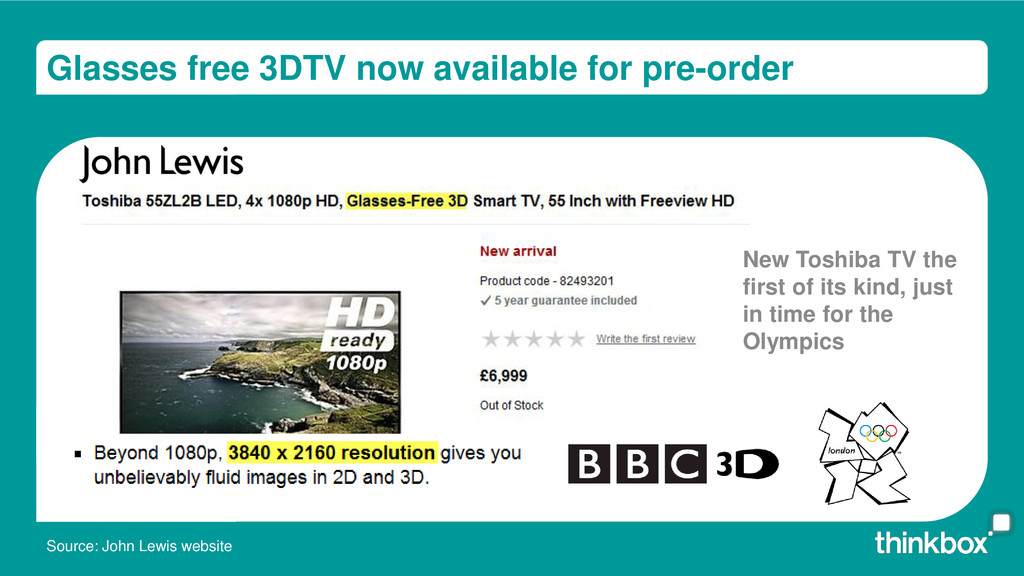
4320P (7680 x 4320) 33,177,600 pixels Over 16x the pixels of the current best TVs on the market London 2012 set to have three Ultra HD screens set up across the country Source: www.pocket-lint.com
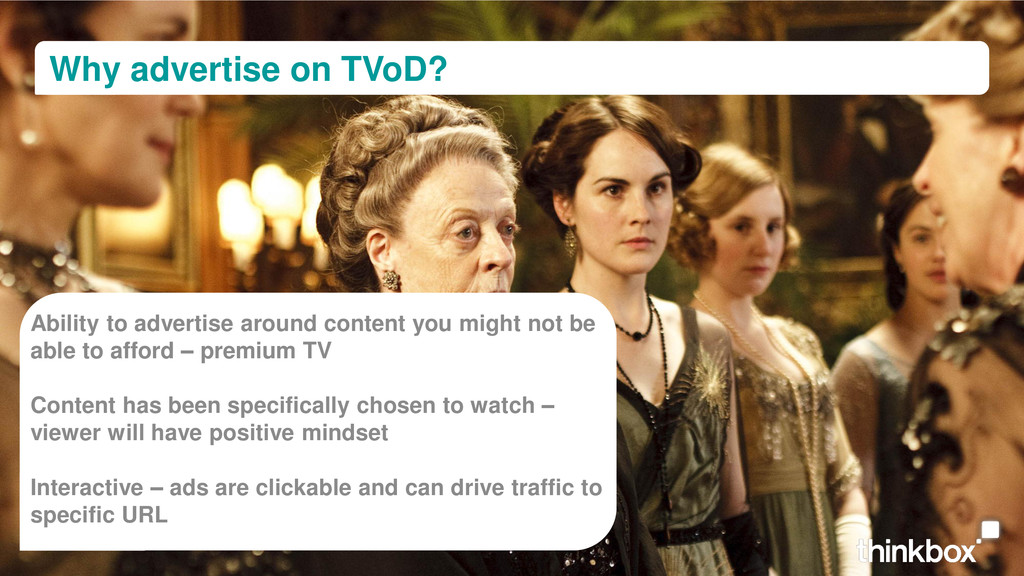
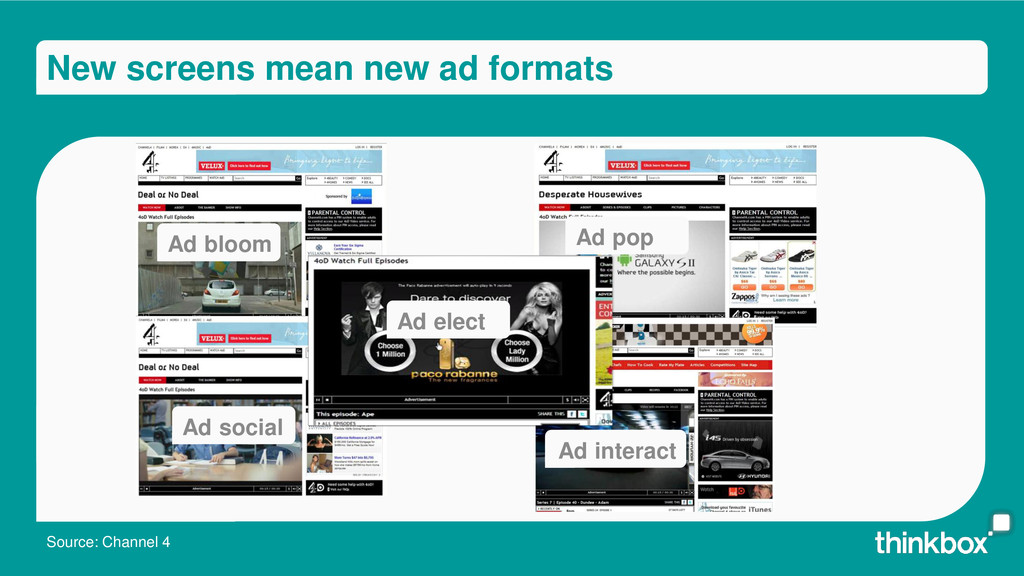
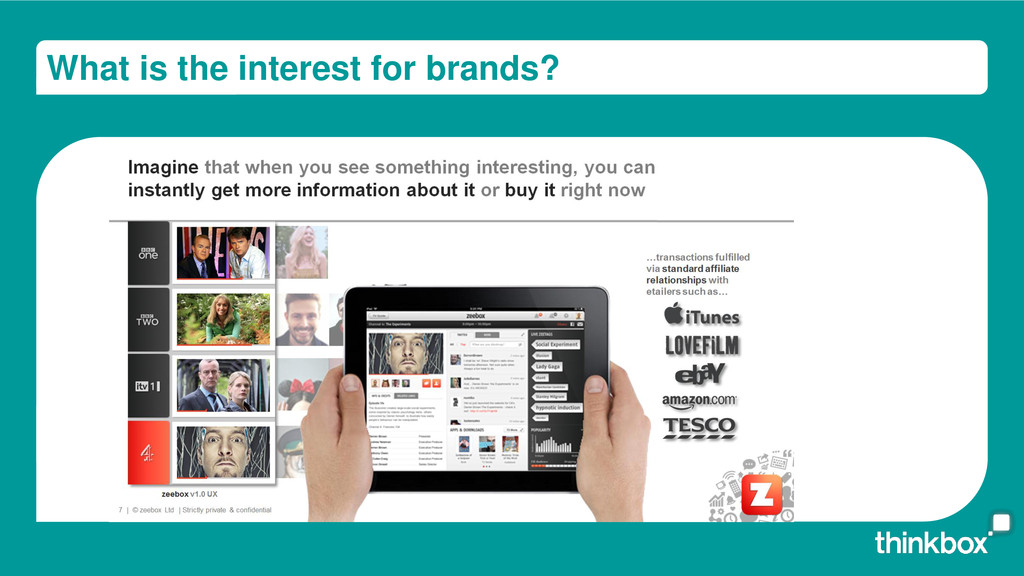
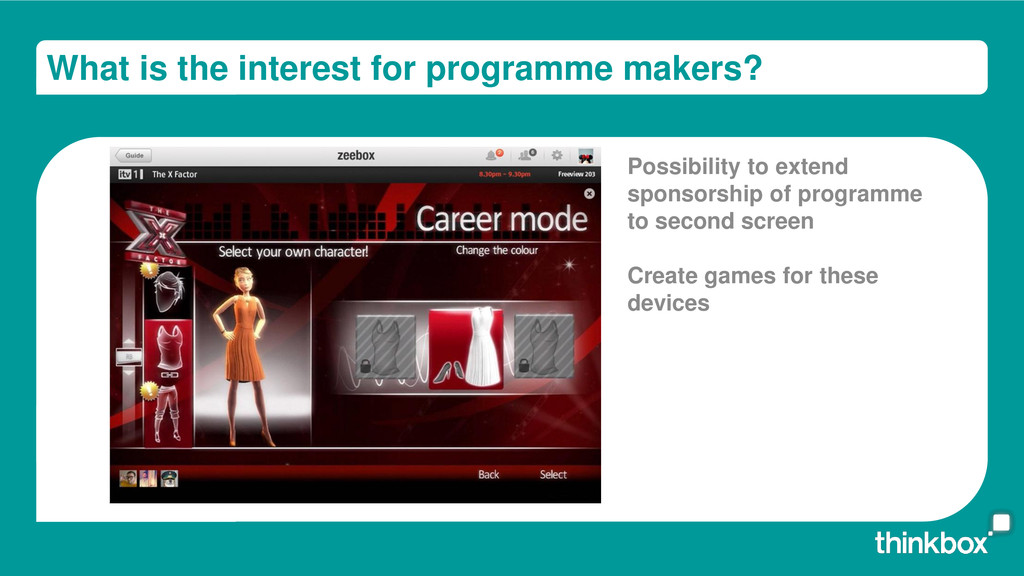
might not be able to afford – premium TV Content has been specifically chosen to watch – viewer will have positive mindset Interactive – ads are clickable and can drive traffic to specific URL
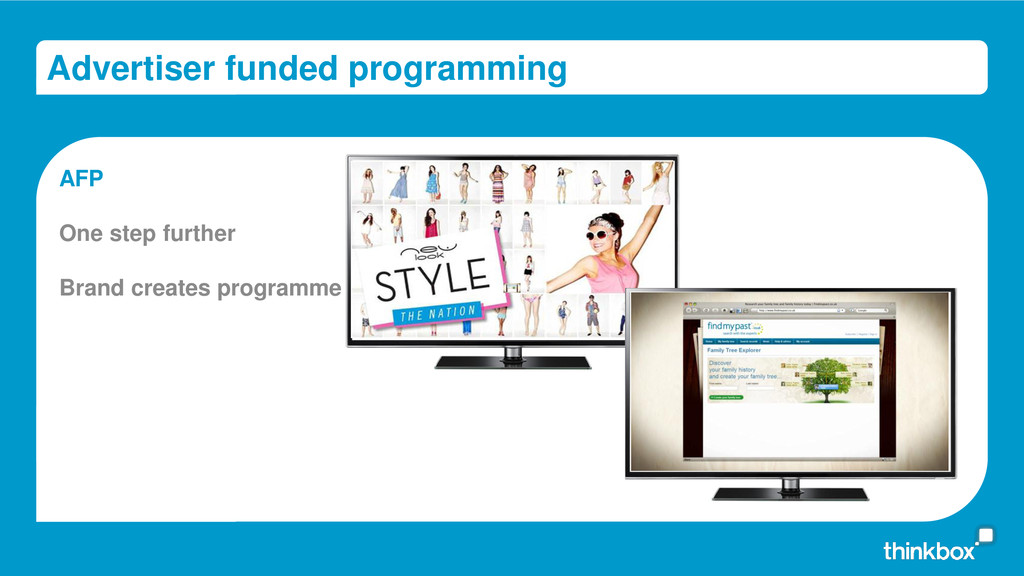
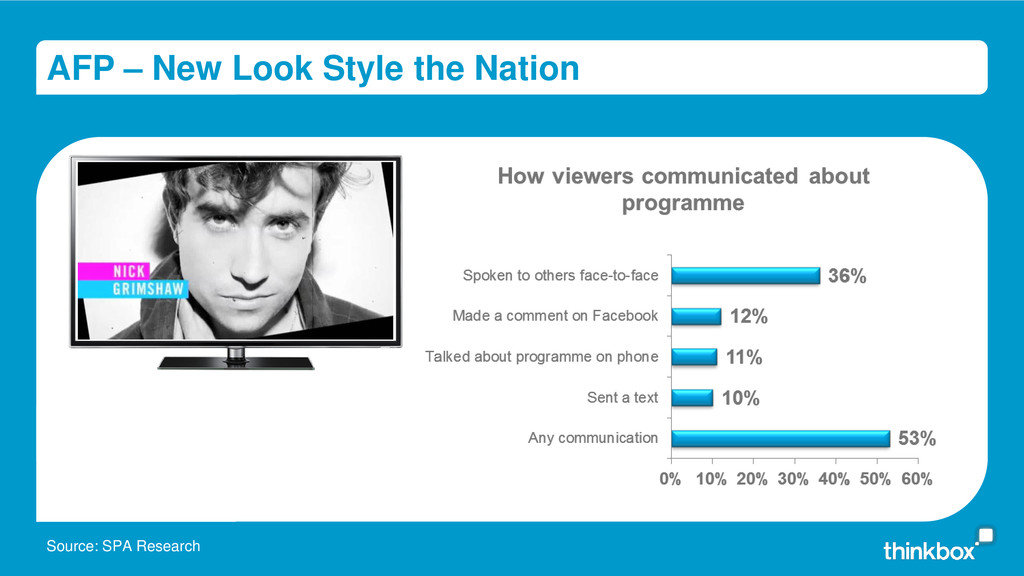
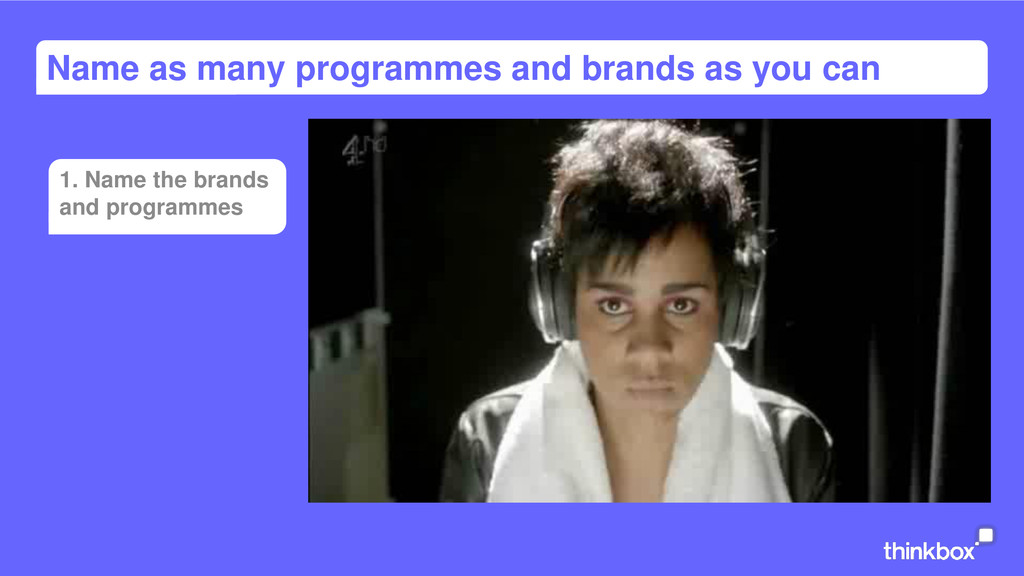
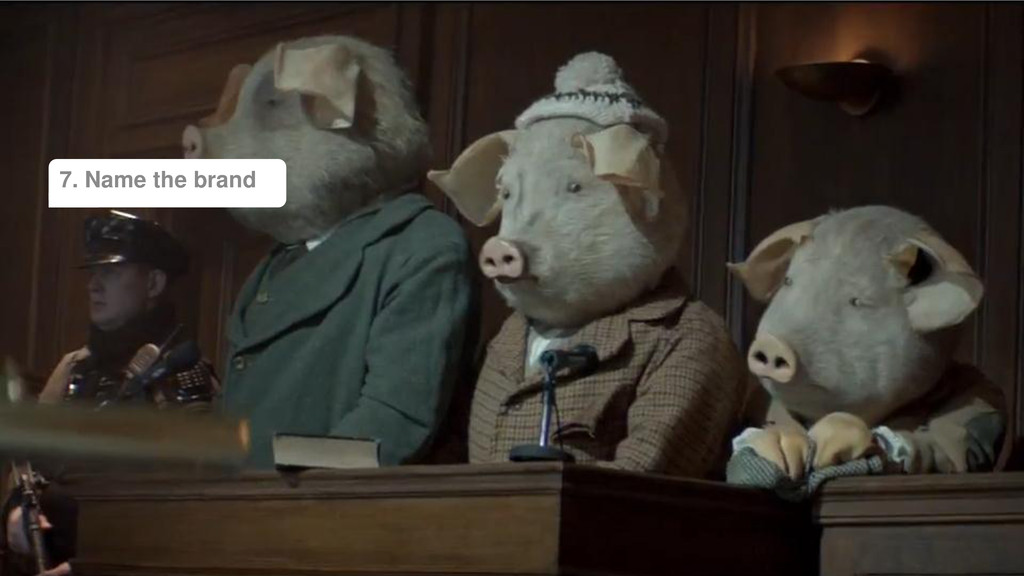
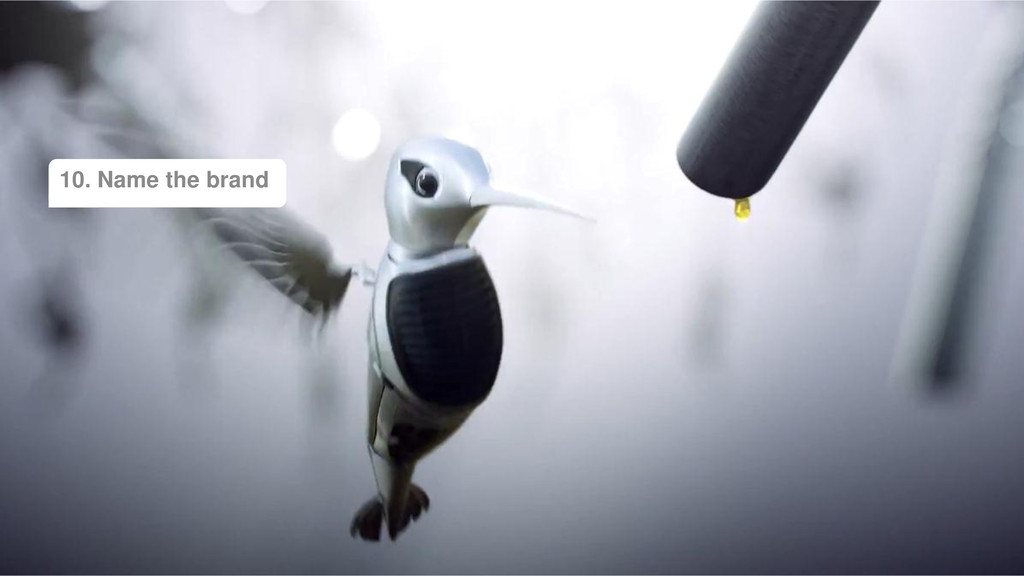
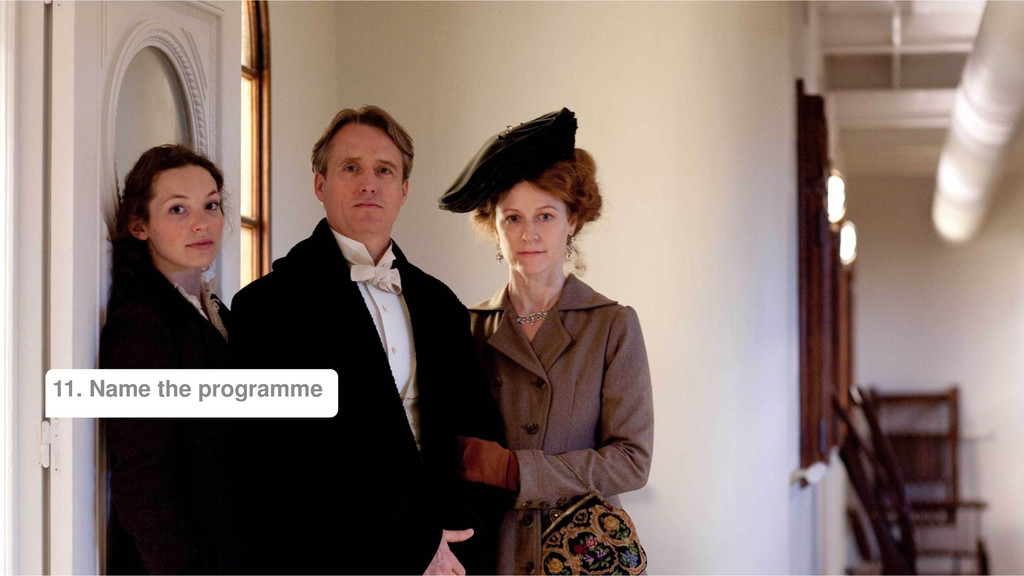
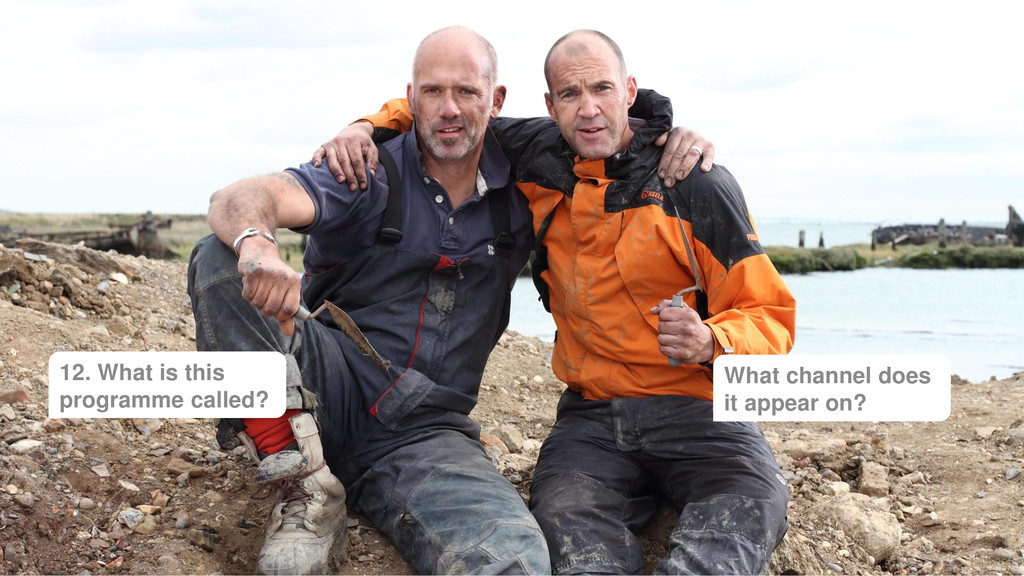
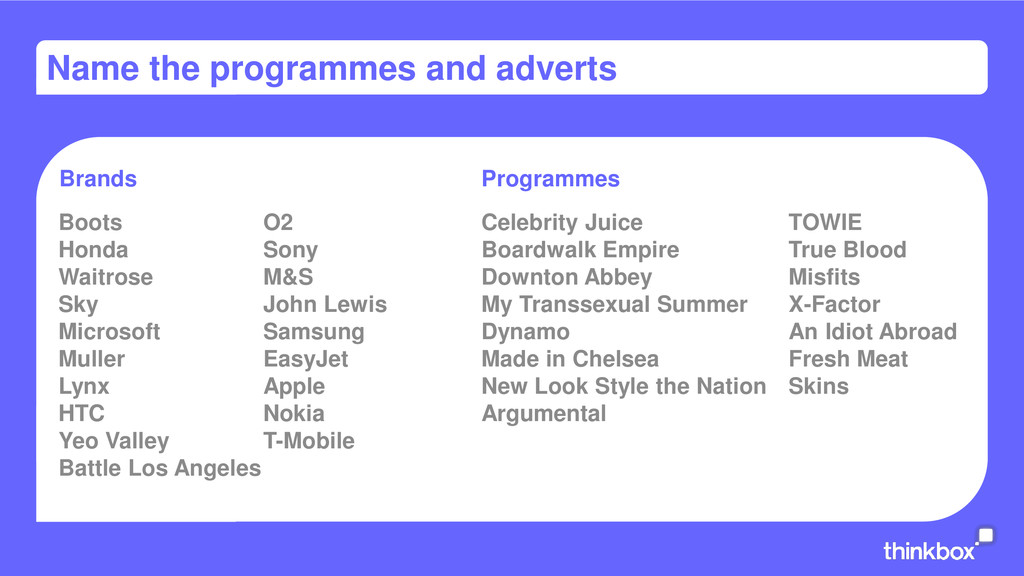
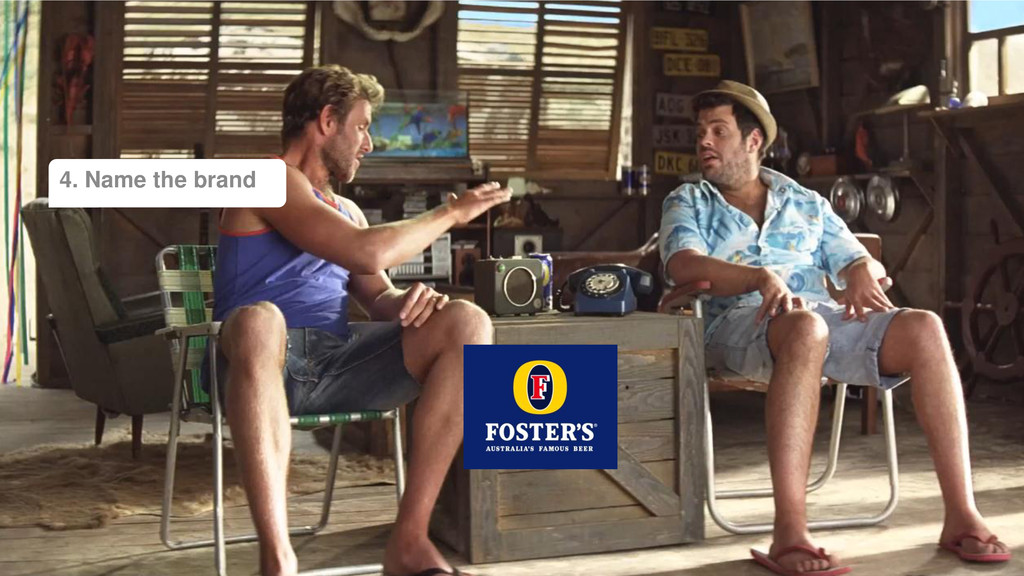
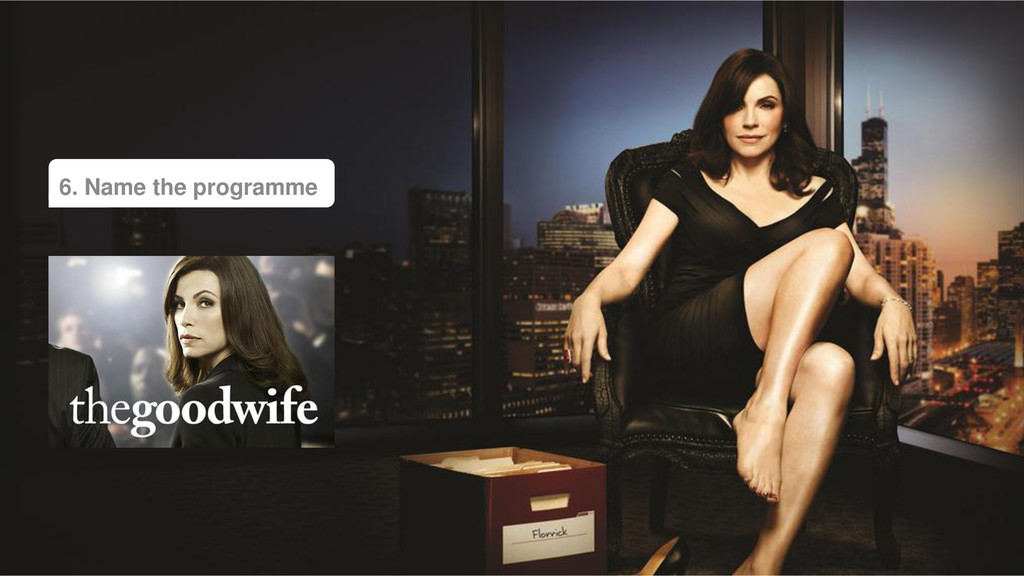
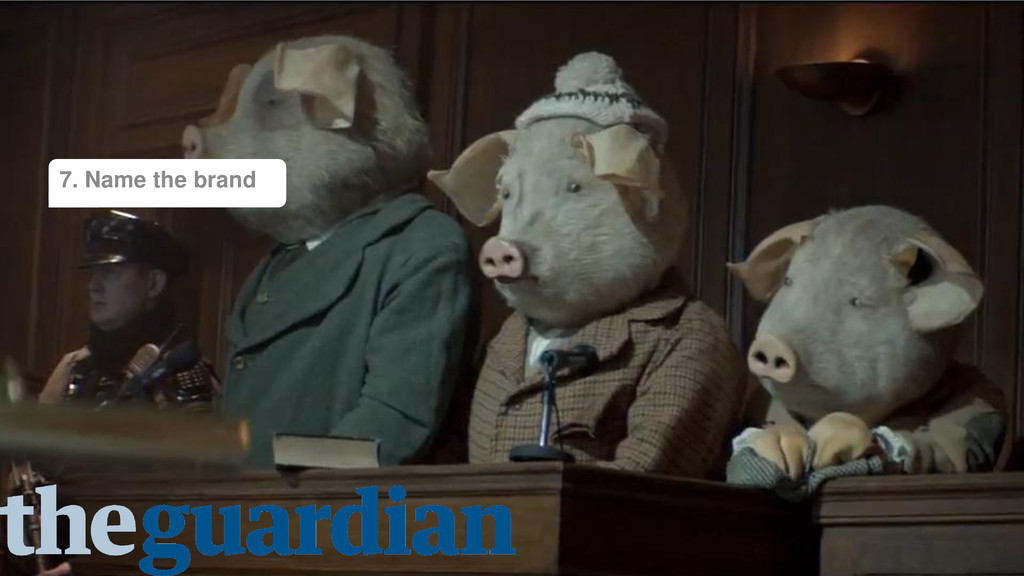
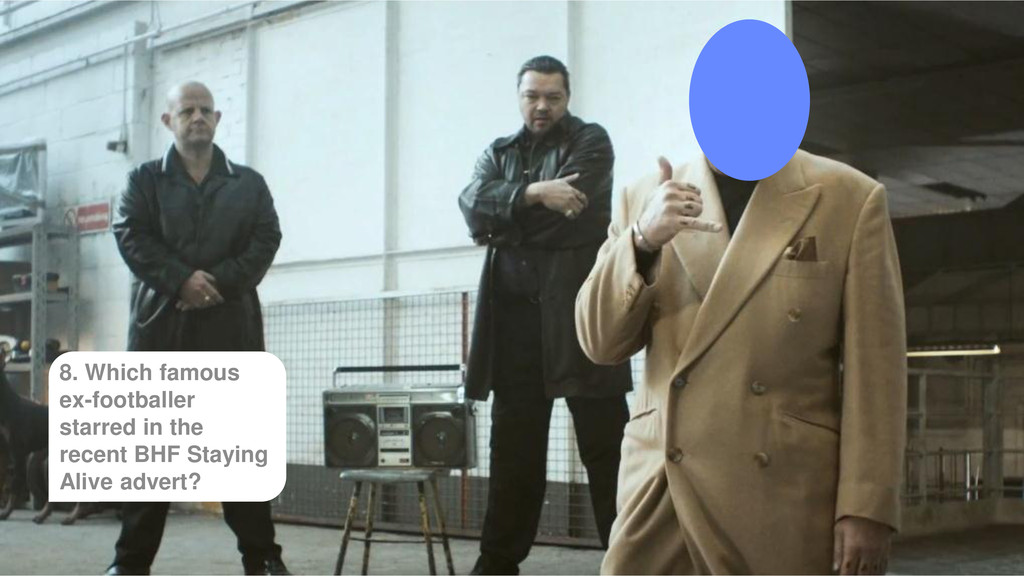
M&S Sky John Lewis Microsoft Samsung Muller EasyJet Lynx Apple HTC Nokia Yeo Valley T-Mobile Battle Los Angeles Celebrity Juice TOWIE Boardwalk Empire True Blood Downton Abbey Misfits My Transsexual Summer X-Factor Dynamo An Idiot Abroad Made in Chelsea Fresh Meat New Look Style the Nation Skins Argumental Brands Programmes
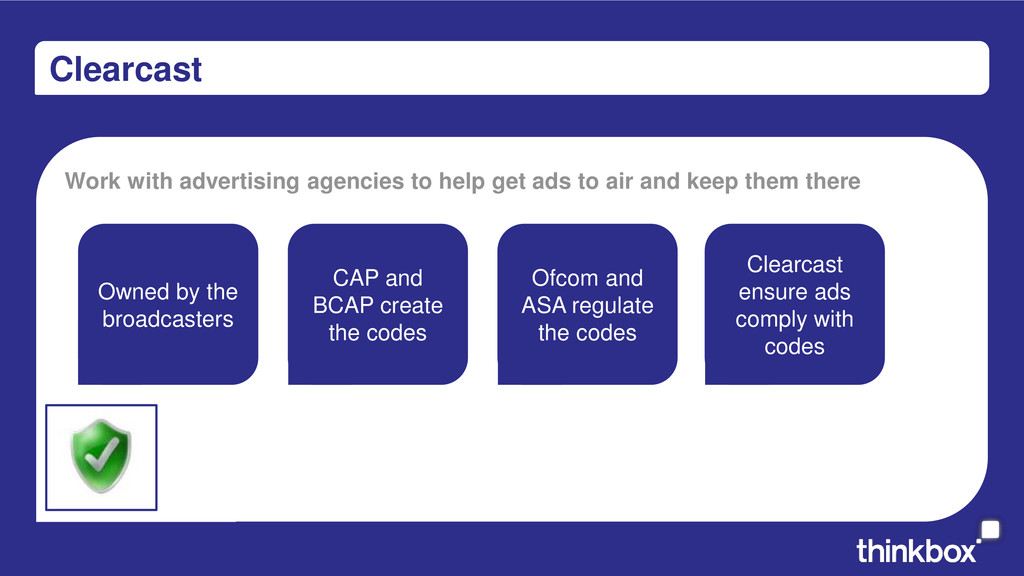
air and keep them there Owned by the broadcasters CAP and BCAP create the codes Clearcast ensure ads comply with codes Ofcom and ASA regulate the codes
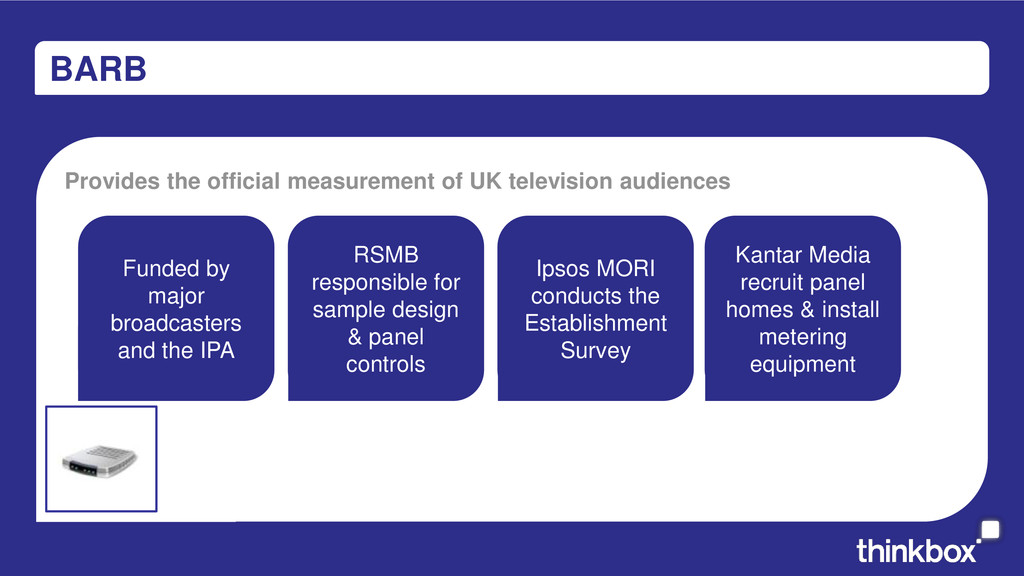
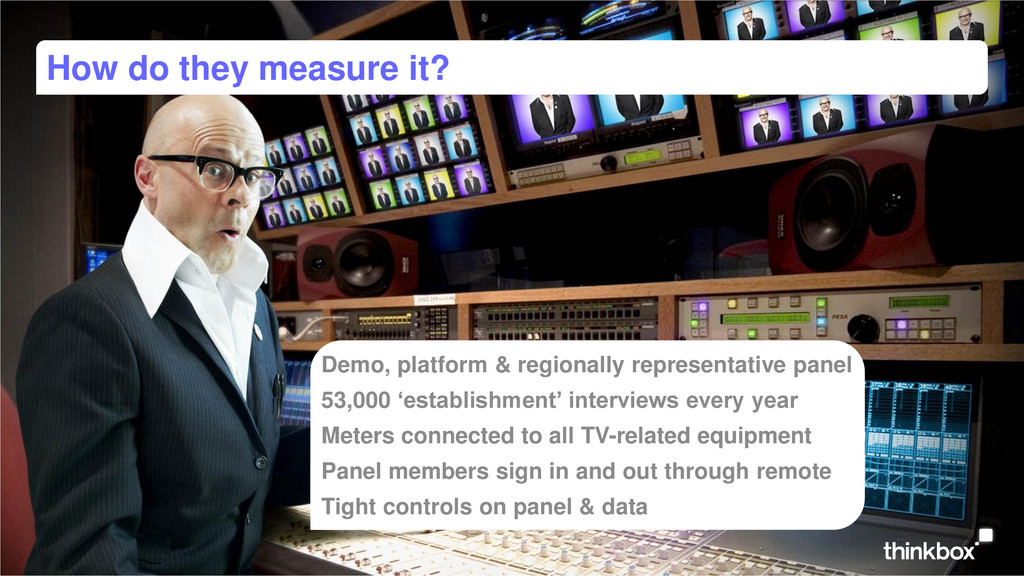
by major broadcasters and the IPA RSMB responsible for sample design & panel controls Kantar Media recruit panel homes & install metering equipment Ipsos MORI conducts the Establishment Survey
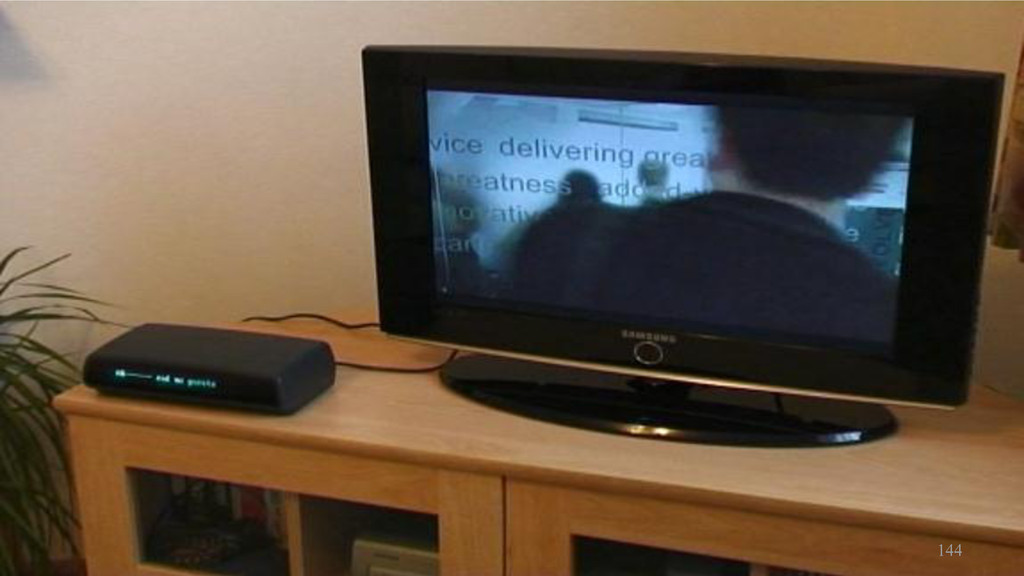
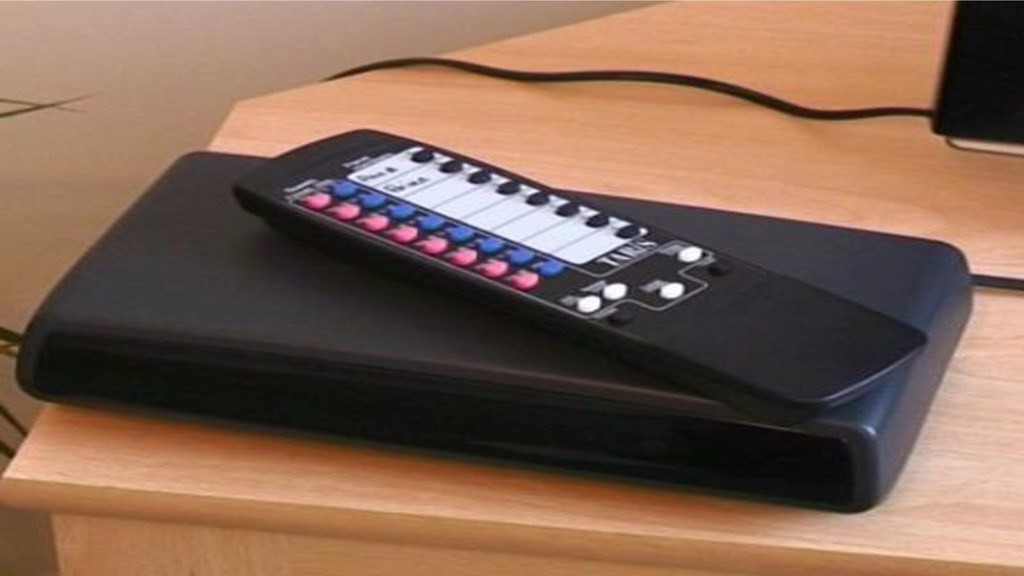
panel 53,000 ‘establishment’ interviews every year Meters connected to all TV-related equipment Panel members sign in and out through remote Tight controls on panel & data
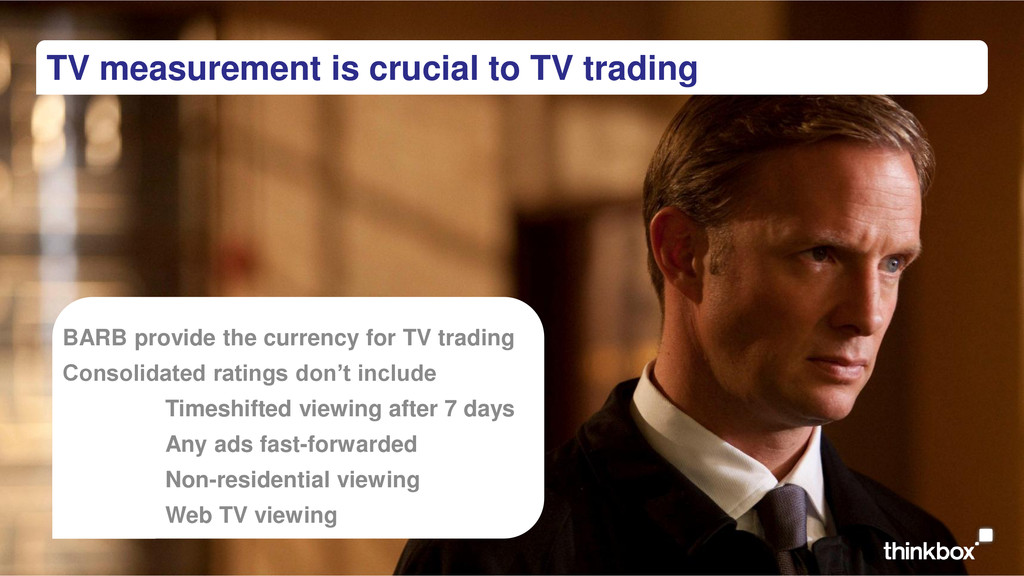
currency for TV trading Consolidated ratings don’t include Timeshifted viewing after 7 days Any ads fast-forwarded Non-residential viewing Web TV viewing
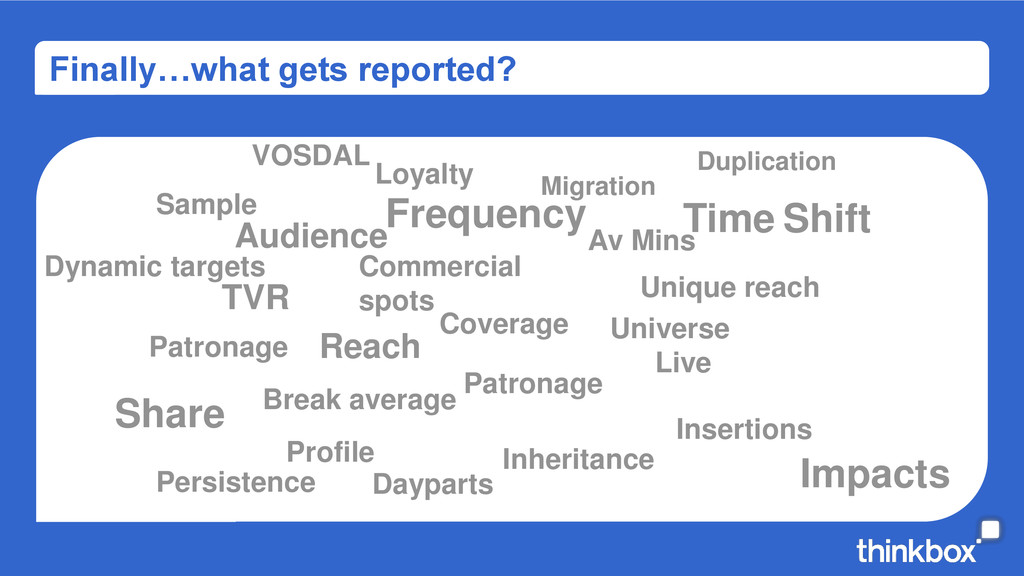
Av Mins Impacts Insertions Universe Coverage Frequency Migration Duplication Break average Commercial spots Patronage Dayparts Patronage Sample Dynamic targets Unique reach Live VOSDAL Time Shift Persistence