Upgrade to Pro
— share decks privately, control downloads, hide ads and more …
Speaker Deck
Features
Speaker Deck
PRO
Sign in
Sign up for free
Search
Search
Metrics Driven Monitoring with Sensu/Graphite/G...
Search
Sponsored
·
Your Podcast. Everywhere. Effortlessly.
Share. Educate. Inspire. Entertain. You do you. We'll handle the rest.
→
Jaime Gago
February 09, 2015
Technology
1.1k
0
Share
Metrics Driven Monitoring with Sensu/Graphite/Grafana
Metrics Driven Monitoring with Sensu/Graphite/Grafana
Jaime Gago
February 09, 2015
More Decks by Jaime Gago
See All by Jaime Gago
Automating an AWS Complex Infrastructure With Ansible: Lessons learned
jaimegago
1
280
Other Decks in Technology
See All in Technology
生成 AI × MCP で切り拓く次世代 SRE!自律型運用への挑戦と開発者体験の進化
_awache
0
110
JJUG CCC 2026 Spring AI時代の開発こそ標準化を武器に! ― 方式・プロセス・プラットフォームの標準化
s27watanabe
2
690
個人AIからチームAIへ:開発における品質と生産性の再設計
moongift
PRO
0
370
チームで実践する AI-DLC 思考の軌跡を残すチェックポイント設計
belongadmin
0
2.1k
Oracle AI Database@AWS:サービス概要のご紹介
oracle4engineer
PRO
4
2.8k
探して_入れて_作って_使う_Agent_Skills___LT.pdf
peintangos
2
160
Agentic ERPをどう設計するか ー 受発注エージェントを動かす、現場の知見と設計思想ー
recerqainc
1
1.1k
React、まだ楽しくて草
uhyo
7
3.9k
AI活用を推進するために ファインディが下した、一つの小さな決断
starfish719
0
220
Claude code Orchestra
ozakiomumkj
3
920
実装は速くなった、レビューはどうする? ― 自身のレビューをAIで再現させるサーヴァントエンジニアリングのすゝめ / Implementation got faster. So what about reviews? — An invitation to Servant Engineering: Recreating your own code reviews with AI
nrslib
6
3.1k
製造業のクラウド活用最適解〜AI,DXを加速するデータ基盤の作り方〜
hamadakoji
0
320
Featured
See All Featured
Exploring anti-patterns in Rails
aemeredith
3
390
How to Think Like a Performance Engineer
csswizardry
28
2.6k
Practical Orchestrator
shlominoach
191
11k
Avoiding the “Bad Training, Faster” Trap in the Age of AI
tmiket
0
170
Max Prin - Stacking Signals: How International SEO Comes Together (And Falls Apart)
techseoconnect
PRO
0
170
Odyssey Design
rkendrick25
PRO
2
670
Leading Effective Engineering Teams in the AI Era
addyosmani
9
2k
Imperfection Machines: The Place of Print at Facebook
scottboms
270
14k
[RailsConf 2023 Opening Keynote] The Magic of Rails
eileencodes
31
10k
Rails Girls Zürich Keynote
gr2m
96
14k
How to Build an AI Search Optimization Roadmap - Criteria and Steps to Take #SEOIRL
aleyda
1
2.1k
Making Projects Easy
brettharned
120
6.7k
Transcript
Metrics Driven Monitoring with Sensu/Graphite/Grafana @JaimeGagoTech
VS 10/7/14, 5:14 PM ,000,000 ,000,000 ,000,000 ,000,000 ,000,000 ,000,000
,000,000 ,000,000 ,000,000 ,000,000 ,000,000 ,000,000 ,000,000 ,000,000 ,000,000 ,000,000 ,000,000 1920 1921 1922 1923 1924 1925 1926 1927 1928 1929 1930 1931 1932 1933 1934 1935 1936 1937 1938 1939 1940
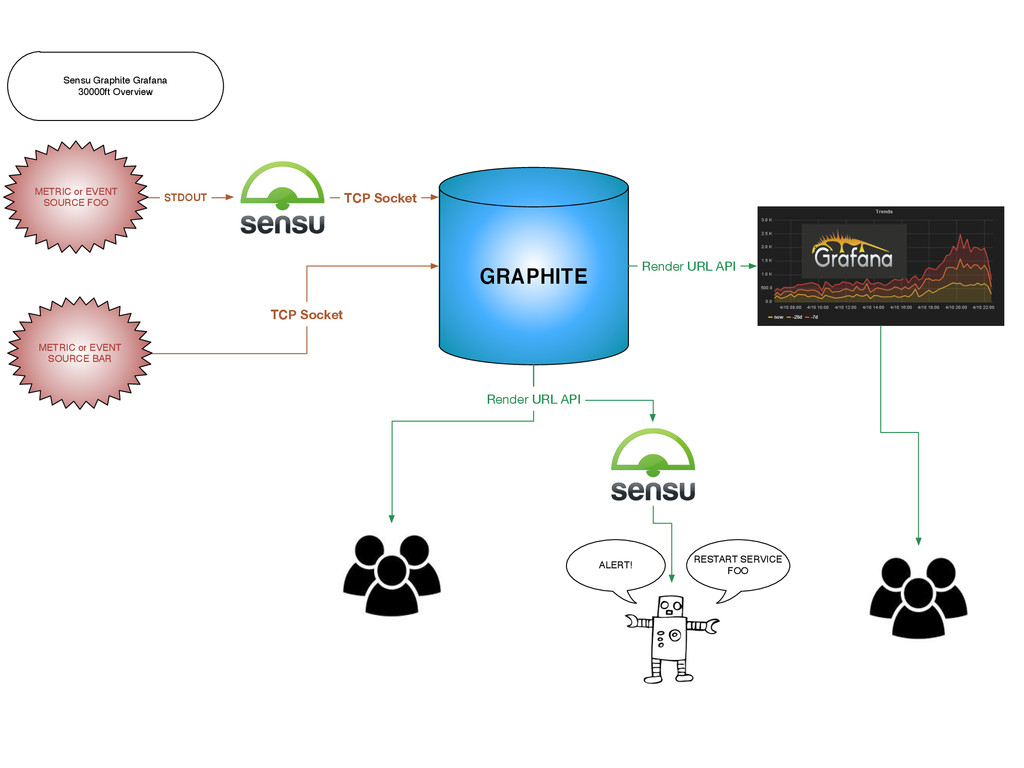
GRAPHITE METRIC or EVENT SOURCE FOO METRIC or EVENT SOURCE
BAR Render URL API Render URL API Sensu Graphite Grafana 30000ft Overview TCP Socket TCP Socket STDOUT ALERT! RESTART SERVICE FOO
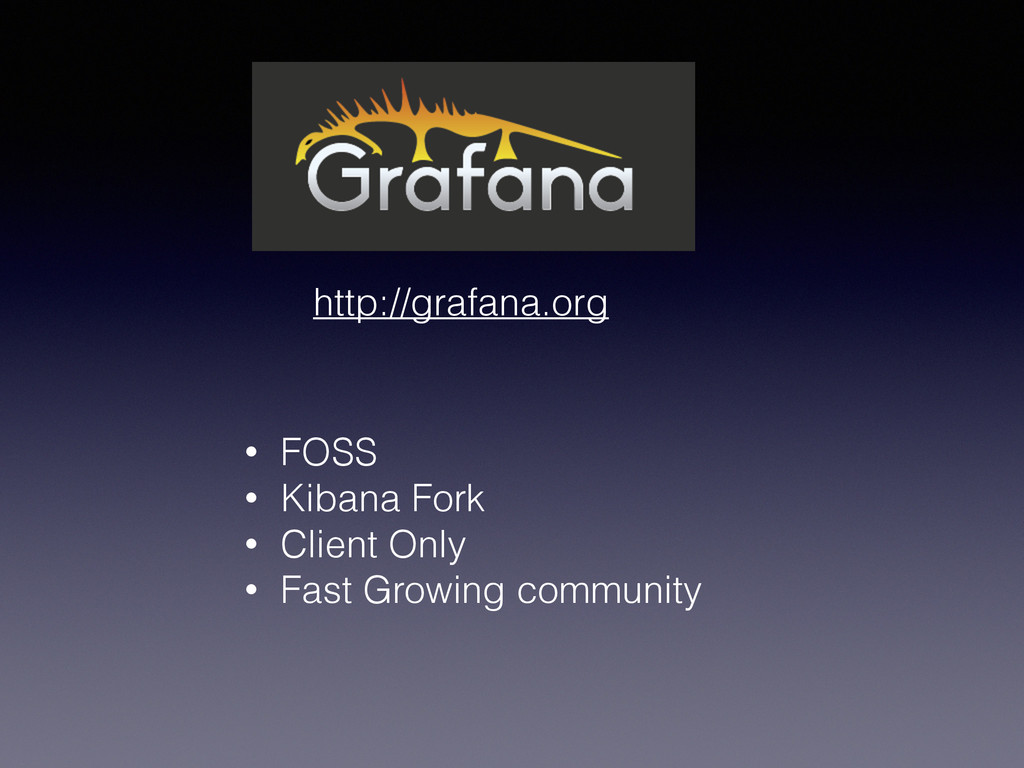
http://grafana.org • FOSS • Kibana Fork • Client Only •
Fast Growing community
None
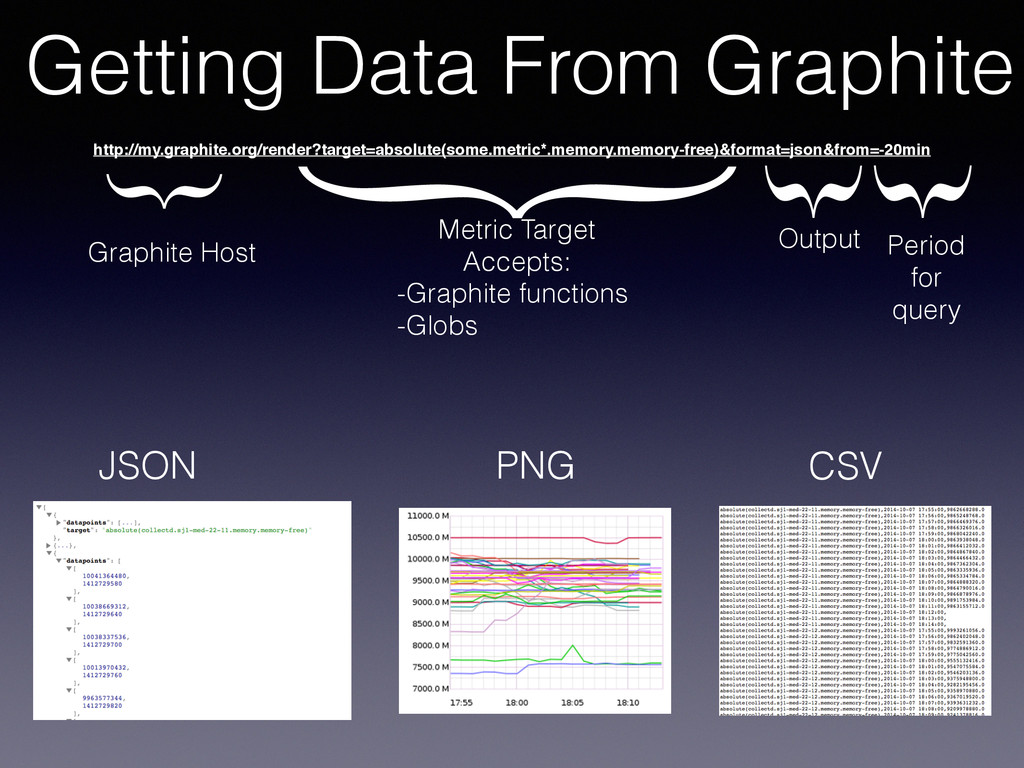
Getting Data From Graphite http://my.graphite.org/render?target=absolute(some.metric*.memory.memory-free)&format=json&from=-20min { { { { Graphite
Host Metric Target Accepts: -Graphite functions -Globs Output Period for query JSON PNG CSV
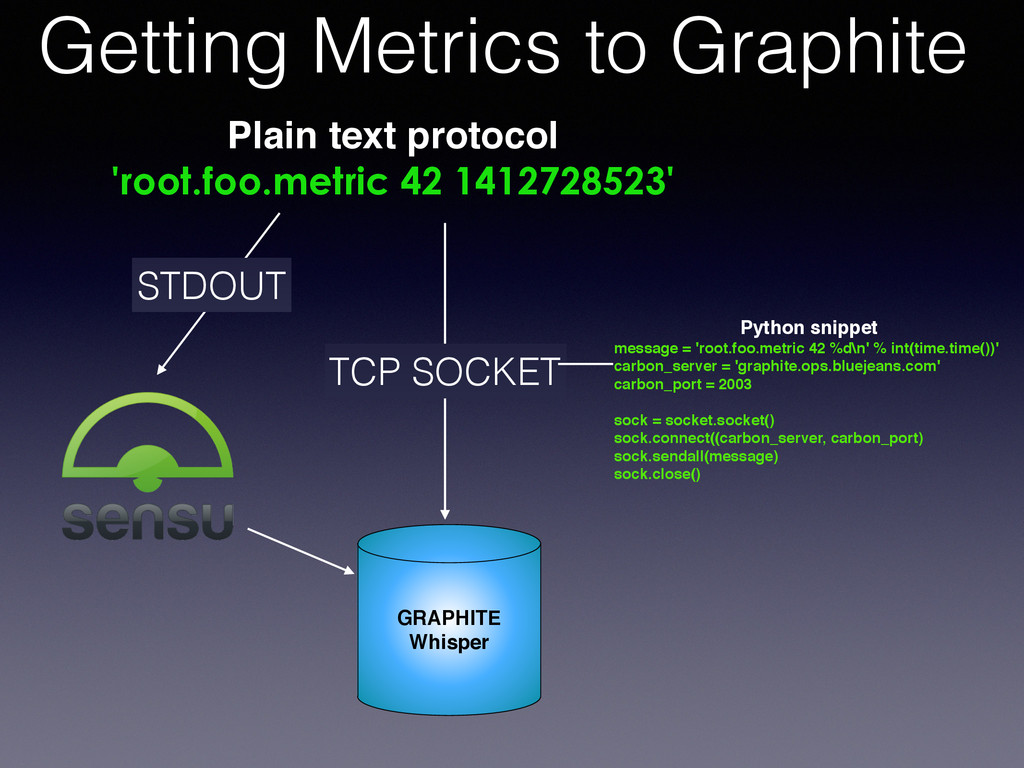
Getting Metrics to Graphite Plain text protocol 'root.foo.metric 42 1412728523'
STDOUT TCP SOCKET Python snippet message = 'root.foo.metric 42 %d\n' % int(time.time())' carbon_server = 'graphite.ops.bluejeans.com' carbon_port = 2003 sock = socket.socket() sock.connect((carbon_server, carbon_port) sock.sendall(message) sock.close() GRAPHITE Whisper
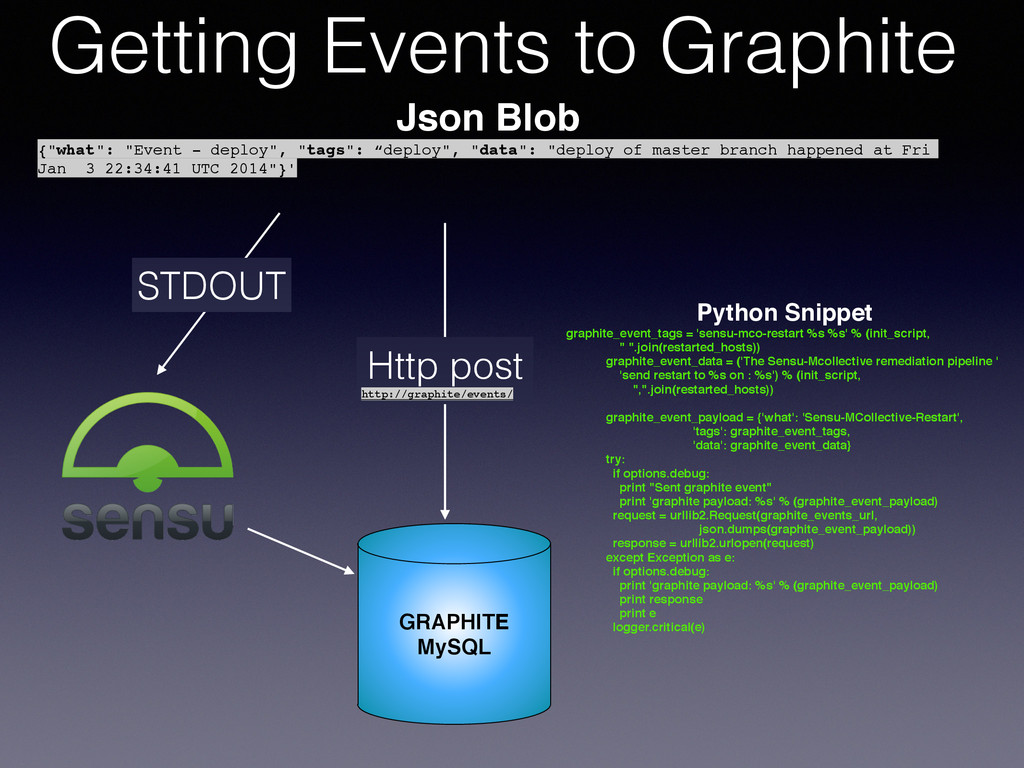
Getting Events to Graphite Json Blob {"what": "Event - deploy",
"tags": “deploy", "data": "deploy of master branch happened at Fri Jan 3 22:34:41 UTC 2014"}' STDOUT Http post http://graphite/events/ Python Snippet graphite_event_tags = 'sensu-mco-restart %s %s' % (init_script, " ".join(restarted_hosts)) graphite_event_data = ('The Sensu-Mcollective remediation pipeline ' 'send restart to %s on : %s') % (init_script, ",".join(restarted_hosts)) graphite_event_payload = {'what': 'Sensu-MCollective-Restart', 'tags': graphite_event_tags, 'data': graphite_event_data} try: if options.debug: print "Sent graphite event" print 'graphite payload: %s' % (graphite_event_payload) request = urllib2.Request(graphite_events_url, json.dumps(graphite_event_payload)) response = urllib2.urlopen(request) except Exception as e: if options.debug: print 'graphite payload: %s' % (graphite_event_payload) print response print e logger.critical(e) GRAPHITE MySQL
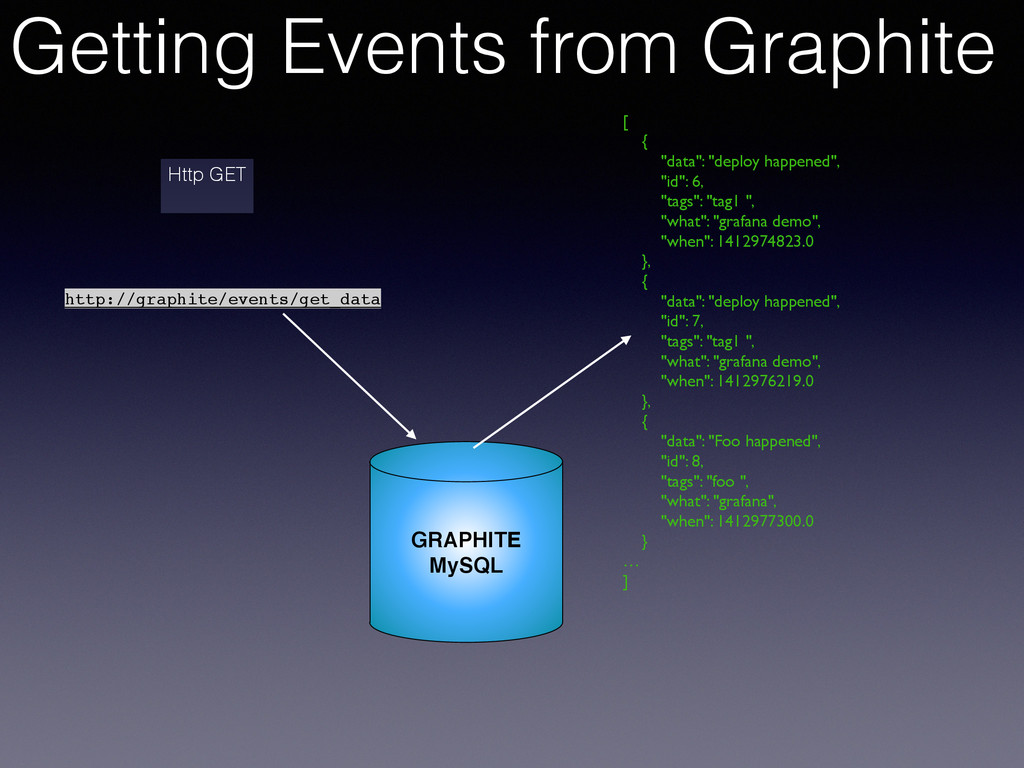
Getting Events from Graphite Http GET GRAPHITE MySQL http://graphite/events/get_data [
{ "data": "deploy happened", "id": 6, "tags": "tag1 ", "what": "grafana demo", "when": 1412974823.0 }, { "data": "deploy happened", "id": 7, "tags": "tag1 ", "what": "grafana demo", "when": 1412976219.0 }, { "data": "Foo happened", "id": 8, "tags": "foo ", "what": "grafana", "when": 1412977300.0 } … ]
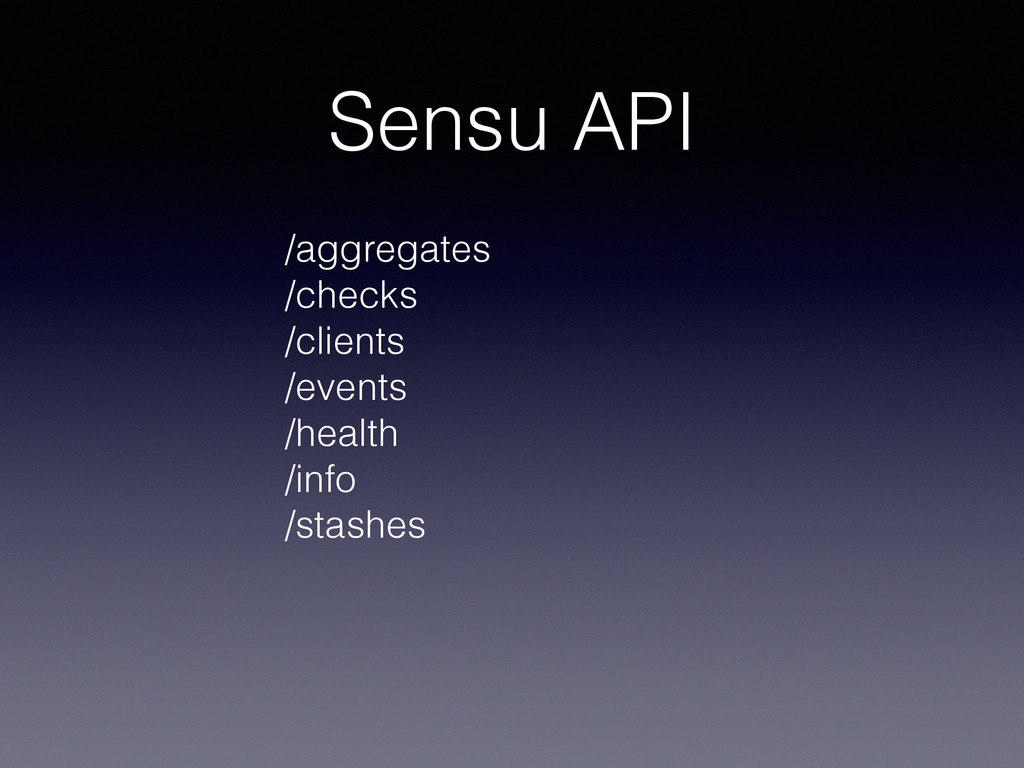
Sensu API /aggregates /checks /clients /events /health /info /stashes
Config Dive In
Self Healing Example
Scaling
Self Service Monitoring