the Command Line 3. GDB Specifics 4. Help 5. Stack Traces 6. Program Listings 7. Breakpoints 8. Displaying Data 9. Changing Data 10. Changing Execution Flow 11. Handy Tricks 12. Debugging Techniques 13. For the More Curious: Core Files 14. For the More Curious: Stripping 15. More Advanced GDB Commands : Threads What Is a Debugger? 디버거란? 다른 대상 프로그램을 테스트하고 디버그하는 데 쓰이는 컴퓨터 프로그램. GDB? the GNU(그누로 발음) project’s debugger compiled with debugging symbol -g debugging symbol enabled. 메모리 주소와 실제 소스코드(라인 정보) 연결 정보 프로그램에서 사용중인 데이터 구조 정보 포함 https://developer.apple.com/library/mac/#documentation/DeveloperTools/gdb/gdb/gdb_toc.html Using GDB from the Command Line Xcode에는 GDB가 포함되어 있고, 별도의 창에서 GDB 명령어를 사용할 수 있다. https://github.com/jakebaek/DebugMemerror git clone https://github.com/jakebaek/DebugMemerror.git
bug git checkout step6 gcc -g -w -o memerror memerror.m gdb ./memerror break memerror.m:54 run blargle n, n, n, n, n info break dis breakpoint-number until print stringbuffer print (char*)(stringbuffer+1) step8 - printf bug git checkout step7 gcc -g -w -o memerror memerror.m gdb ./memerror run blargle where frame 4 print stringbuffer print *stringbuffer step9 - done git checkout step8 gcc -g -w -o memerror memerror.m gdb ./memerror run blargle GDB Specifics See program listings See the stack trace and move around in the stack looking at the variables in various functions Set and disable breakpoints Display data Change data Change execution flow
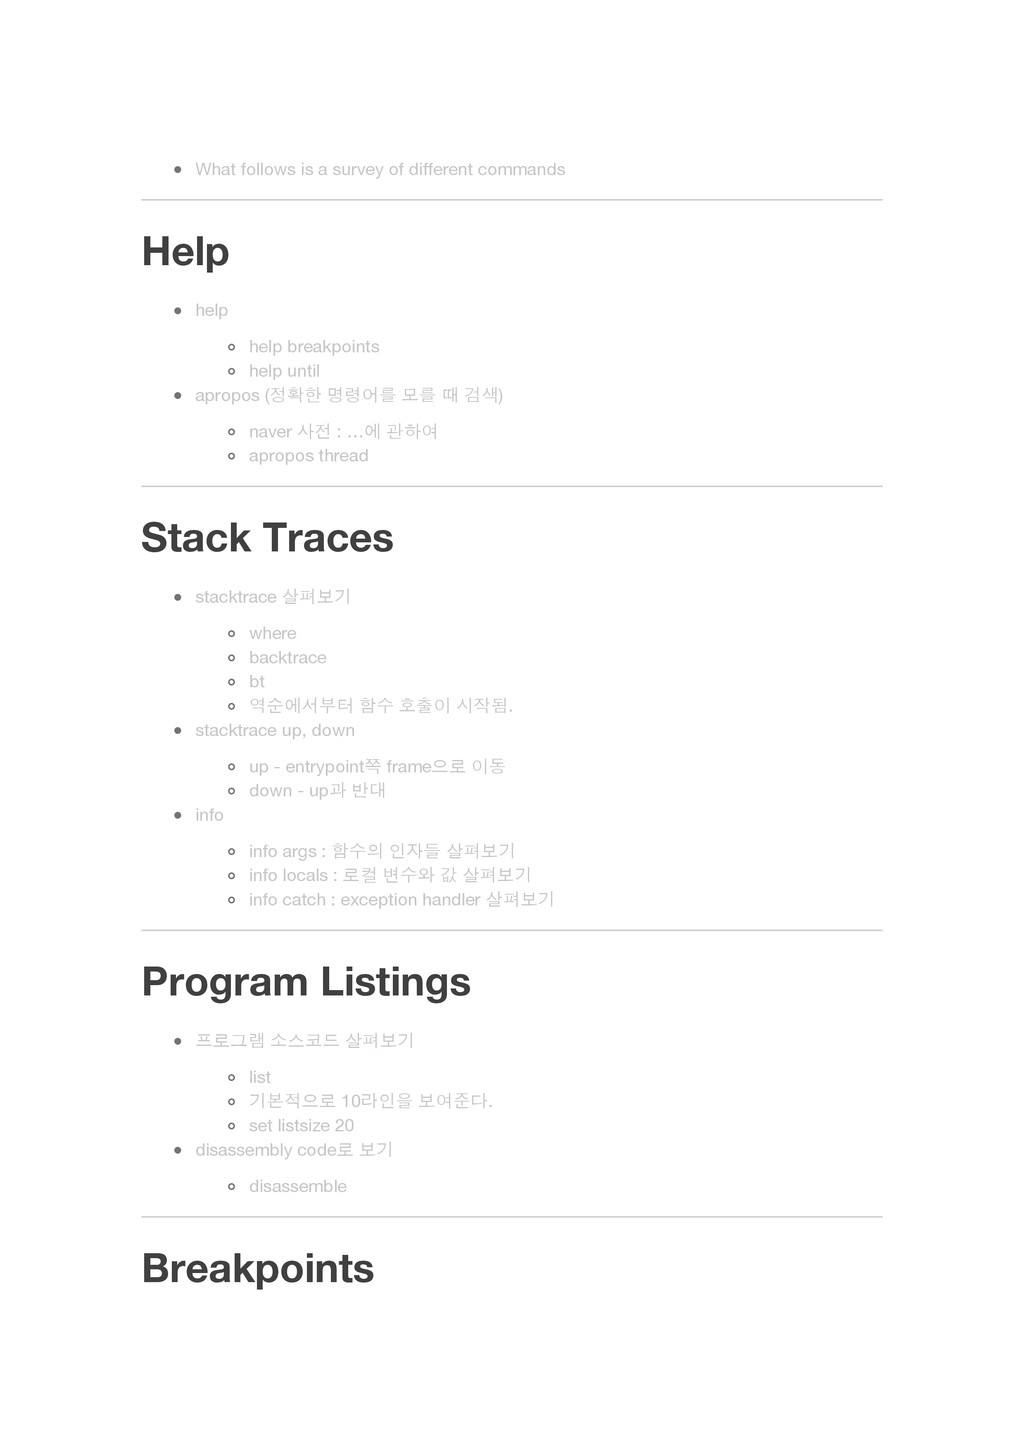
help breakpoints help until apropos (정확한 명령어를 모를 때 검색) naver 사전 : …에 관하여 apropos thread Stack Traces stacktrace 살펴보기 where backtrace bt 역순에서부터 함수 호출이 시작됨. stacktrace up, down up - entrypoint쪽 frame으로 이동 down - up과 반대 info info args : 함수의 인자들 살펴보기 info locals : 로컬 변수와 값 살펴보기 info catch : exception handler 살펴보기 Program Listings 프로그램 소스코드 살펴보기 list 기본적으로 10라인을 보여준다. set listsize 20 disassembly code로 보기 disassemble Breakpoints
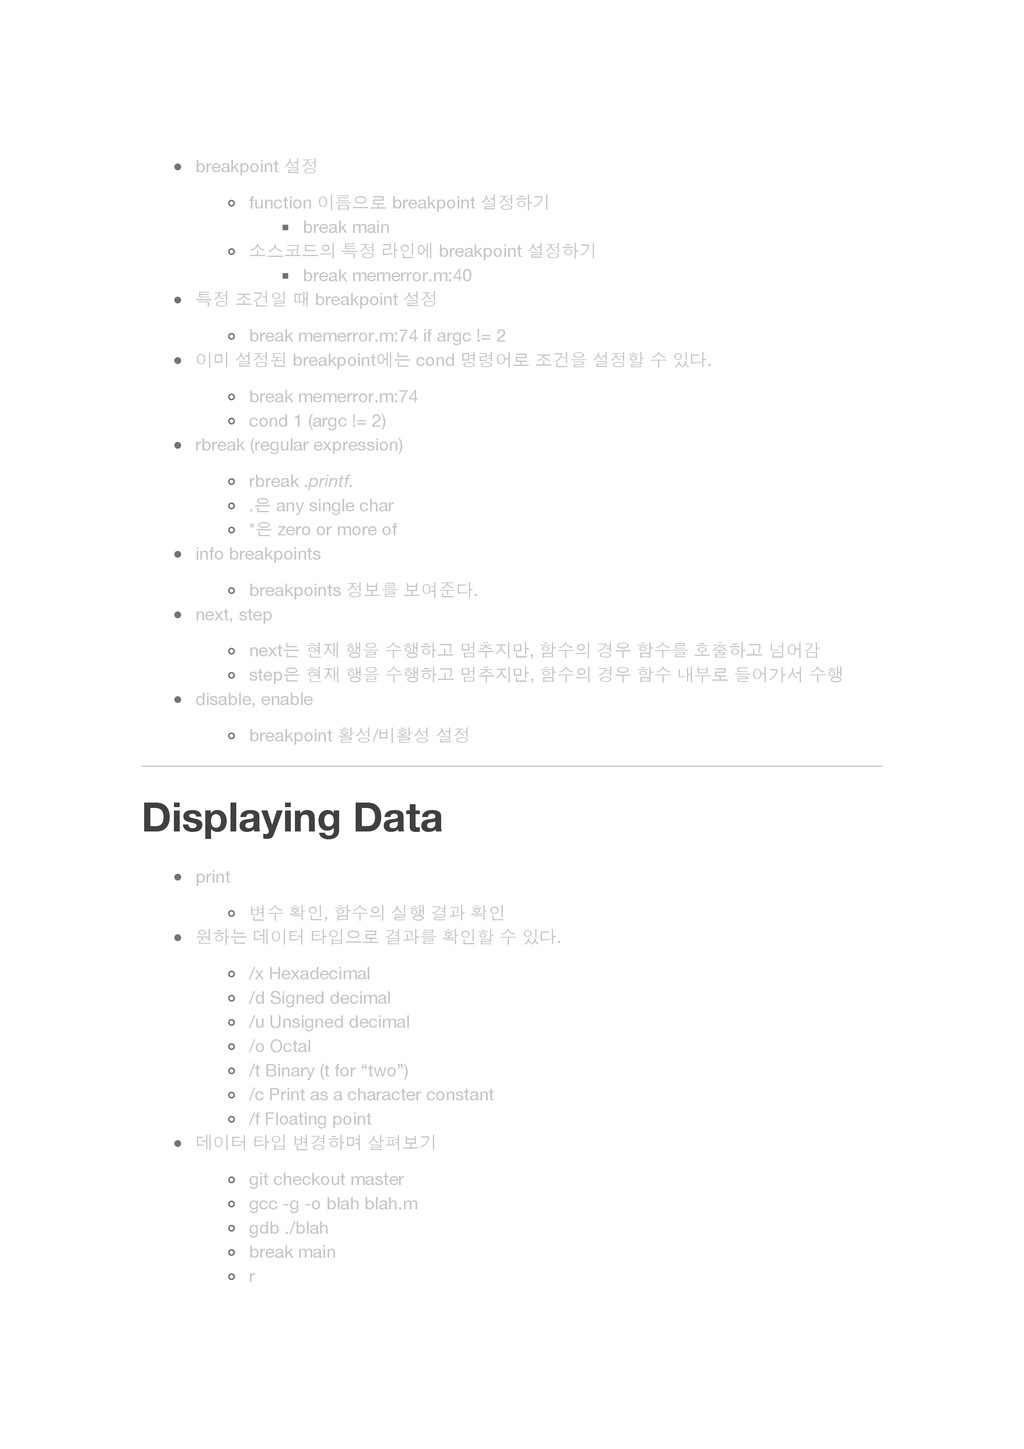
라인에 breakpoint 설정하기 break memerror.m:40 특정 조건일 때 breakpoint 설정 break memerror.m:74 if argc != 2 이미 설정된 breakpoint에는 cond 명령어로 조건을 설정할 수 있다. break memerror.m:74 cond 1 (argc != 2) rbreak (regular expression) rbreak .printf. .은 any single char *은 zero or more of info breakpoints breakpoints 정보를 보여준다. next, step next는 현재 행을 수행하고 멈추지만, 함수의 경우 함수를 호출하고 넘어감 step은 현재 행을 수행하고 멈추지만, 함수의 경우 함수 내부로 들어가서 수행 disable, enable breakpoint 활성/비활성 설정 Displaying Data print 변수 확인, 함수의 실행 결과 확인 원하는 데이터 타입으로 결과를 확인할 수 있다. /x Hexadecimal /d Signed decimal /u Unsigned decimal /o Octal /t Binary (t for “two”) /c Print as a character constant /f Floating point 데이터 타입 변경하며 살펴보기 git checkout master gcc -g -o blah blah.m gdb ./blah break main r
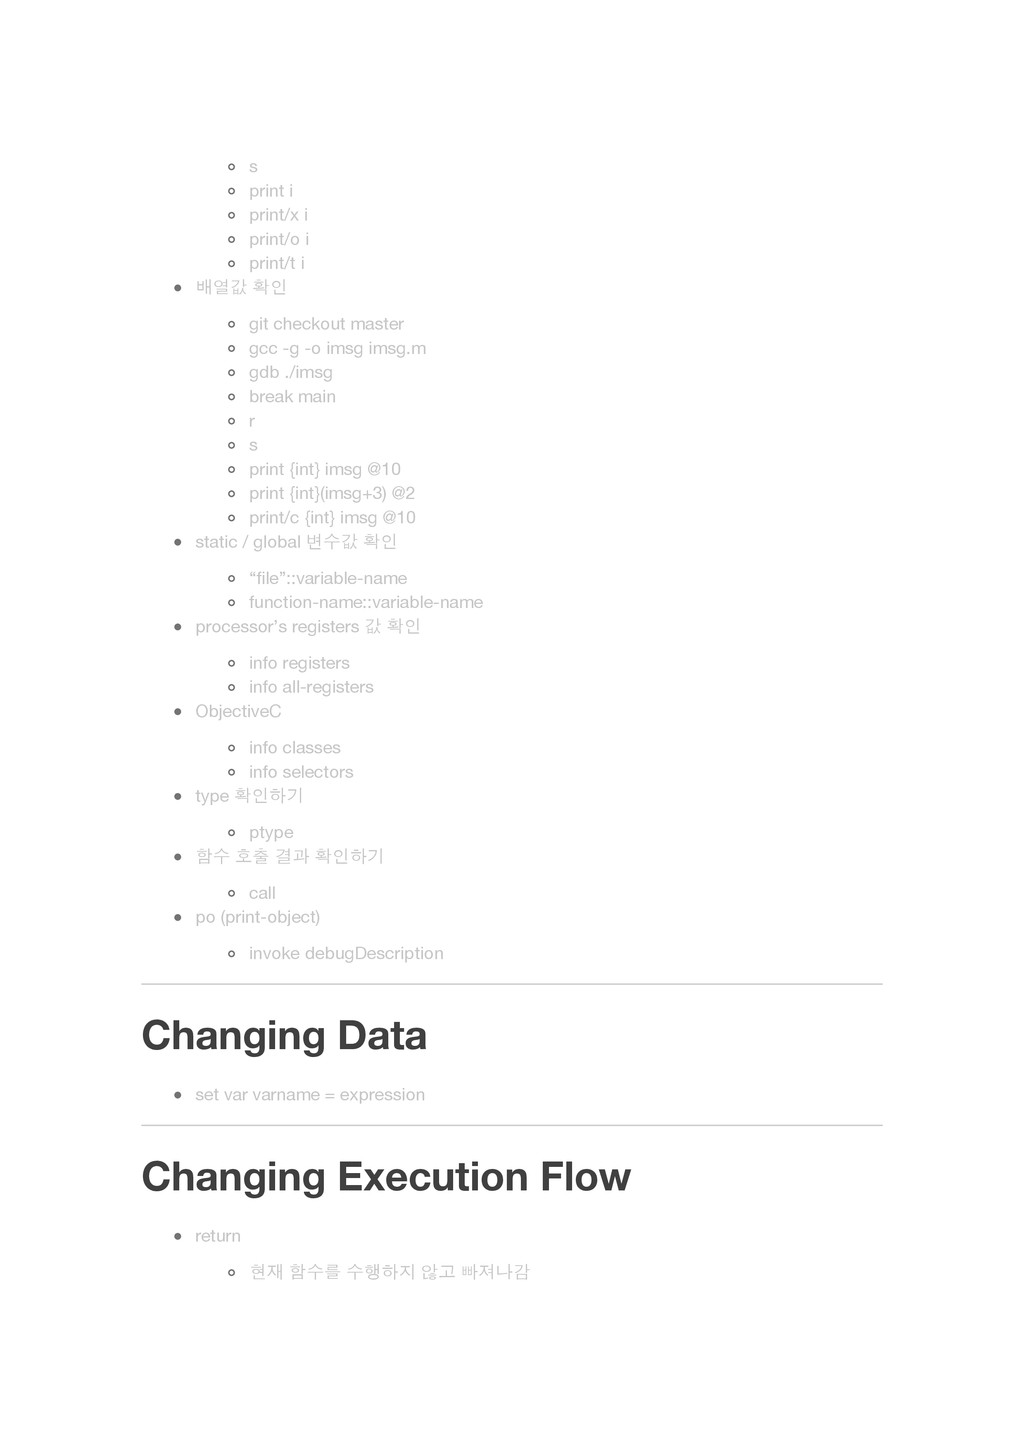
확인 git checkout master gcc -g -o imsg imsg.m gdb ./imsg break main r s print {int} imsg @10 print {int}(imsg+3) @2 print/c {int} imsg @10 static / global 변수값 확인 “file”::variable-name function-name::variable-name processor’s registers 값 확인 info registers info all-registers ObjectiveC info classes info selectors type 확인하기 ptype 함수 호출 결과 확인하기 call po (print-object) invoke debugDescription Changing Data set var varname = expression Changing Execution Flow return 현재 함수를 수행하지 않고 빠져나감
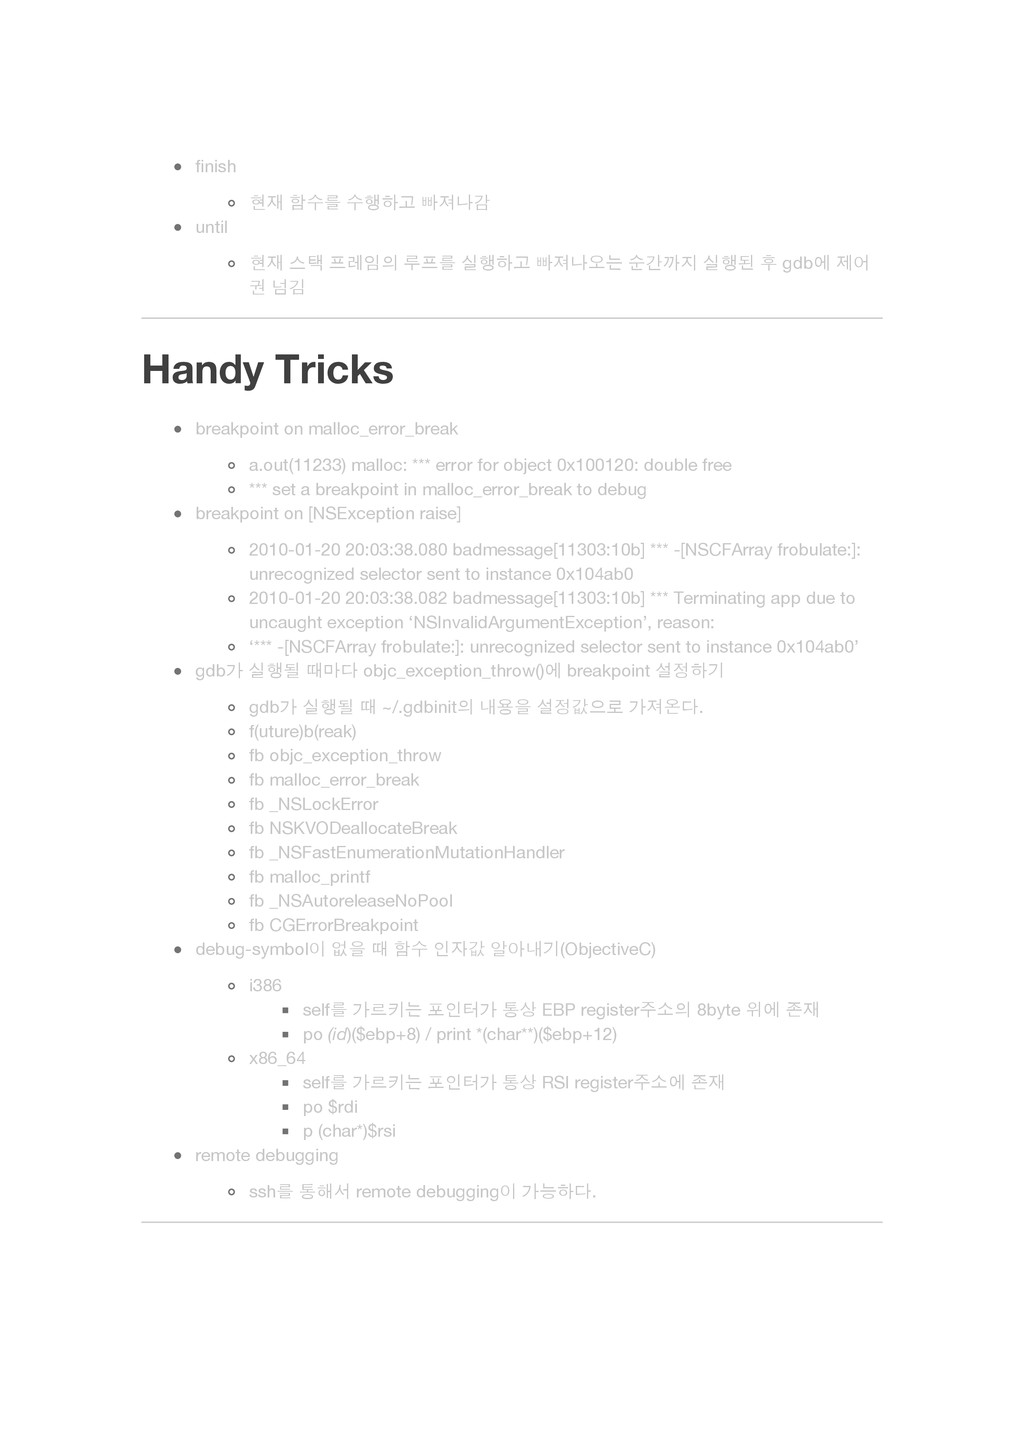
실행하고 빠져나오는 순간까지 실행된 후 gdb에 제어 권 넘김 Handy Tricks breakpoint on malloc_error_break a.out(11233) malloc: *** error for object 0x100120: double free *** set a breakpoint in malloc_error_break to debug breakpoint on [NSException raise] 2010-01-20 20:03:38.080 badmessage[11303:10b] *** -[NSCFArray frobulate:]: unrecognized selector sent to instance 0x104ab0 2010-01-20 20:03:38.082 badmessage[11303:10b] *** Terminating app due to uncaught exception ‘NSInvalidArgumentException’, reason: ‘*** -[NSCFArray frobulate:]: unrecognized selector sent to instance 0x104ab0’ gdb가 실행될 때마다 objc_exception_throw()에 breakpoint 설정하기 gdb가 실행될 때 ~/.gdbinit의 내용을 설정값으로 가져온다. f(uture)b(reak) fb objc_exception_throw fb malloc_error_break fb _NSLockError fb NSKVODeallocateBreak fb _NSFastEnumerationMutationHandler fb malloc_printf fb _NSAutoreleaseNoPool fb CGErrorBreakpoint debug-symbol이 없을 때 함수 인자값 알아내기(ObjectiveC) i386 self를 가르키는 포인터가 통상 EBP register주소의 8byte 위에 존재 po (id)($ebp+8) / print *(char**)($ebp+12) x86_64 self를 가르키는 포인터가 통상 RSI register주소에 존재 po $rdi p (char*)$rsi remote debugging ssh를 통해서 remote debugging이 가능하다.
만들기 불규칙적으로 발생하는 버그가 제일 까다롭다. 소스 코드 버전 관리 사용 Debugger techniques caveman debugging printf, NSLog gdb 공부하기 새로운 코드가 추가될 때마다, 디버거로 검증하기 For the More Curious: Core Files core file 프로그램이 비정상 동작으로 죽을 때, 프로그램이 죽을 때의 메모리 상태를 저장하 여 파일에 저장 gdb로 core file을 이용해서 프로그램이 죽은 환경을 살펴볼 수 있다. Mac OSX은 기본적으로 프로그램이 죽었을 때 core file을 생성하지 않는다. core file 생성되게 설정 ulimit -a ulimit -c unlimited ulimit -c 0 step9 (core file 생성되게 system 설정) git checkout step9 ulimit -c unlimited gcc -g -o assert assert.m ./assert “” /cores 밑에 core file이 생성되야 함 gdb ./assert /cores/core.*** where frame 3 assert (strlen(ook) > 0); step10 (프로그램상에서 core file 생성되게 설정) git checkout step10 ulimit -c 0 gcc -g -o assert2 assert2.m ./assert2 “”
frame 3 For the More Curious: Stripping debug symbol이 실행 파일에 포함될 경우 크기가 커진다. reverse-engineer 되기 쉽다. strip 명령어로 debug-symbol을 실행 파일에서 제거할 수 있다. cp assert2 stripped stip stripped ./stripped “” gdb ./stripped /core/core.*** gdb ./assert2 /core/core.*** atos 메모리 주소와 symbol을 연결해준다 ex> atos -o assert2 0x00001ca4 More Advanced GDB Commands : Threads info threads 현재 active 상태의 모든 thread 정보를 보여준다. thread 변경 thread 3 thread apply thread apply all where 다른 thread에 breakpoint를 걸고 싶을 때 thread apply thread#1 break … scheduler-locking