This talk will give you an overview how the SAP HANA QA team monitors a huge stack from the 2000 physical machines up to the 10,000 parallel running Python application processes, micro-service instances and batch processing jobs.
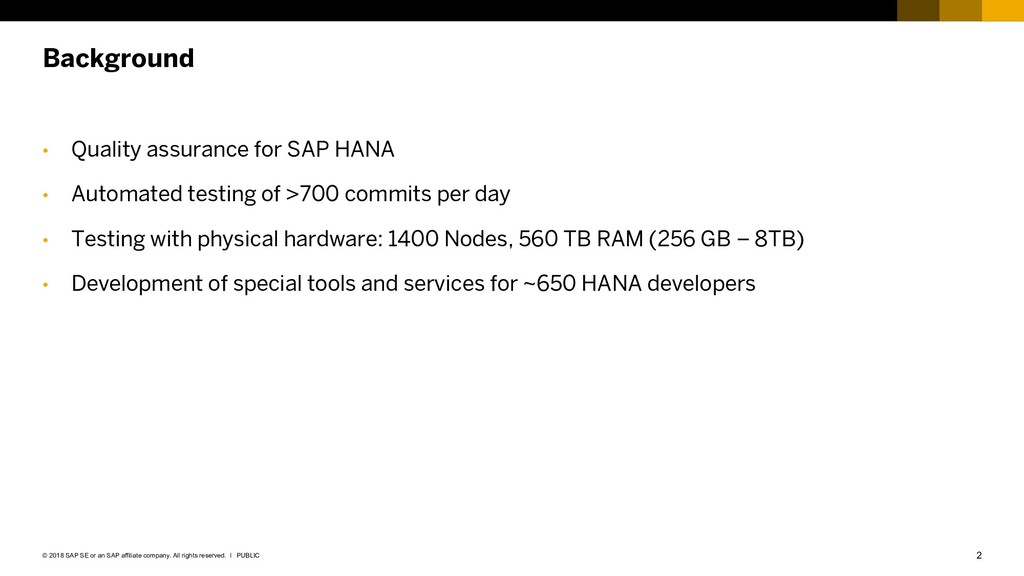
company. All rights reserved. ǀ • Quality assurance for SAP HANA • Automated testing of >700 commits per day • Testing with physical hardware: 1400 Nodes, 560 TB RAM (256 GB – 8TB) • Development of special tools and services for ~650 HANA developers Background
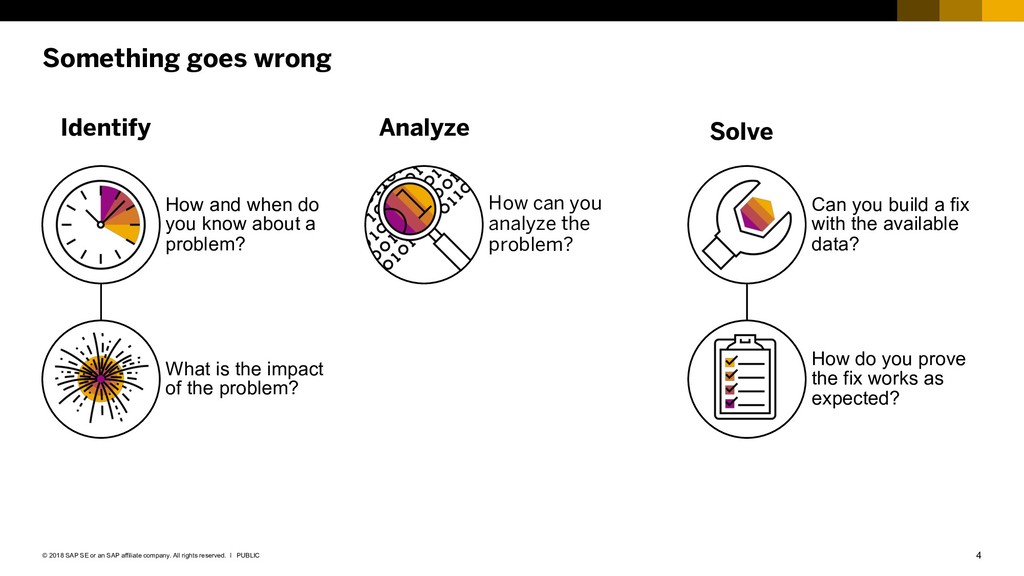
company. All rights reserved. ǀ How and when do you know about a problem? What is the impact of the problem? How can you analyze the problem? Can you build a fix with the available data? How do you prove the fix works as expected? Something goes wrong Identify Analyze Solve
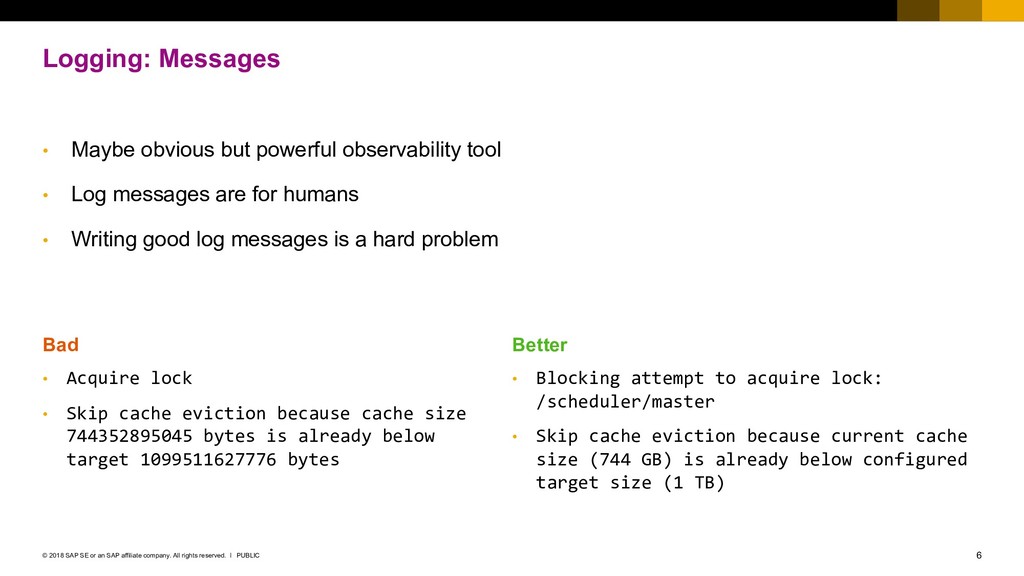
company. All rights reserved. ǀ • Maybe obvious but powerful observability tool • Log messages are for humans • Writing good log messages is a hard problem Logging: Messages Bad • Acquire lock • Skip cache eviction because cache size 744352895045 bytes is already below target 1099511627776 bytes Better • Blocking attempt to acquire lock: /scheduler/master • Skip cache eviction because current cache size (744 GB) is already below configured target size (1 TB)
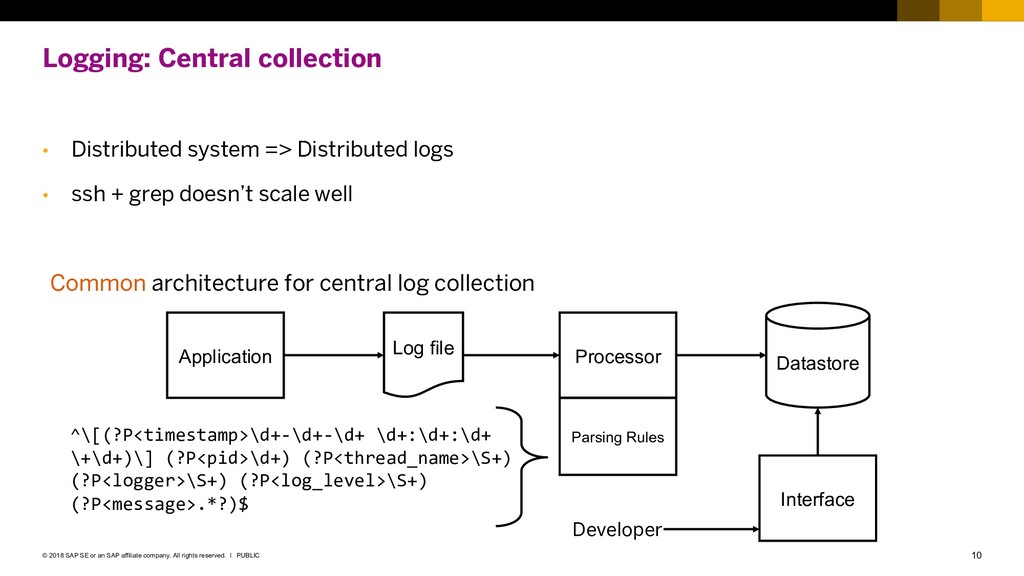
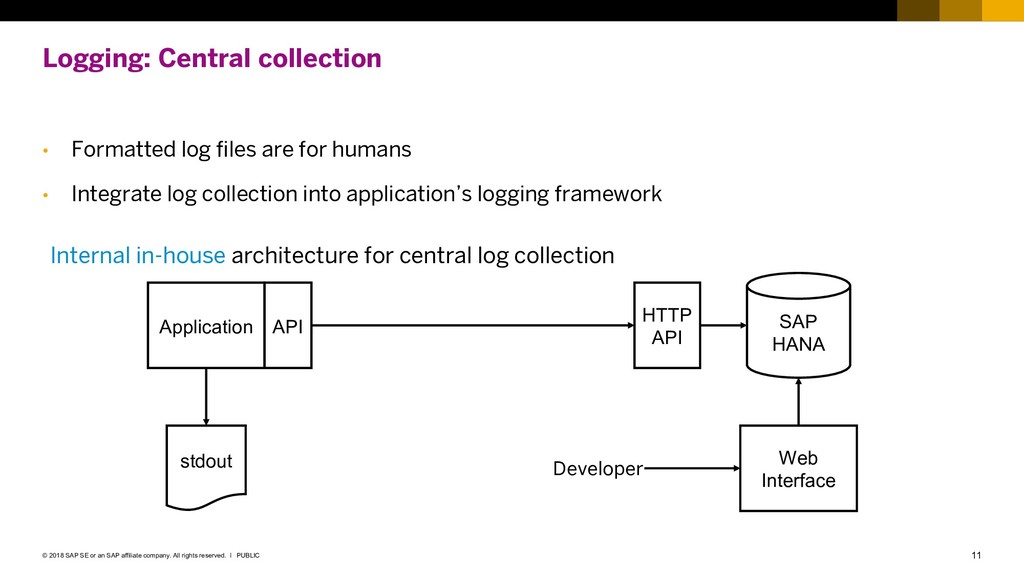
company. All rights reserved. ǀ • Formatted log files are for humans • Integrate log collection into application’s logging framework Logging: Central collection Application API SAP HANA stdout Developer Web Interface HTTP API Internal in-house architecture for central log collection
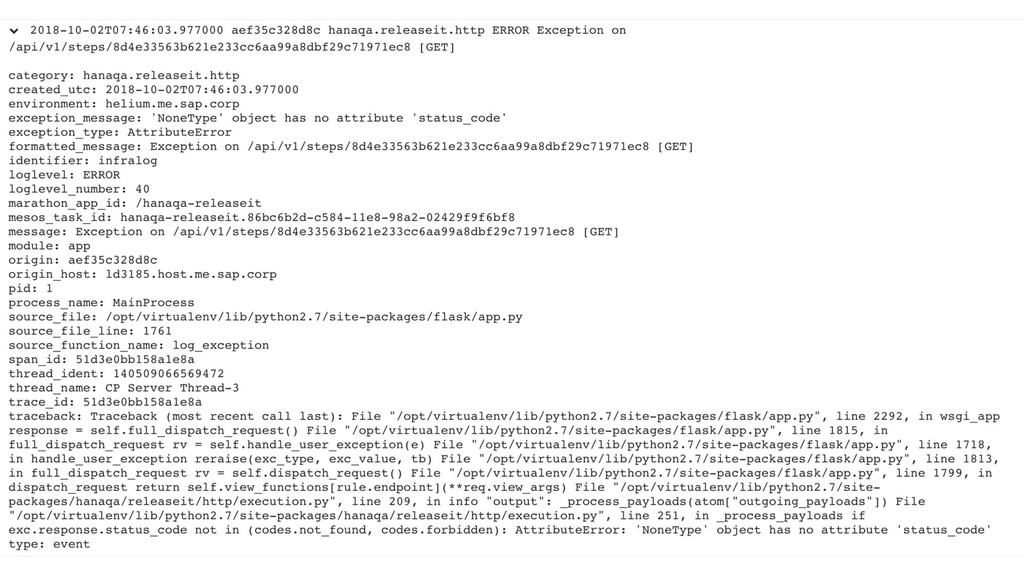
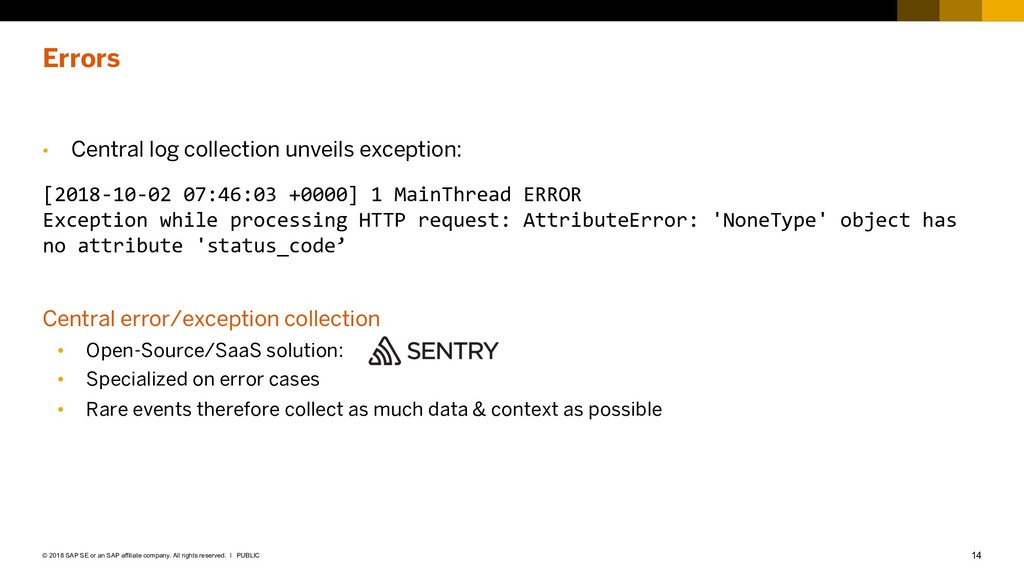
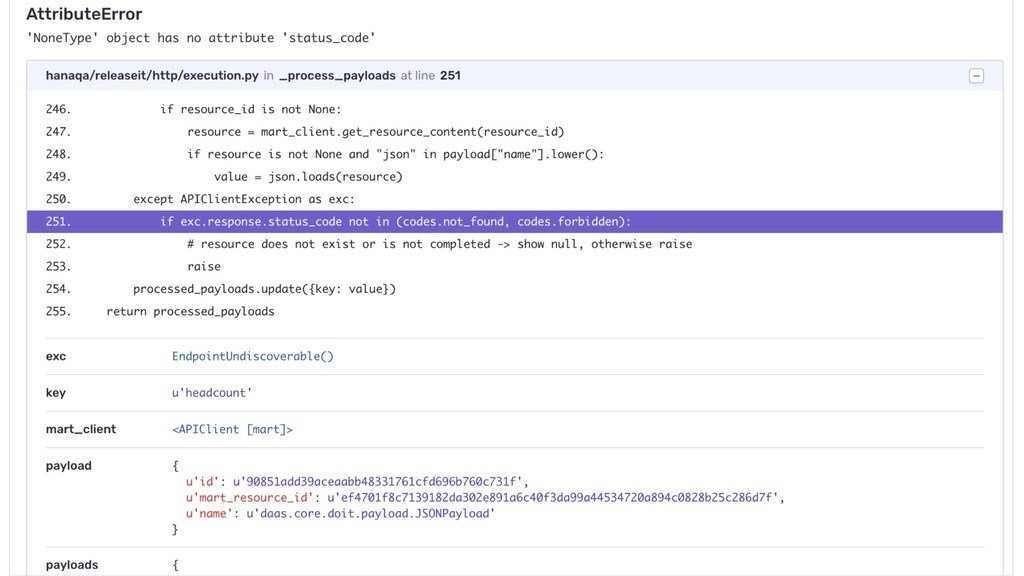
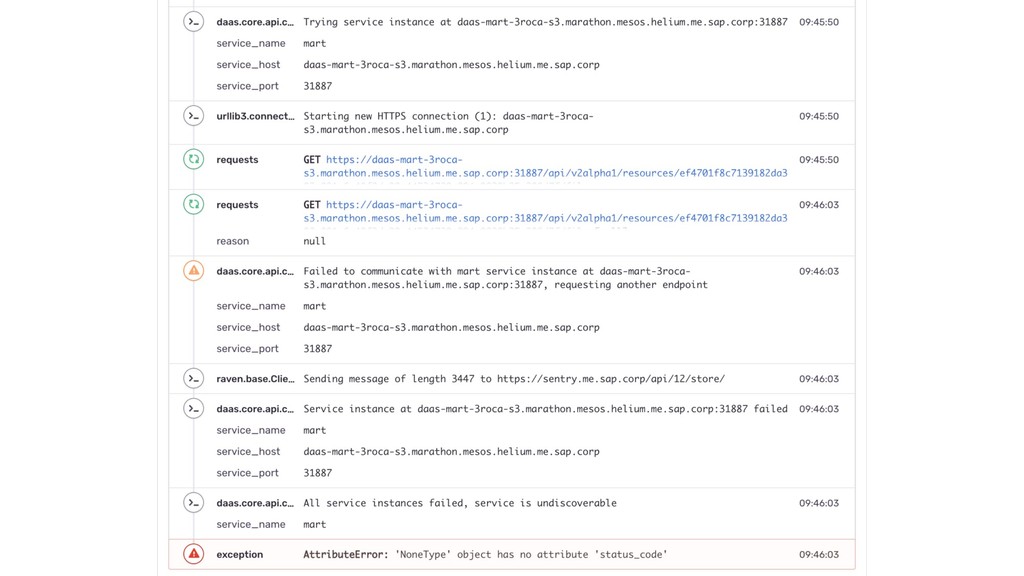
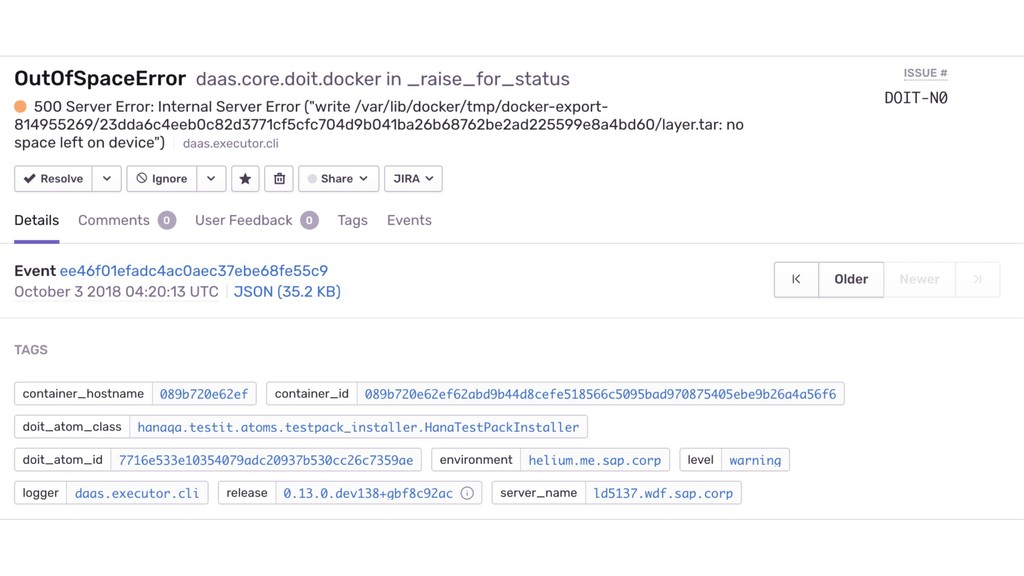
company. All rights reserved. ǀ • Central log collection unveils exception: [2018-10-02 07:46:03 +0000] 1 MainThread ERROR Exception while processing HTTP request: AttributeError: 'NoneType' object has no attribute 'status_code’ Central error/exception collection • Open-Source/SaaS solution: • Specialized on error cases • Rare events therefore collect as much data & context as possible Errors
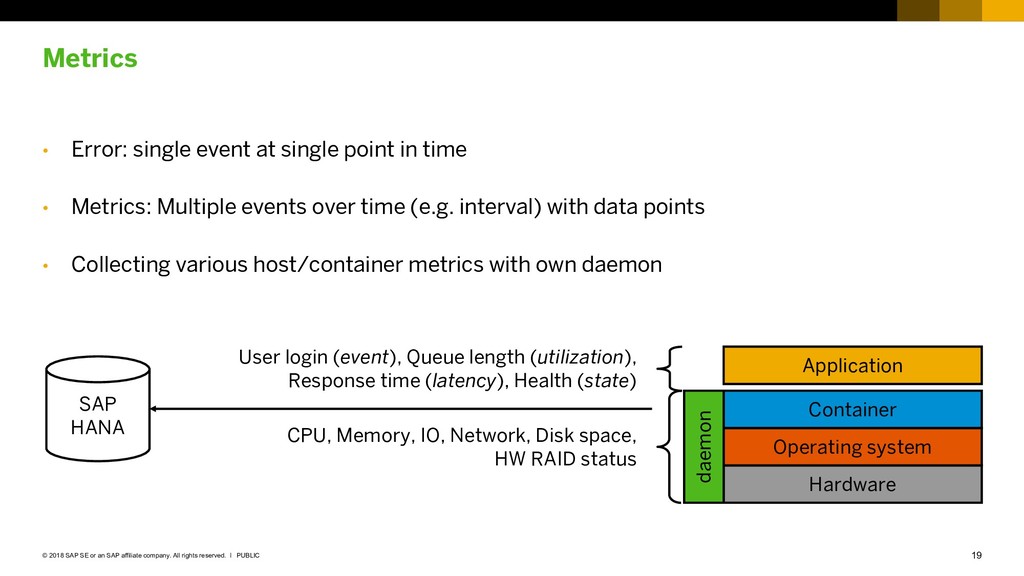
company. All rights reserved. ǀ Metrics • Error: single event at single point in time • Metrics: Multiple events over time (e.g. interval) with data points • Collecting various host/container metrics with own daemon Hardware Operating system Application Container CPU, Memory, IO, Network, Disk space, HW RAID status User login (event), Queue length (utilization), Response time (latency), Health (state) daemon SAP HANA
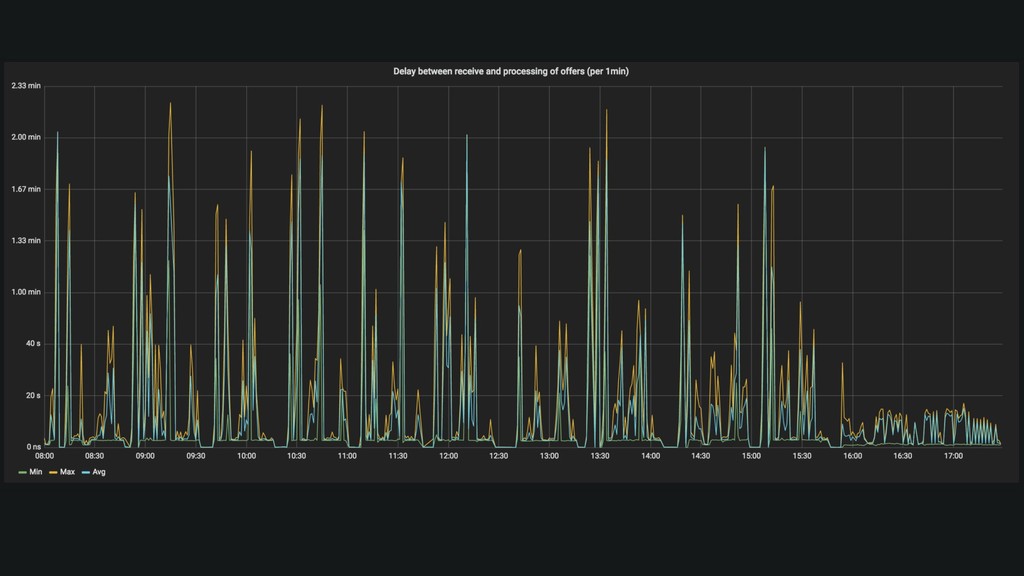
company. All rights reserved. ǀ Metrics • Without visualization metrics are often useless • Visualization and alerting with: • Enable developers to build dashboards • Dashboard per service/application maintained by developer • Allow ad-hoc queries for incident analysis • Prove problem resolution
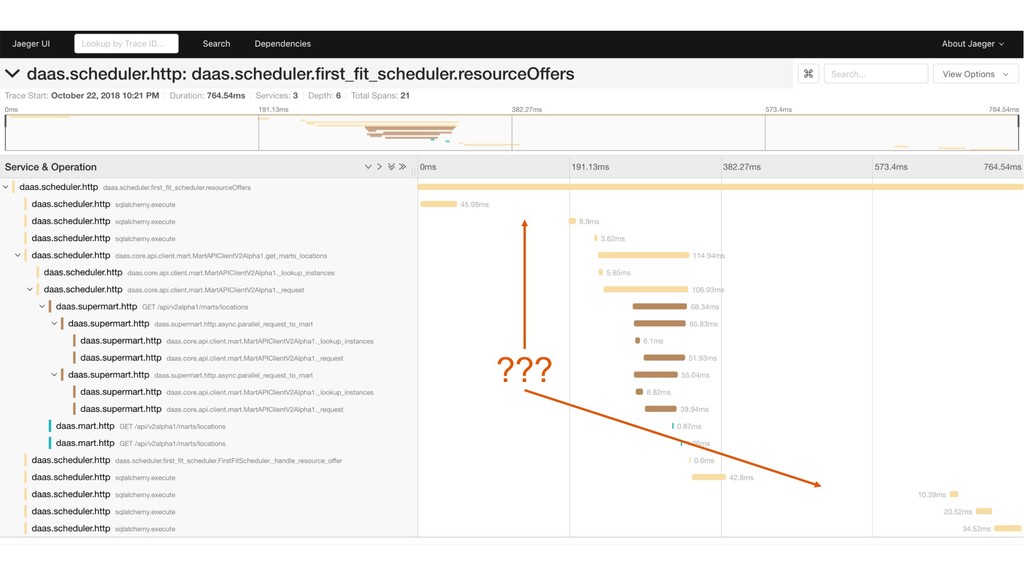
company. All rights reserved. ǀ • Typical monolith: application + database • Performance problem: Inspect application log & expensive statement log • Distributed system with various components • Performance problem: Inspect more logs and metrics • Pass unique id trough system and attach it to all events (timespans, logs and metrics) • On-going experiments with OpenTracing & jaeger • OpenTracing 2.0 is a major step for the Python API • Basic instrumentation revealed various areas for performance improvements • Visualization helps to understand time and application flow Distributed tracing
![Christoph Heer [email protected] @ChristophHeer Thank you. We are hiring! Python](https://files.speakerdeck.com/presentations/394a3f6048044a7b891f093a3d89e2d1/slide_23.jpg)