Upgrade to Pro — share decks privately, control downloads, hide ads and more …

Is it me, or the GIL?

Is it me, or the GIL?

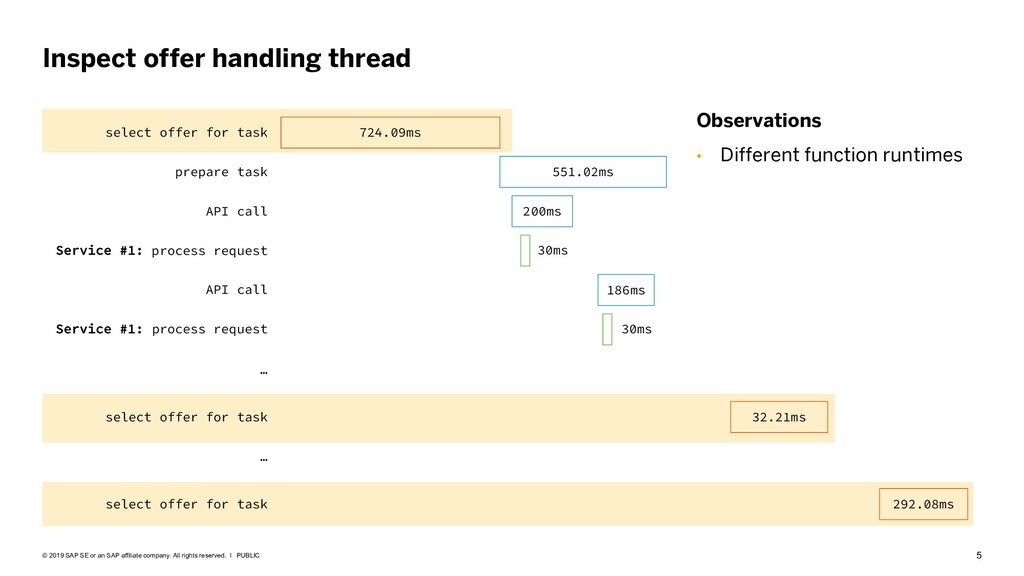
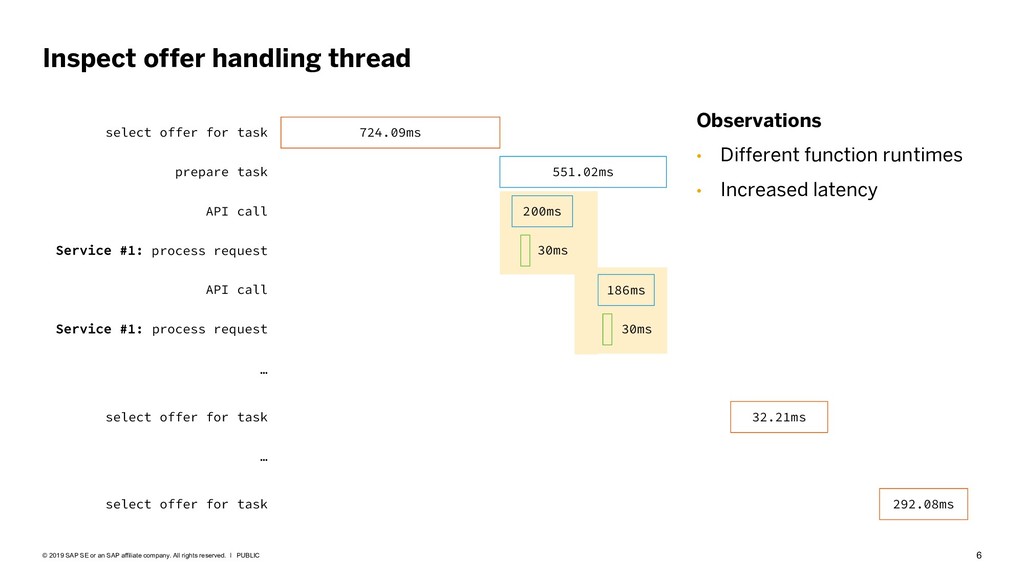
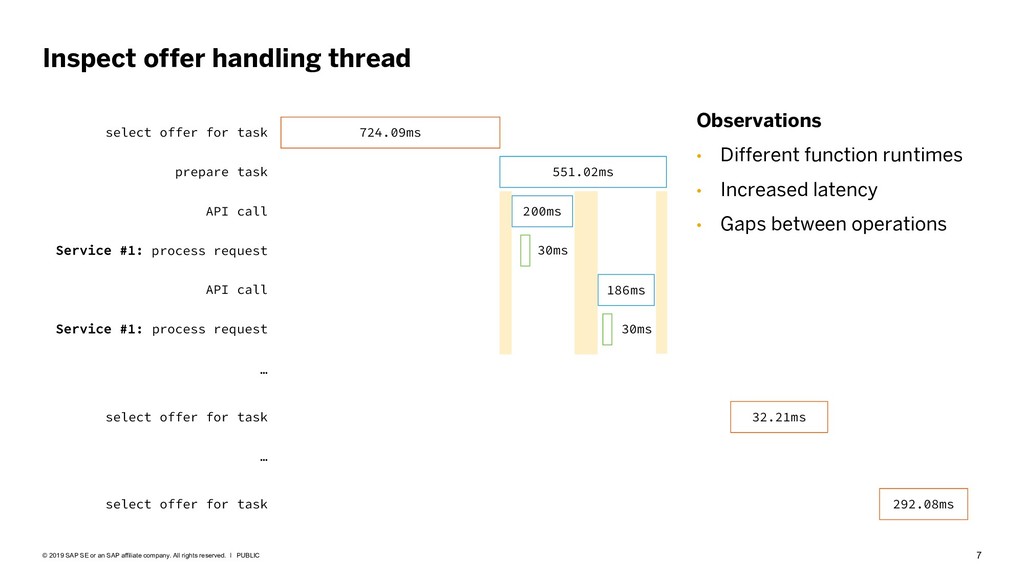
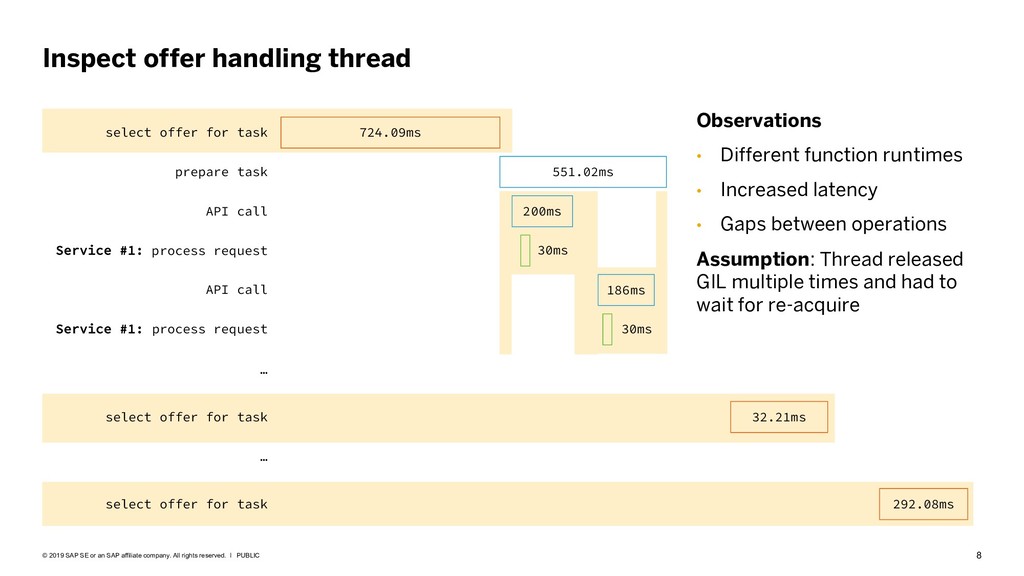
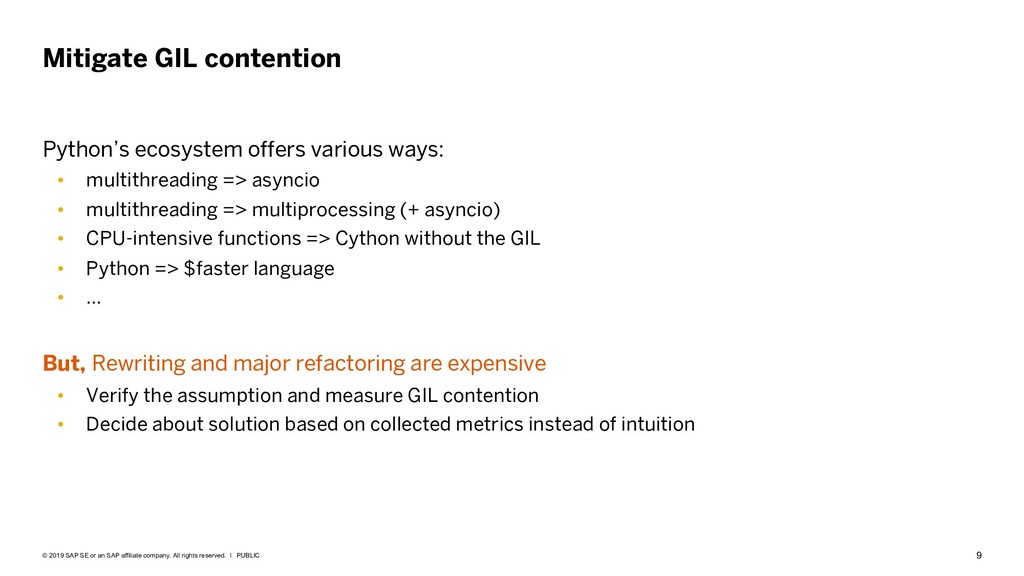
Python's Global Interpreter Lock is a friend and rival at the same time. We, as developers, can focus on the design and implementation of applications without the hassle of memory management. On the other side, we complain about the GIL as the limiting factor of performance sensitive applications. Therefore, it is common to refactor parts of systems when the system doesn't perform or scale enough anymore. The refactoring often includes the switch of the used concurrency paradigms like replacing multithreading with multiprocessing or asyncio. Another option is moving logic of CPU-bound workload into C extensions or a full rewrite in a "GIL-free" language. But how do you know that the GIL is the actual performance bottleneck?

While scaling and developing performance sensitive components in Python, my colleagues and I often also assumed the GIL as cause of our performance problems because it is a common and simple answer for this usually complex and varied problems. Instead of starting a rewrite or major refactoring, we took a step back and tried to prove our assumption. With the result that analyzing the impact of the GIL contention on the overall performance is a very interesting problem without common practices or easy usable set of tools that support Python developers. Within this talk, I will share and explain the methods and tools, which we use to analyze the relevance of the GIL on our application performance and how it helped us to stay focused on the actual problematic areas of our applications that required improvements to meet our performance goals.

Avatar for Christoph Heer

Christoph Heer

July 10, 2019
Tweet

More Decks by Christoph Heer

Other Decks in Technology

Transcript

  1. 2 PUBLIC © 2019 SAP SE or an SAP affiliate

    company. All rights reserved. ǀ • Quality assurance for SAP HANA • Automated testing of ~800 commits per day • Mainly testing with physical hardware: ~1600 machines, 610 TB RAM (256 GB – 8TB) • Development of optimized tools and services Background
  2. 3 PUBLIC © 2019 SAP SE or an SAP affiliate

    company. All rights reserved. ǀ Apache Mesos Physical Machine Physical Machine Physical Machine Physical Machine Compute Instance Compute Instance Datacenter #1 Datacenter #2 Cloud Provider #1 DB Service #1 Service #2 Test Scheduling resource offers & status messages task definitions Task Scheduler pymesos thread status update thread #1..N offer handling thread metrics thread HTTP thread #1..N sentry thread jaeger thread log shipping thread shared data structures like queues etc. Task Scheduler Observability Stack Physical Machine Physical Machine Physical Machine Physical Machine Compute Instance Compute Instance
  3. 4 PUBLIC © 2019 SAP SE or an SAP affiliate

    company. All rights reserved. ǀ Inspect offer handling thread 724.09ms select offer for task prepare task select offer for task select offer for task 551.02ms 32.21ms 200ms 186ms 292.08ms … … API call Service #1: process request API call Service #1: process request 30ms 30ms
  4. 5 PUBLIC © 2019 SAP SE or an SAP affiliate

    company. All rights reserved. ǀ Inspect offer handling thread 724.09ms select offer for task prepare task select offer for task select offer for task 551.02ms 32.21ms 200ms 186ms 292.08ms … … API call Service #1: process request API call Service #1: process request 30ms 30ms Observations • Different function runtimes
  5. 6 PUBLIC © 2019 SAP SE or an SAP affiliate

    company. All rights reserved. ǀ Inspect offer handling thread 724.09ms select offer for task prepare task select offer for task select offer for task 551.02ms 32.21ms 200ms 186ms 292.08ms … … API call Service #1: process request API call Service #1: process request 30ms 30ms Observations • Different function runtimes • Increased latency
  6. 7 PUBLIC © 2019 SAP SE or an SAP affiliate

    company. All rights reserved. ǀ Inspect offer handling thread 724.09ms select offer for task prepare task select offer for task select offer for task 551.02ms 32.21ms 200ms 186ms 292.08ms … … API call Service #1: process request API call Service #1: process request 30ms 30ms Observations • Different function runtimes • Increased latency • Gaps between operations
  7. 8 PUBLIC © 2019 SAP SE or an SAP affiliate

    company. All rights reserved. ǀ Inspect offer handling thread 724.09ms select offer for task prepare task select offer for task select offer for task 551.02ms 32.21ms 200ms 186ms 292.08ms … … API call Service #1: process request API call Service #1: process request 30ms 30ms Observations • Different function runtimes • Increased latency • Gaps between operations Assumption: Thread released GIL multiple times and had to wait for re-acquire
  8. 9 PUBLIC © 2019 SAP SE or an SAP affiliate

    company. All rights reserved. ǀ Python’s ecosystem offers various ways: • multithreading => asyncio • multithreading => multiprocessing (+ asyncio) • CPU-intensive functions => Cython without the GIL • Python => $faster language • … But, Rewriting and major refactoring are expensive • Verify the assumption and measure GIL contention • Decide about solution based on collected metrics instead of intuition Mitigate GIL contention
  9. 10 PUBLIC © 2019 SAP SE or an SAP affiliate

    company. All rights reserved. ǀ $ python3.7 Python 3.7.1 (default, Oct 22 2018, 13:16:18) [GCC] on linux Type "help", "copyright", "credits" or "license" for more information. >>> import sys >>> sys.get_gil_stats() Traceback (most recent call last): File "<stdin>", line 1, in <module> AttributeError: module 'sys' has no attribute 'get_gil_stats’ Look at the GIL
  10. 11 PUBLIC © 2019 SAP SE or an SAP affiliate

    company. All rights reserved. ǀ • Provides metrics about GIL contention • wait time • hold time • Additional context • Thread identifier/name • Python/C-Function • Trace/Request Id • Usable for productive environments • Low overhead • Dynamically attachable to running Python processes • Integration into existing observability stack Wish list
  11. 12 PUBLIC © 2019 SAP SE or an SAP affiliate

    company. All rights reserved. ǀ A Zoomable Interactive Python Thread Visualization by Dave Beazley • Understanding the Python GIL (PyCon 2010) • Adjustments in CPython 2.6 to store events about the GIL Related work and instrumentation approaches
  12. 13 PUBLIC © 2019 SAP SE or an SAP affiliate

    company. All rights reserved. ǀ Thread Concurrency Visualization by PyCharm • Visualizes and reveals locking issues but omits GIL Related work and instrumentation approaches
  13. 14 PUBLIC © 2019 SAP SE or an SAP affiliate

    company. All rights reserved. ǀ gil_load by Chris Billington • Statistical profiler based on sampling states of all python threads every 50ms • Installable python package (not Python 3.7 compatible yet) Related work and instrumentation approaches $ python example_two.py [2019-06-21 23:23:20] GIL load: 1.00 (1.00, 1.00, 1.00) [2019-06-21 23:23:21] GIL load: 1.00 (1.00, 1.00, 1.00) [2019-06-21 23:23:23] GIL load: 1.00 (1.00, 1.00, 1.00) [2019-06-21 23:23:23] GIL load: 1.00 (1.00, 1.00, 1.00) [2019-06-21 23:23:25] GIL load: 1.00 (1.00, 1.00, 1.00) [2019-06-21 23:23:26] GIL load: 1.00 (1.00, 1.00, 1.00) [2019-06-21 23:23:27] GIL load: 1.00 (1.00, 1.00, 1.00)
  14. 15 PUBLIC © 2019 SAP SE or an SAP affiliate

    company. All rights reserved. ǀ py-spy by Ben Frederickson • Promising sampling profiler in Rust for Python applications • Includes GIL utilization metric but no breakdown into usage per thread Related work and instrumentation approaches
  15. 16 PUBLIC © 2019 SAP SE or an SAP affiliate

    company. All rights reserved. ǀ “There is no magic GIL performance analysis tool” a sad Python developer
  16. 17 PUBLIC © 2019 SAP SE or an SAP affiliate

    company. All rights reserved. ǀ • Base: SystemTap • Analyze Linux applications by attaching handlers to events • CPython 3.6 introduced DTrace/SystemTap support & markers • function__entry • function__return • Great documentation: Instrumenting CPython with DTrace and SystemTap • Pre-build Linux packages often compiled without: --with-dtrace • No GIL related markers Creating a tool that reveals the GIL
  17. 18 PUBLIC © 2019 SAP SE or an SAP affiliate

    company. All rights reserved. ǀ diff --git a/Python/ceval_gil.h b/Python/ceval_gil.h index ef5189068e..aecd3c99aa 100644 @@ static void drop_gil(PyThreadState *tstate) MUTEX_LOCK(_PyRuntime.ceval.gil.mutex); _Py_atomic_store_relaxed(&_PyRuntime.ceval.gil.locked, 0); + if (PyDTrace_GIL_DROP_ENABLED()) + PyDTrace_GIL_DROP(PyThread_get_thread_ident()); + COND_SIGNAL(_PyRuntime.ceval.gil.cond); MUTEX_UNLOCK(_PyRuntime.ceval.gil.mutex); @@ static void take_gil(PyThreadState *tstate) if (tstate == NULL) Py_FatalError("take_gil: NULL tstate"); + if (PyDTrace_GIL_CLAIM_ENABLED()) + PyDTrace_GIL_CLAIM(PyThread_get_thread_ident()); + err = errno; MUTEX_LOCK(_PyRuntime.ceval.gil.mutex); Adding SystemTap markers about the GIL Only thread identifiers as argument as there is currently no C API for accessing user- defined thread name
  18. 19 PUBLIC © 2019 SAP SE or an SAP affiliate

    company. All rights reserved. ǀ • Attach probes (event handlers) to GIL markers • Calculate timing of transitions • claim - acquired - drop • Store measurements in SystemTap statistical aggregate type per thread probe process("libpython3.7m.so.1.0").mark("gil_claim") { last_timestamp[$arg1] = gettimeofday_ns(); } probe process("libpython3.7m.so.1.0").mark("gil_acquired") { wait_time_ns = gettimeofday_ns() - last_timestamp[$arg1]; gil_wait_aggregate[$arg1] <<< wait_time_ns; last_timestamp[$arg1] = gettimeofday_ns(); } probe process("libpython3.7m.so.1.0").mark("gil_drop") { hold_time_ns = gettimeofday_ns() - last_timestamp[$arg1]; gil_hold_aggregate[$arg1] <<< hold_time_ns; } Measure time between GIL markers
  19. 20 PUBLIC © 2019 SAP SE or an SAP affiliate

    company. All rights reserved. ǀ • Handlers for start and end of tracing session • Report GIL wait and hold time as sum and histogram probe begin {println("Start tracing of Python GIL probes")} probe end { println("Terminate tracing") println("Summary (all time measurements in ns)") foreach (thread in gil_wait_aggregate) { printf("Python Thread %d\n", thread) printf( "Aggregated GIL wait time: %d\n", @sum(gil_wait_aggregate[thread]) ) printf( "Aggregated GIL hold time: %d\n", @sum(gil_hold_aggregate[thread]) ) printf("GIL wait latency\n") println(@hist_log(gil_wait_aggregate[thread])) printf("GIL hold time\n") println(@hist_log(gil_hold_aggregate[thread])) } } Produce summary of collected data
  20. 21 PUBLIC © 2019 SAP SE or an SAP affiliate

    company. All rights reserved. ǀ Summary (all time measurements in ns) Python Thread 140604373862144 Aggregated GIL wait time: 1102539 Aggregated GIL hold time: 27794967 Python Thread 140604351805184 Aggregated GIL wait time: 452269 Aggregated GIL hold time: 1490119 Python Thread 140604343412480 Aggregated GIL wait time: 462690 Aggregated GIL hold time: 1382457 def io_work(n=150): while n > 0: n -= 1 time.sleep(0.1) def main(): io1 = Thread(name='io1', target=io_work) io2 = Thread(name='io2', target=io_work) io1.start() io2.start() io1.join() io2.join() Experiment 1: Process with 2 IO-bound threads App. runtime: 15064.3ms GIL Hold time: 29.7ms 0.20% of runtime GIL Wait time: 1.9ms 0.01% of runtime # MainThread # 1.10ms # 27.79ms # io1 # 0.45ms # 1.49ms # io2 # 0.46ms # 1.38ms
  21. 22 PUBLIC © 2019 SAP SE or an SAP affiliate

    company. All rights reserved. ǀ Summary (all time measurements in ns) Python Thread 140347214374656 Aggregated GIL wait time: 45613707 Aggregated GIL hold time: 28039210 Python Thread 140347192317696 Aggregated GIL wait time: 760017132 Aggregated GIL hold time: 2109572 Python Thread 140347116091136 Aggregated GIL wait time: 770118858 Aggregated GIL hold time: 1504611 Python Thread 140347107698432 Aggregated GIL wait time: 3816216 Aggregated GIL hold time: 15790884948 def io_work(n=150): while n > 0: n -= 1 time.sleep(0.1) def cpu_spin(): while True: pass def main(): io1 = Thread(name='io1', target=io_work) io2 = Thread(name='io2', target=io_work) cpu1 = Thread( name='cpu1', target=cpu_spin, daemon=True ) ... Experiment 2: CPU-bound thread App. runtime: 15822ms GIL hold time: 15821ms 99.99% of runtime GIL wait time: 1578ms 9.97% of runtime # MainThread # 45.61ms # 28.04ms # io1 # 760.02ms # 2.11ms # io2 # 770.01ms # 1.50ms # cpu1 # 3.81ms # 15790.88ms
  22. 23 PUBLIC © 2019 SAP SE or an SAP affiliate

    company. All rights reserved. ǀ Python Thread 140347116091136 # io2 GIL wait latency value |-------------------------------------------------- count 512 | 0 1024 | 0 2048 | 1 4096 | 0 8192 | 0 ~ 1048576 | 0 2097152 | 0 4194304 |@@@@@@@@@@@@@@@@@@@@@@@@@@@@@@@@@@@@@@@@@@@@@@@@@ 149 8388608 | 1 16777216 | 0 33554432 | 0 GIL hold time value |-------------------------------------------------- count 1024 | 0 2048 | 0 4096 |@@@@@@@@@@@ 34 8192 |@@@@@@@@@@@@@@@@@@@@@@@@@@@@@@@@@@@@@@ 115 16384 | 0 32768 | 1 65536 | 1 Python Thread 140347192317696 # io1 GIL wait latency value |-------------------------------------------------- count 512 | 0 1024 | 0 2048 | 1 4096 | 0 8192 | 0 ~ 1048576 | 0 2097152 | 0 4194304 |@@@@@@@@@@@@@@@@@@@@@@@@@@@@@@@@@@@@@@@@@@@@@@@@@@ 150 8388608 | 0 16777216 | 0 GIL hold time value |-------------------------------------------------- count 1024 | 0 2048 | 0 4096 |@@@@@@@@@@@@@@ 42 8192 |@@@@@@@@@@@@@@@@@@@@@@@@@@@@@@@@@@ 103 16384 | 1 32768 | 2 65536 | 2 131072 | 0 262144 | 1 Experiment 2: GIL wait latency for IO threads Stable wait latency between 4 – 8ms
  23. 24 PUBLIC © 2019 SAP SE or an SAP affiliate

    company. All rights reserved. ǀ Experiment 2: Evaluation >>> import sys >>> sys.getswitchinterval() 0.005 • switchinterval defines the grace period before a waiting thread requests GIL drop • GIL-holding thread may keep the GIL longer due to • long-running bytecode operation • external C function • GIL contention affects overall application performance • Additional 5ms latency on each GIL acquire attempt after one blocking IO operation
  24. 25 PUBLIC © 2019 SAP SE or an SAP affiliate

    company. All rights reserved. ǀ • Plan • Deploy container with customized CPython and SystemTap • Attach to process • Get clear and precise insides about GIL contention • Relativity • Deploy container with customized CPython • Install SystemTap on host with kernel sources, compiler toolchain etc. • Copy libpython3.7m.so.1.0 from container into host filesystem • Attach to process = Load custom kernel extension with your systemtap handlers • Get huge text file with report Analyze production application with SystemTap
  25. 26 PUBLIC © 2019 SAP SE or an SAP affiliate

    company. All rights reserved. ǀ Result: Analysis of productive task scheduler Observation period: 120091.89ms GIL hold time: 105680.91ms 88.00% of timeframe GIL wait time: 352997.64ms 293.94% of timeframe • Proved, our application suffers from GIL contention • More questions: • Are there threads that hold the GIL longer than 5ms? • If yes, which functions are so expensive? • Is it possible to identify time-based patterns with higher contention? • Problem: With 31 threads the text report isn’t well understandable
  26. 27 PUBLIC © 2019 SAP SE or an SAP affiliate

    company. All rights reserved. ǀ Timelines are easier to understand 724.09ms select offer for task prepare task select offer for task select offer for task 551.02ms 32.21ms 200ms 186ms 292.08ms … … API call Service #1: process request API call Service #1: process request 30ms 30ms
  27. 28 PUBLIC © 2019 SAP SE or an SAP affiliate

    company. All rights reserved. ǀ Replace text report with some colorful charts Collect and store data with SystemTap Load data into Jupyter notebook Transform data Visualize data with Bokeh
  28. 29 PUBLIC © 2019 SAP SE or an SAP affiliate

    company. All rights reserved. ǀ
  29. 30 PUBLIC © 2019 SAP SE or an SAP affiliate

    company. All rights reserved. ǀ
  30. 31 PUBLIC © 2019 SAP SE or an SAP affiliate

    company. All rights reserved. ǀ
  31. 32 PUBLIC © 2019 SAP SE or an SAP affiliate

    company. All rights reserved. ǀ
  32. 33 PUBLIC © 2019 SAP SE or an SAP affiliate

    company. All rights reserved. ǀ metrics-collector 80075.77ms (75.77%) Distribution of GIL hold time
  33. 34 PUBLIC © 2019 SAP SE or an SAP affiliate

    company. All rights reserved. ǀ • Started replacing of an expensive C-Extension that doesn’t release the GIL • Increased sleep time of metrics-collector thread from 10sec to 120sec Fixing our GIL contention Before: Observation period: 120091.89ms GIL hold time: 105680.91ms 88.00% of timeframe GIL wait time: 352997.64ms 293.94% of timeframe After: Observation period: 300112.84ms GIL hold time: 130806.91ms 43.59% of timeframe GIL wait time: 240568.60ms 80.16% of timeframe • Without major refactoring the system is now able to utilize all available resources • Collected data will helps us to decide about coming architectural changes
  34. 35 PUBLIC © 2019 SAP SE or an SAP affiliate

    company. All rights reserved. ǀ • Bring toolset (systemtap script & visualization) in a public usable state • Enhance CPython for data collection with SystemTap • Integrate GIL markers into CPython • C API for thread names • Maybe collect and provide GIL metrics directly with CPython • sys.get_gil_stats() • Easier integration into existing observability tooling like distributed tracing • No need to compile custom kernel extensions in your productive environment • If you are also interested in that area, let’s talk! Many additional ideas
  35. 37 PUBLIC © 2019 SAP SE or an SAP affiliate

    company. All rights reserved. ǀ This presentation is licensed to the public under Attribution-NonCommercial-ShareAlike 4.0 International (CC BY-NC-SA 4.0). The information contained herein may be changed without prior notice. Some software products marketed by SAP SE and its distributors contain proprietary software components of other software vendors. National product specifications may vary. These materials are provided by SAP SE or an SAP affiliate company for informational purposes only, without representation or warranty of any kind, and SAP or its affiliated companies shall not be liable for errors or omissions with respect to the materials. The only warranties for SAP or SAP affiliate company products and services are those that are set forth in the express warranty statements accompanying such products and services, if any. Nothing herein should be construed as constituting an additional warranty. In particular, SAP SE or its affiliated companies have no obligation to pursue any course of business outlined in this document or any related presentation, or to develop or release any functionality mentioned therein. This document, or any related presentation, and SAP SE’s or its affiliated companies’ strategy and possible future developments, products, and/or platform directions and functionality are all subject to change and may be changed by SAP SE or its affiliated companies at any time for any reason without notice. The information in this document is not a commitment, promise, or legal obligation to deliver any material, code, or functionality. All forward-looking statements are subject to various risks and uncertainties that could cause actual results to differ materially from expectations. Readers are cautioned not to place undue reliance on these forward-looking statements, and they should not be relied upon in making purchasing decisions. SAP and other SAP products and services mentioned herein as well as their respective logos are trademarks or registered trademarks of SAP SE (or an SAP affiliate company) in Germany and other countries. All other product and service names mentioned are the trademarks of their respective companies. See http://global.sap.com/corporate-en/legal/copyright/index.epx for additional trademark information and notices. © 2019 SAP SE or an SAP affiliate company.