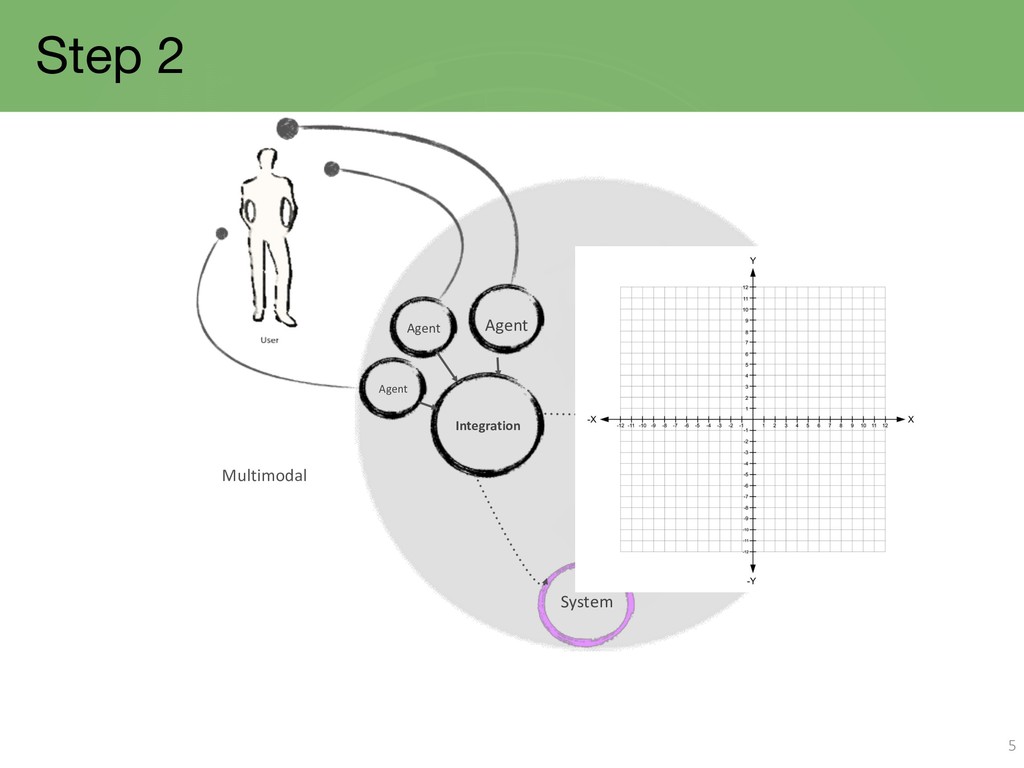
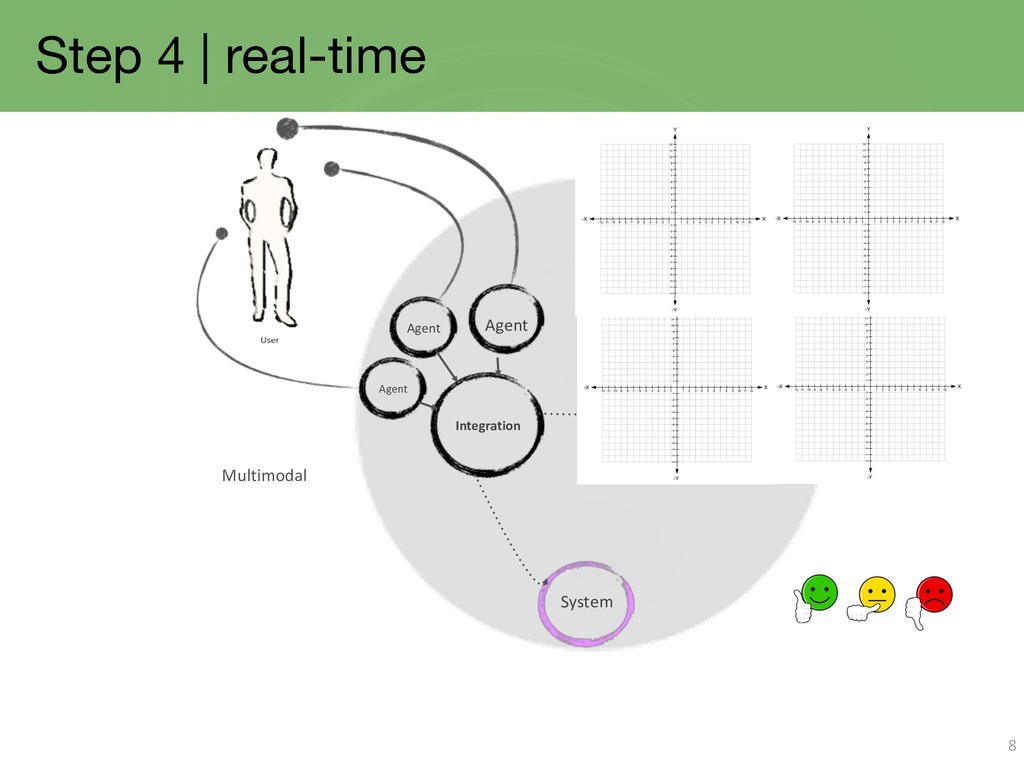
synchronize and fuse multiple sources of data • Task 1. Put the data in a vector space representation (such as PAD) • Task 2. Visualize the data on screen
Interaction (Input, Output) 2. Human factors 3. Interaction need Interfaces (Q1)(P1) 4. UI Design: structure, color, communication 5. User Experience: good and bad practices
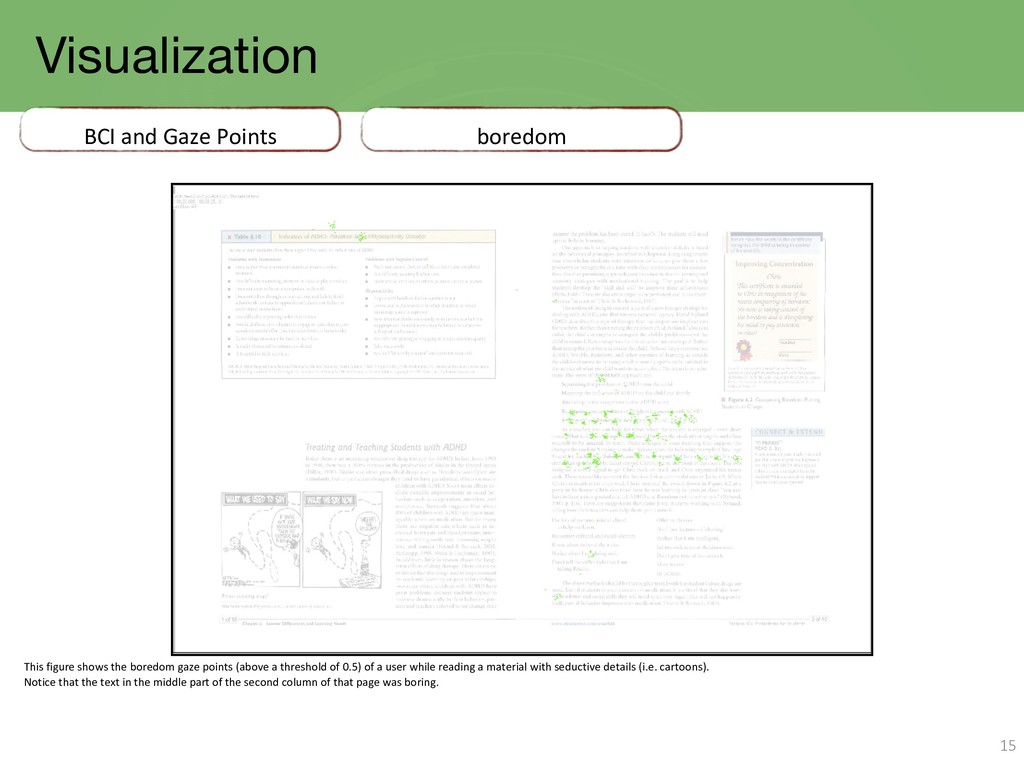
the boredom gaze points (above a threshold of 0.5) of a user while reading a material with seductive details (i.e. cartoons). Notice that the text in the middle part of the second column of that page was boring.
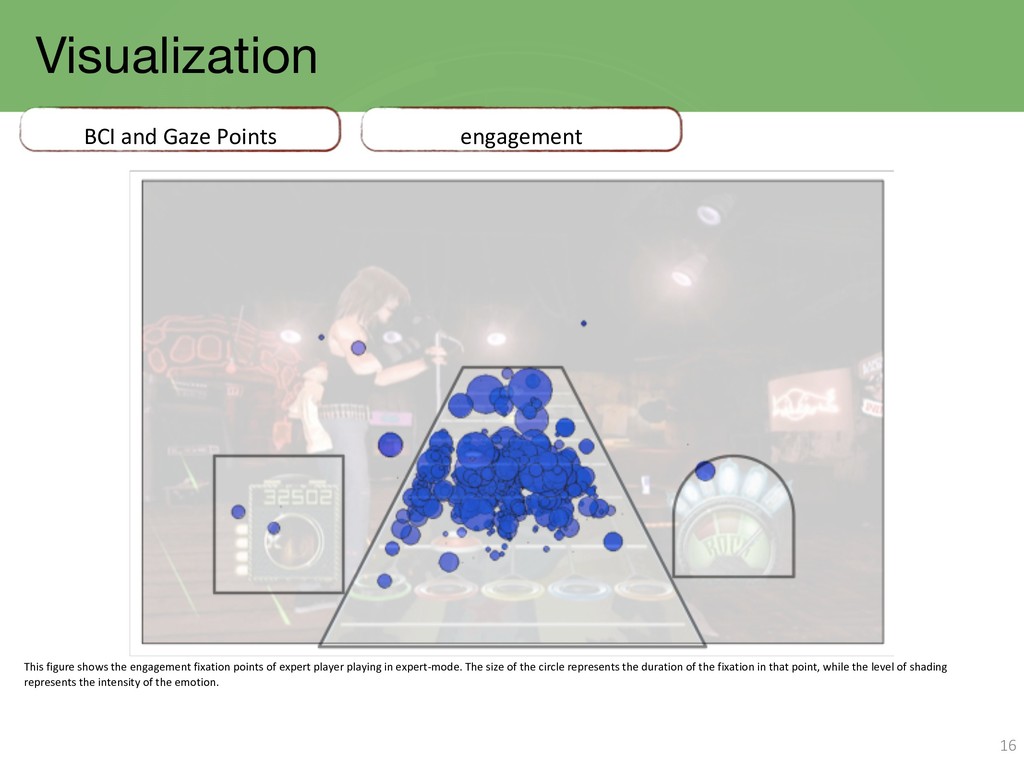
the engagement fixation points of expert player playing in expert-mode. The size of the circle represents the duration of the fixation in that point, while the level of shading represents the intensity of the emotion.
![SER594 Human-Computer Interaction Lecture 08 Review Javier Gonzalez-Sanchez, PhD [email protected]](https://files.speakerdeck.com/presentations/b04821622d0441ebba4f1b4de5d302ad/slide_0.jpg)
![SER594 – Human Computer Interaction Javier Gonzalez-Sanchez [email protected] Spring 2019](https://files.speakerdeck.com/presentations/b04821622d0441ebba4f1b4de5d302ad/slide_16.jpg)