The work of a UX Designer is to optimize the experience for users. But how can we determine if our designs are truly better? Unless we measure data, we can’t. In this talk, Jenny will share how she uses data to design products and services around the world.
She will discuss:
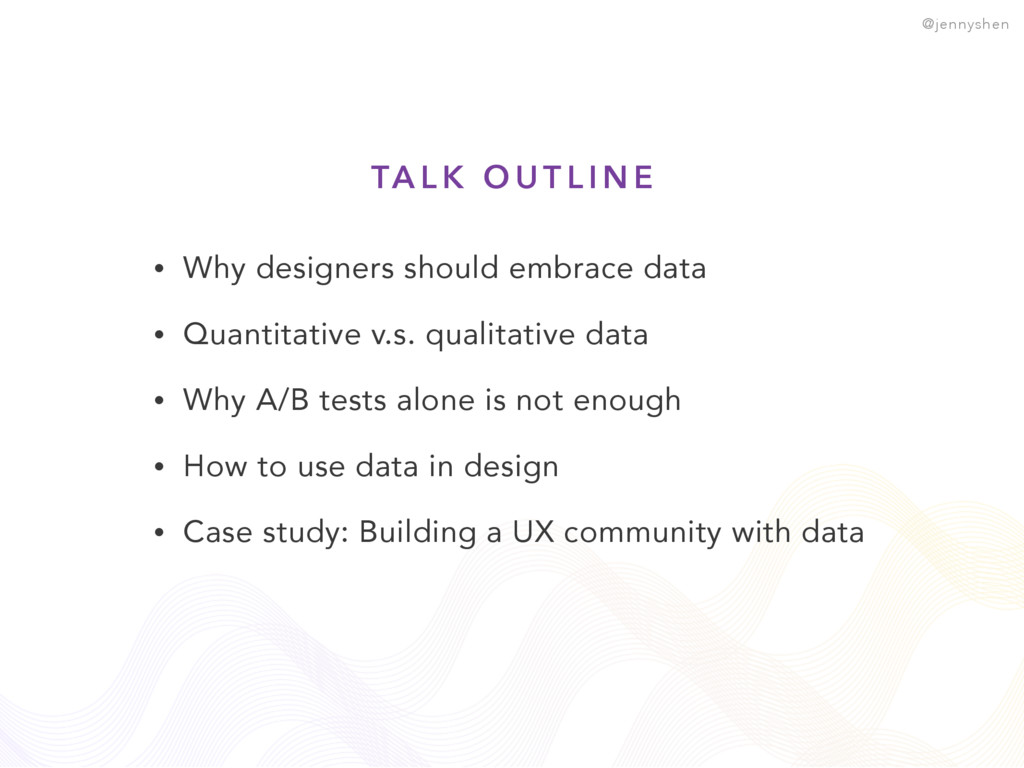
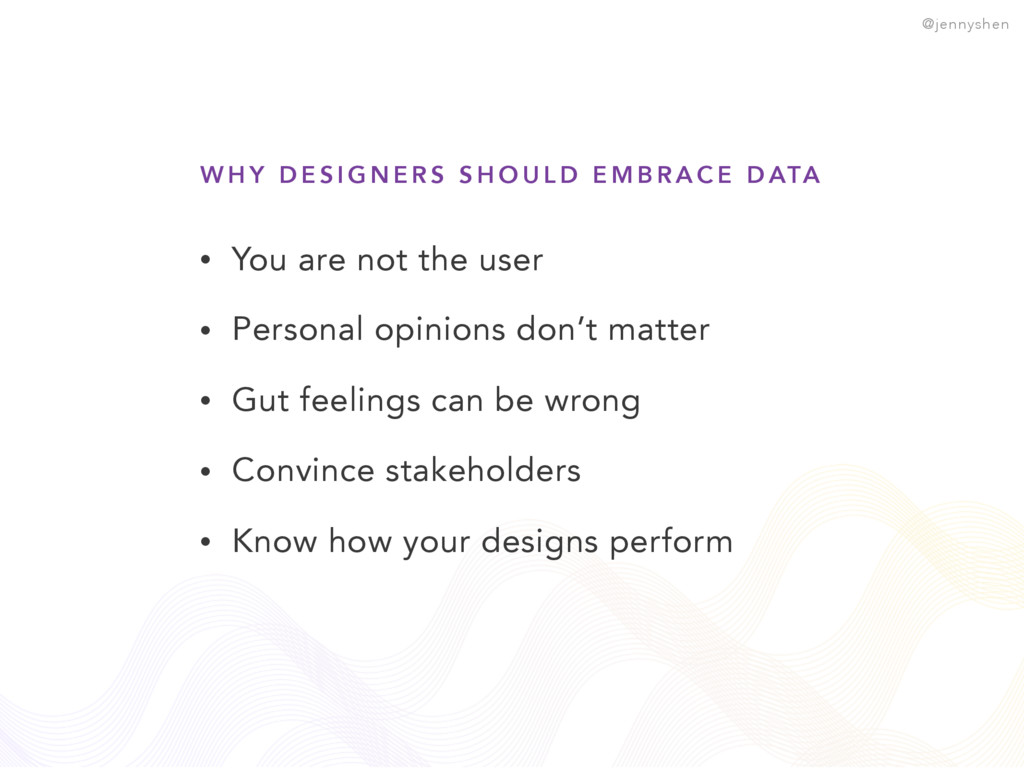
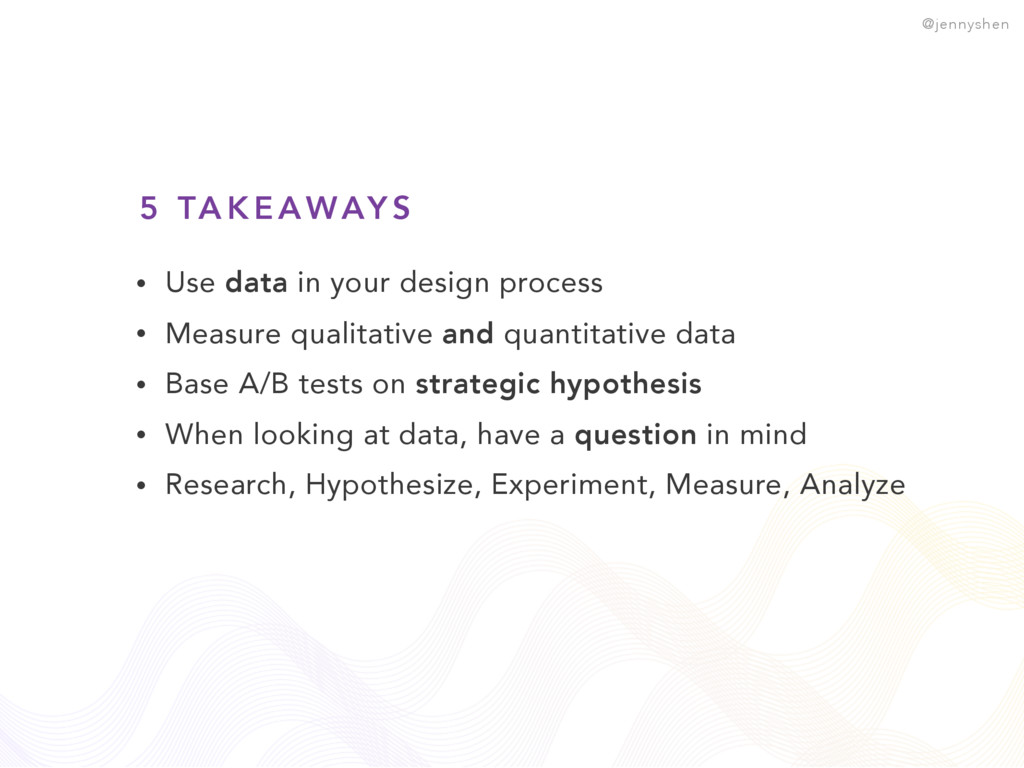
* Why designers should embrace data
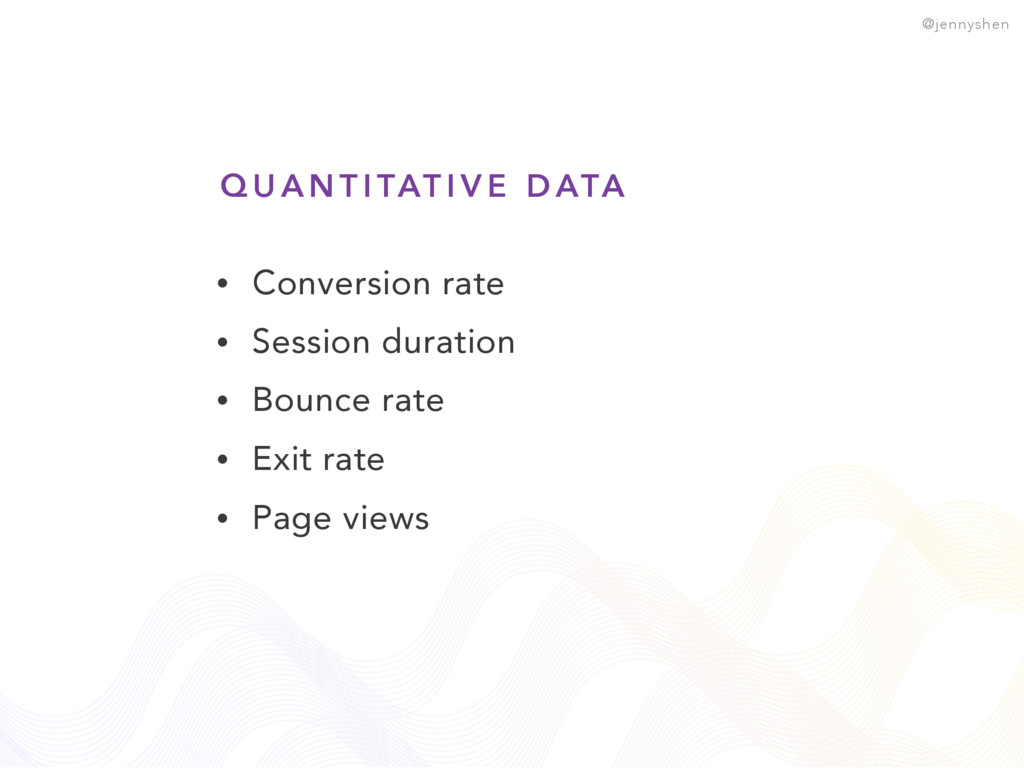
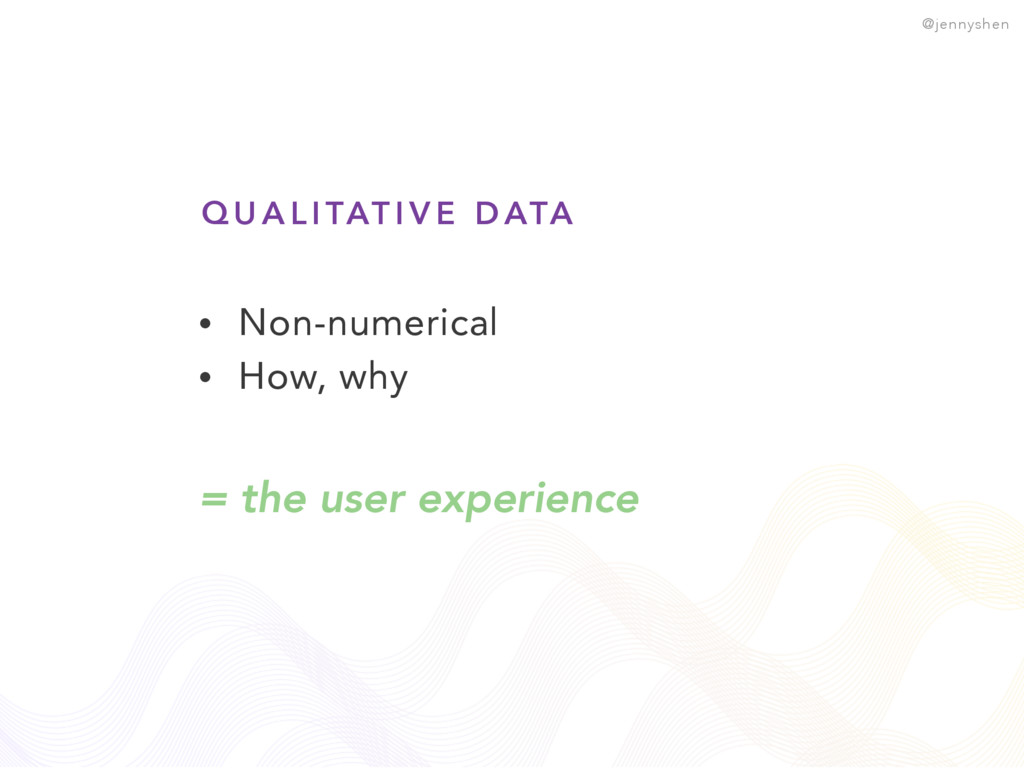
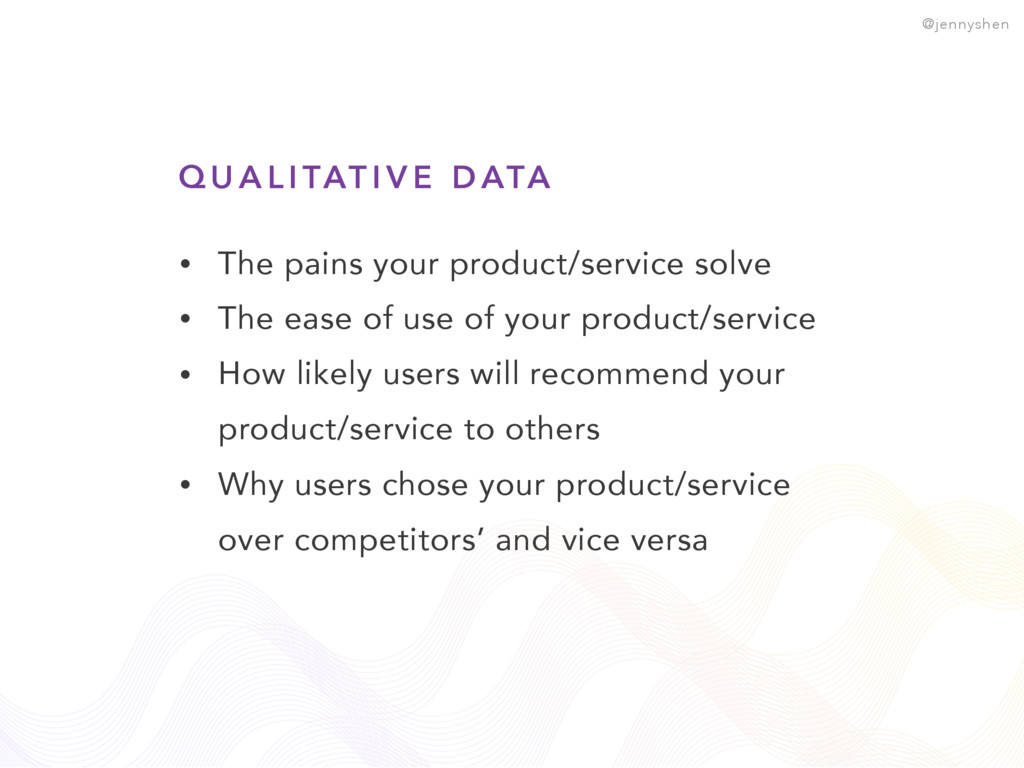
* Qualitative v.s. quantitative data
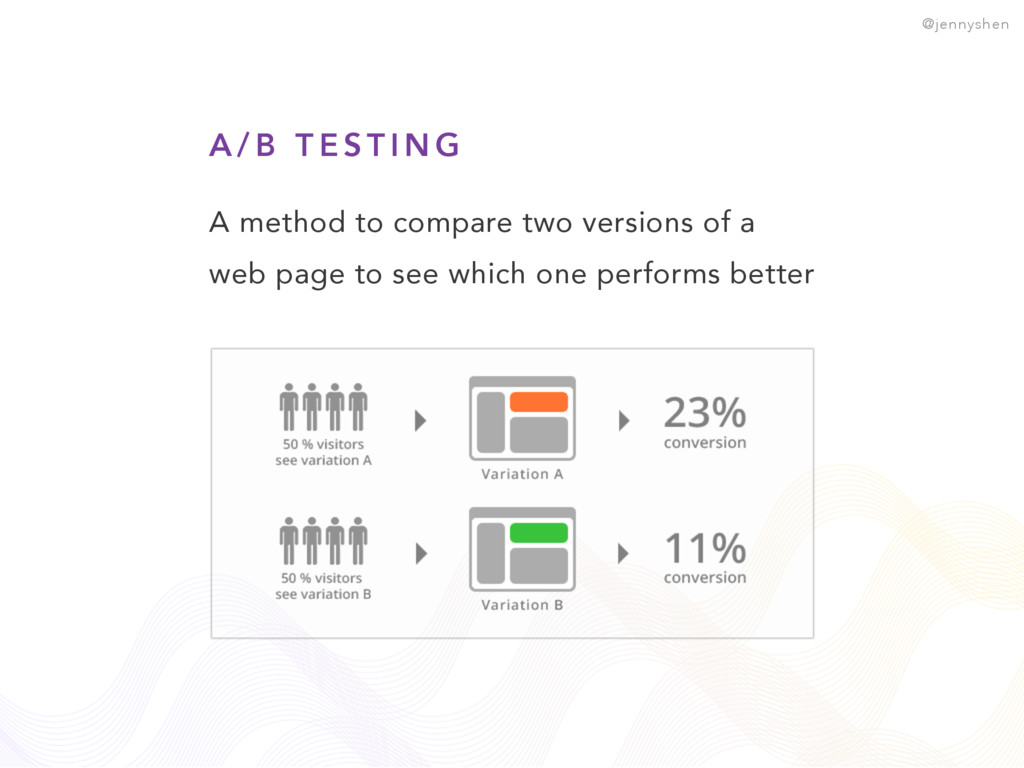
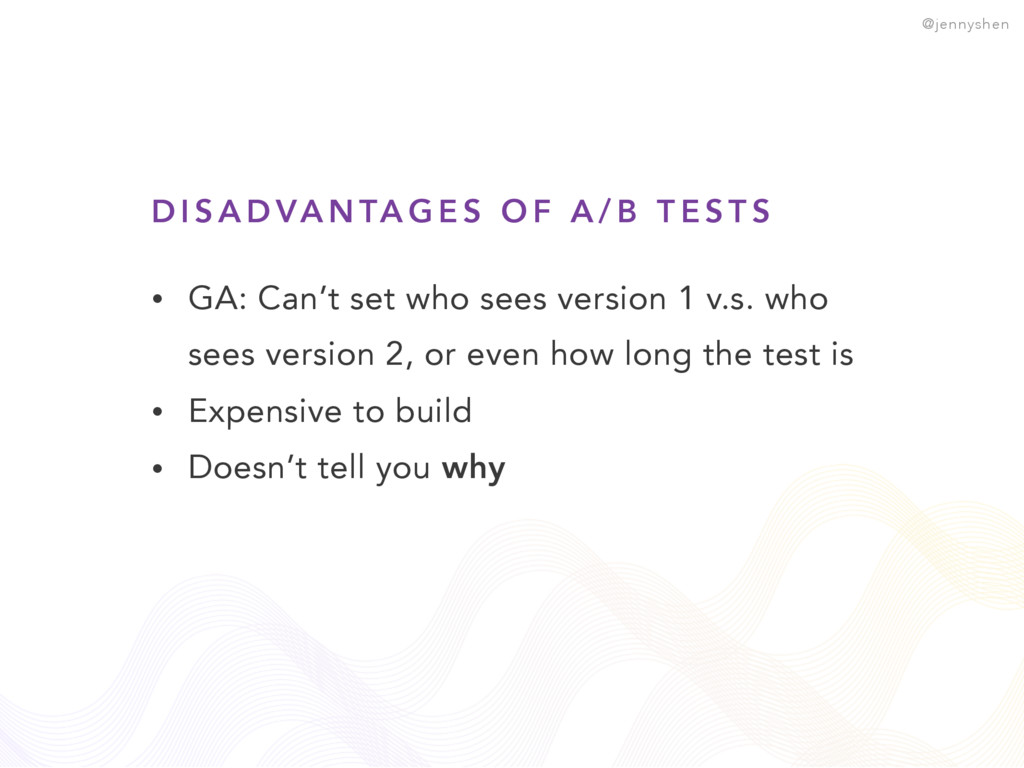
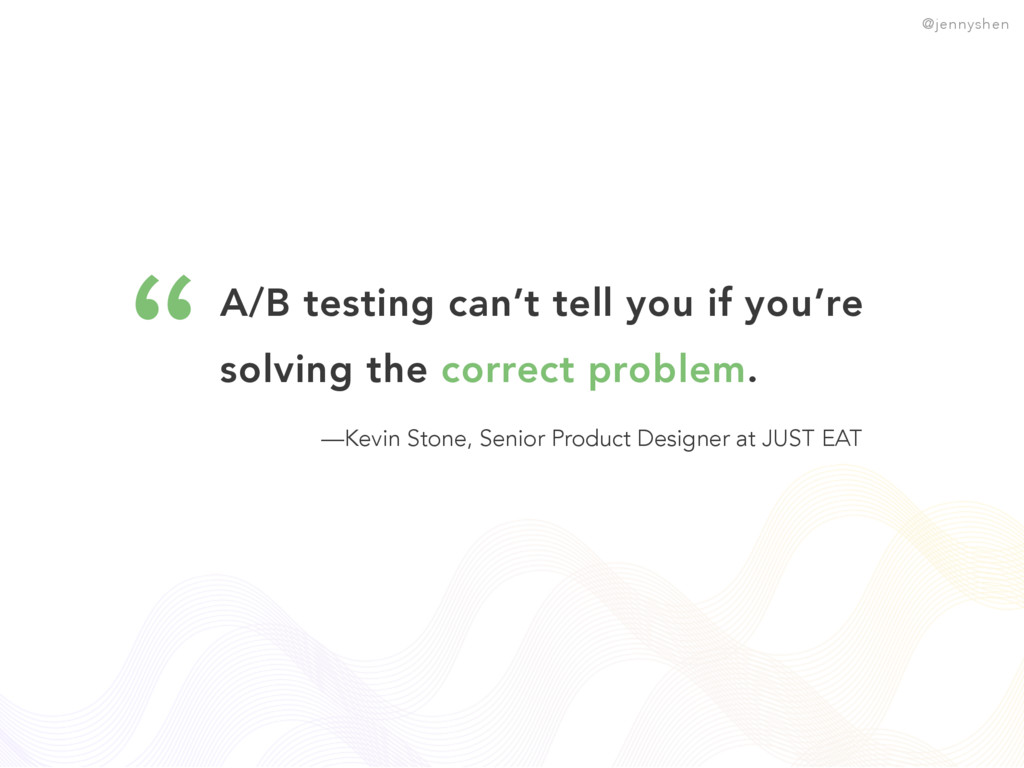
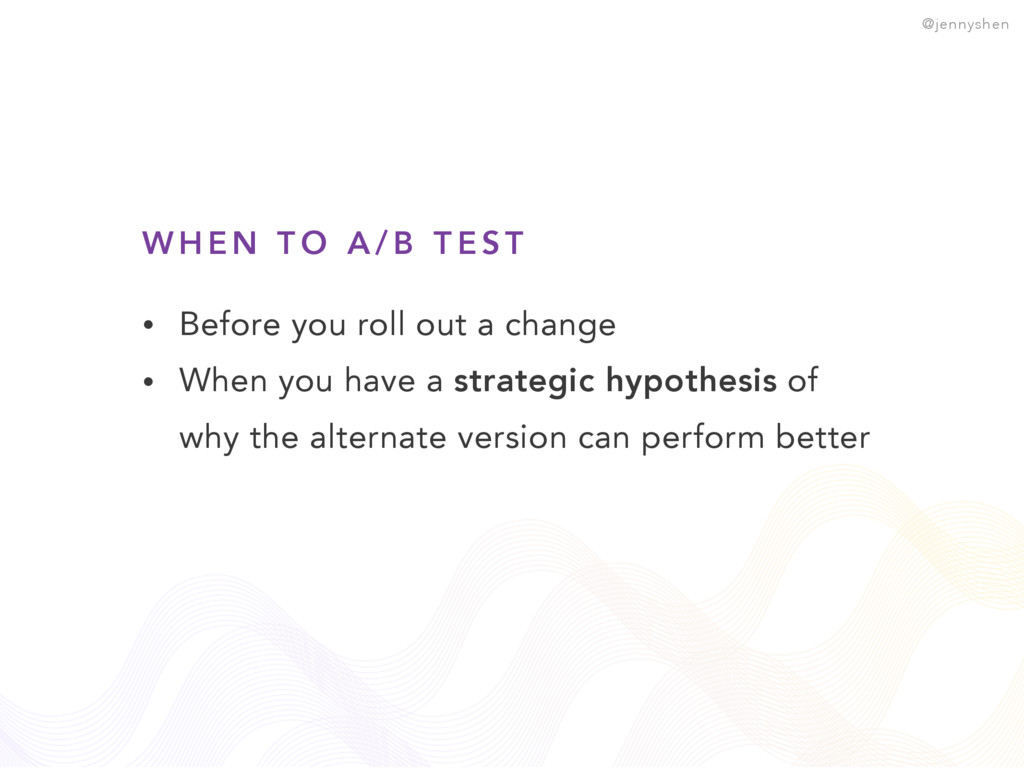
* Why A/B tests alone is not enough
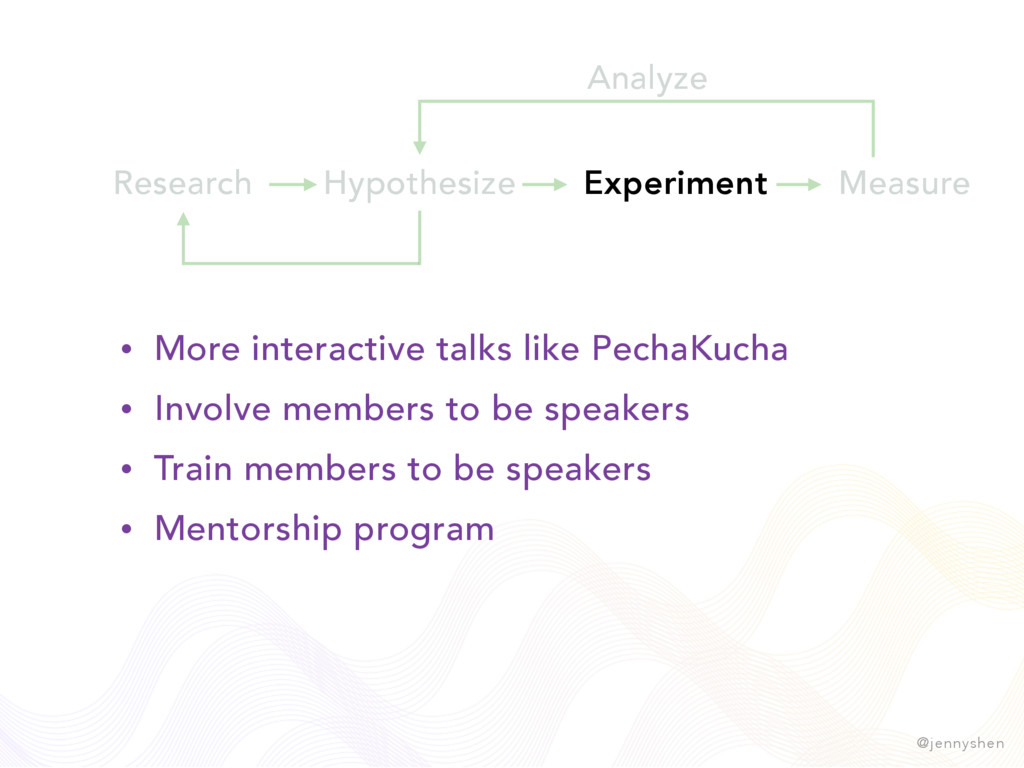
* How to use data in design
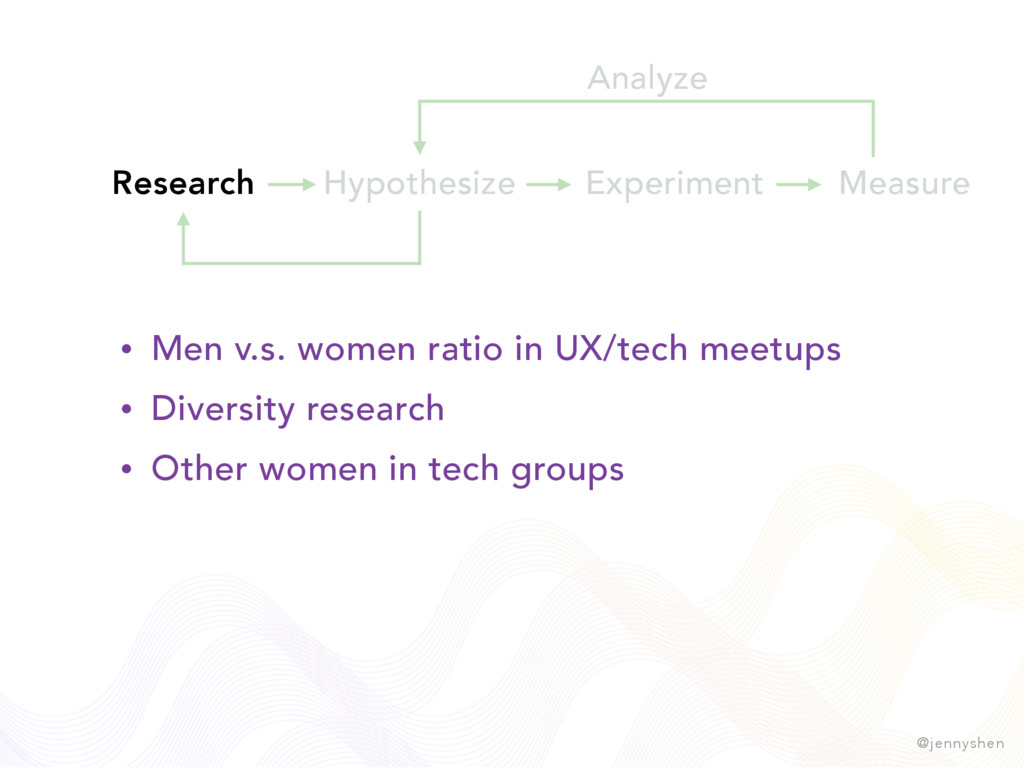
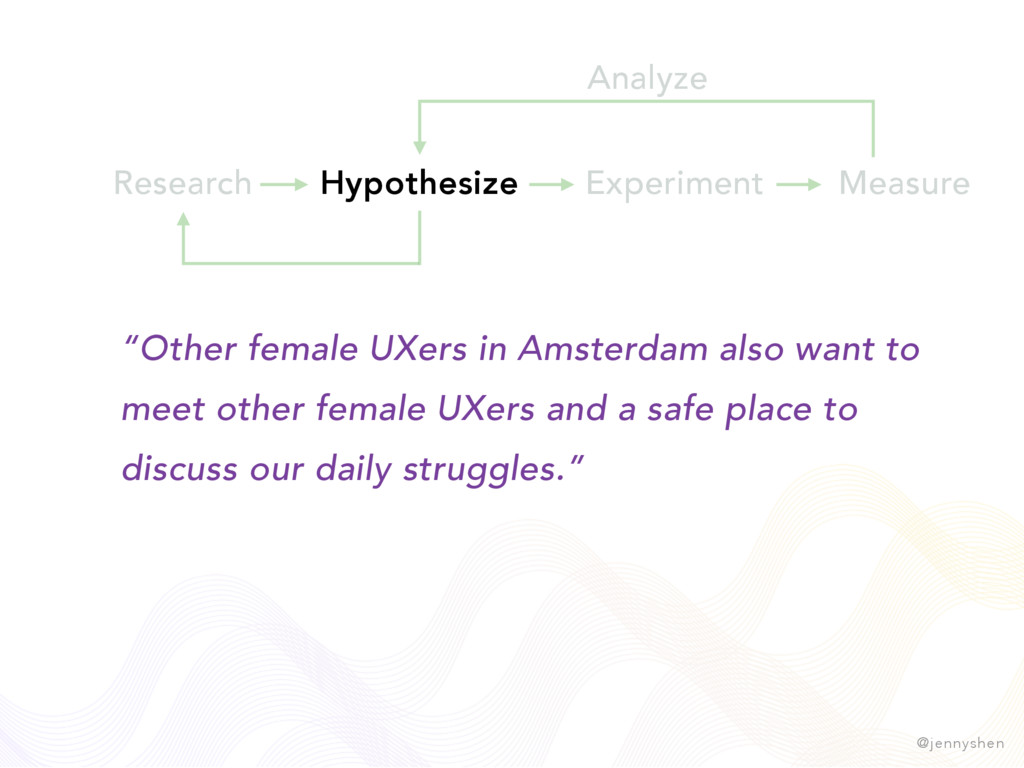
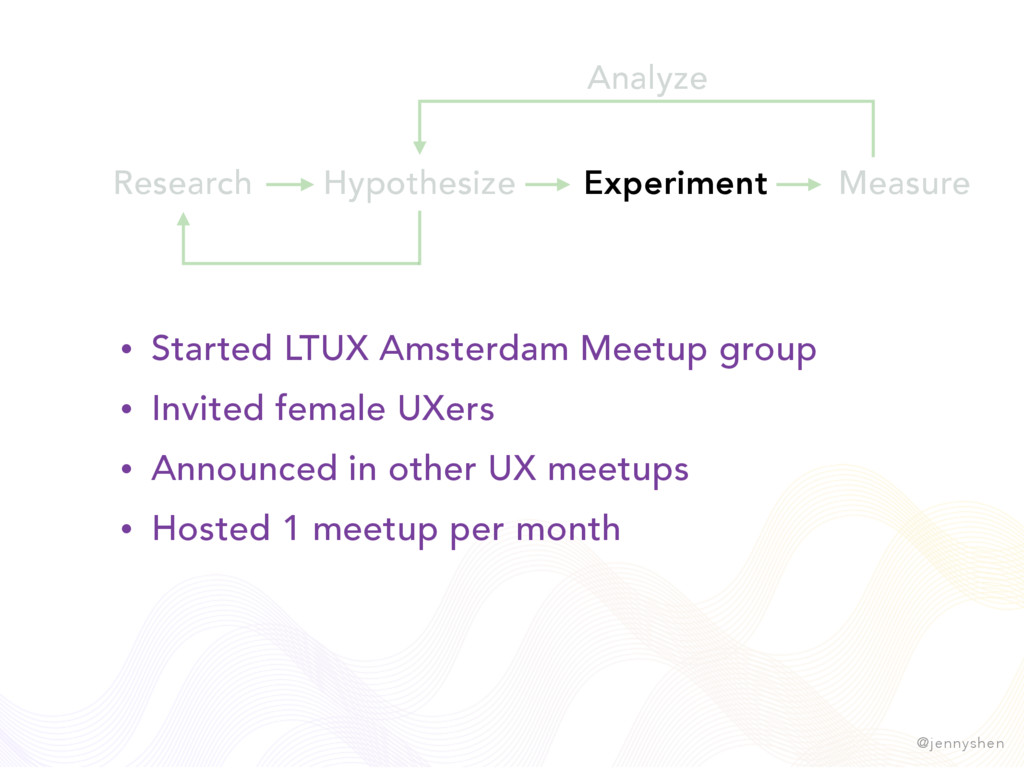
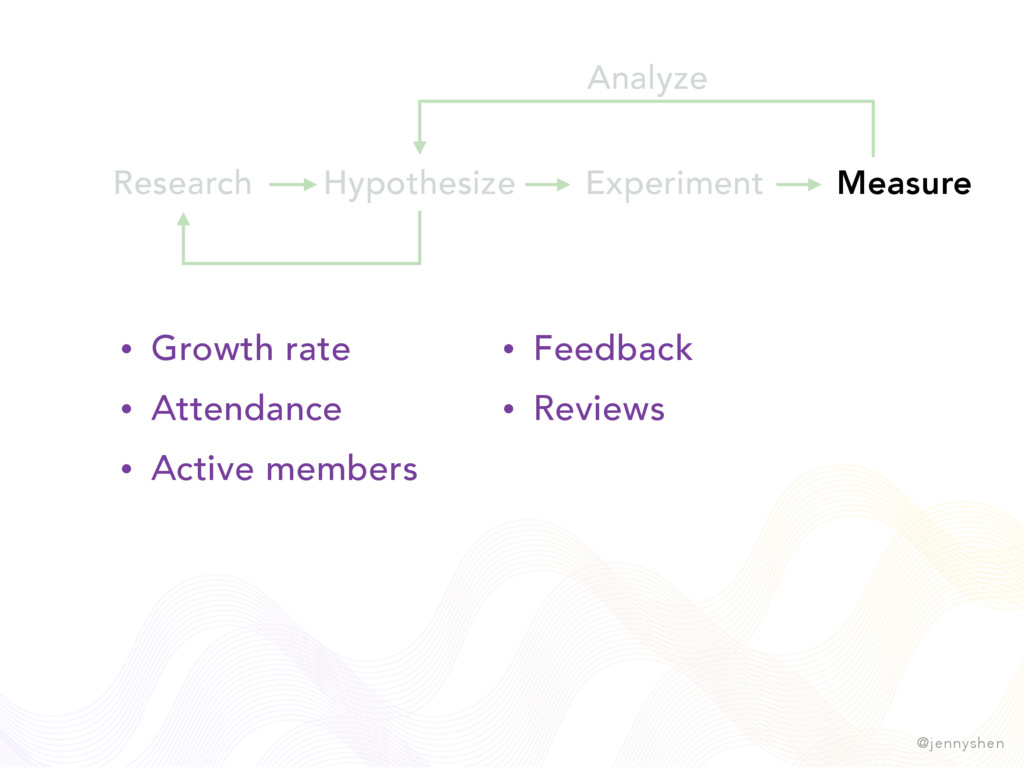
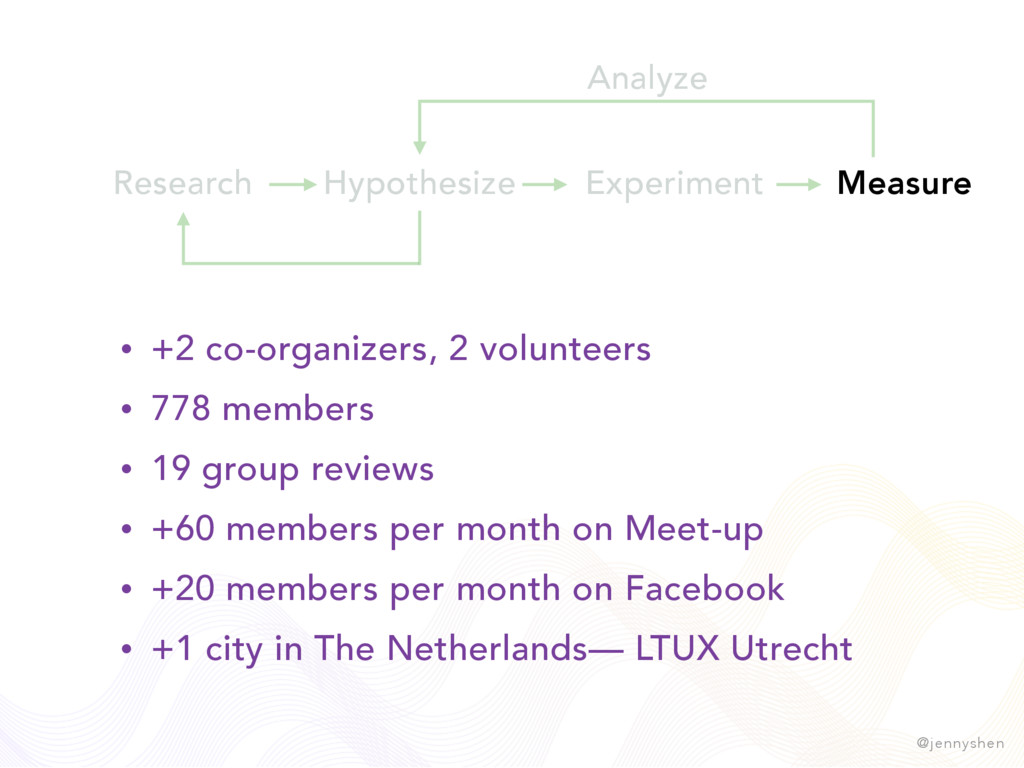
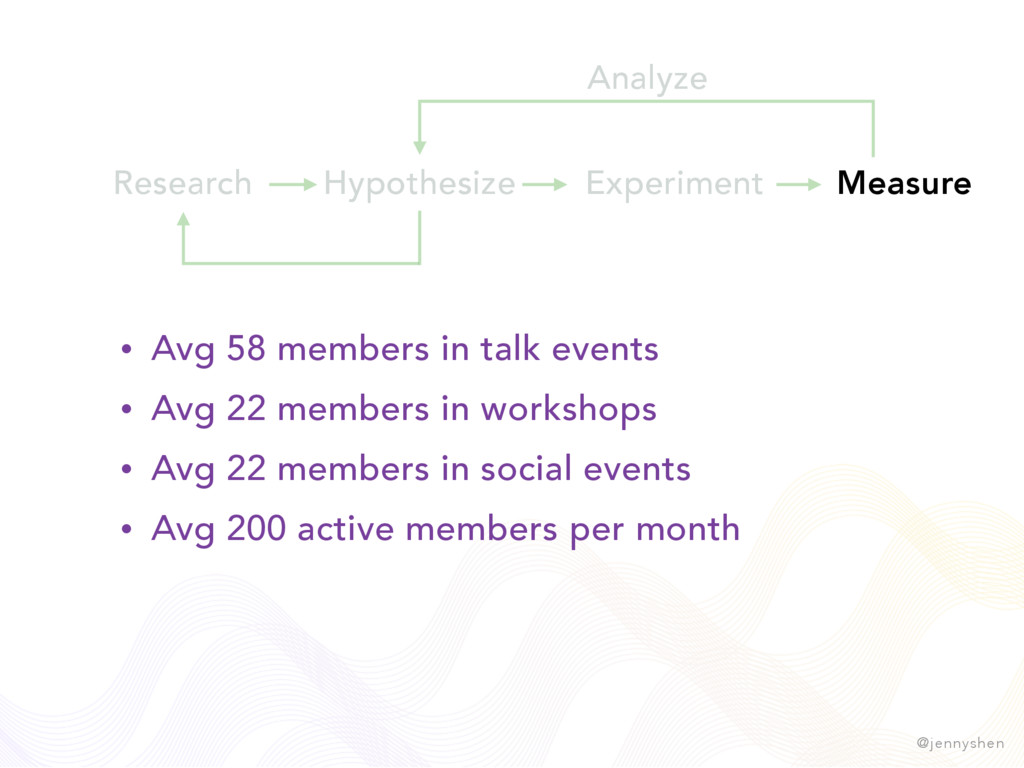
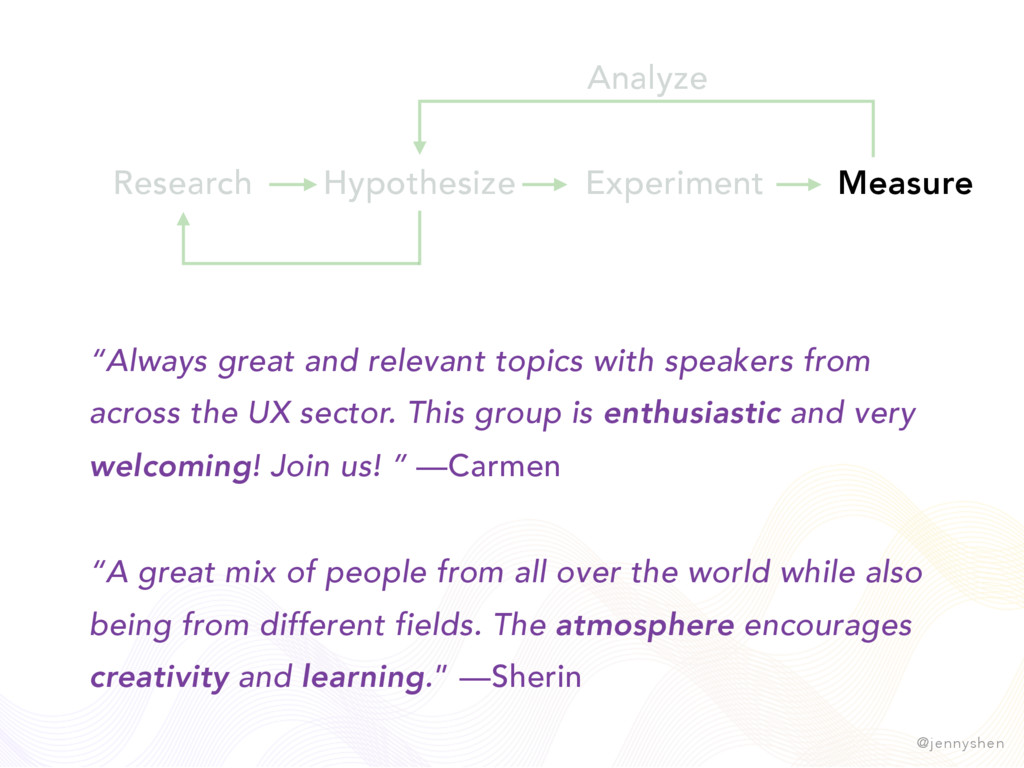
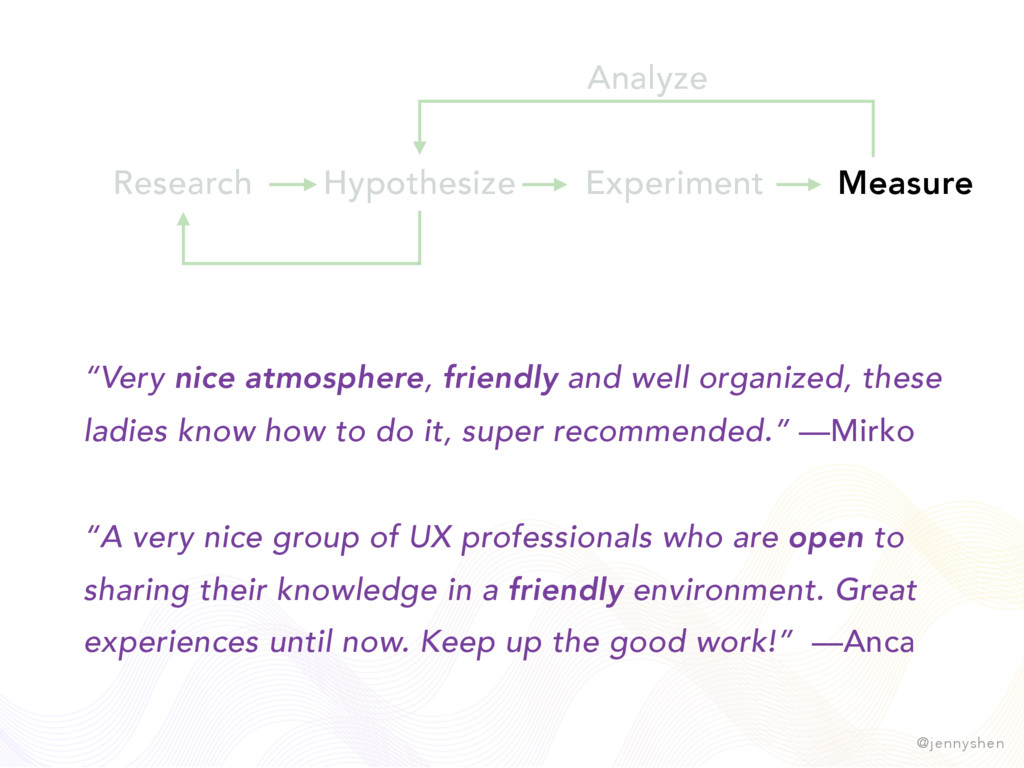
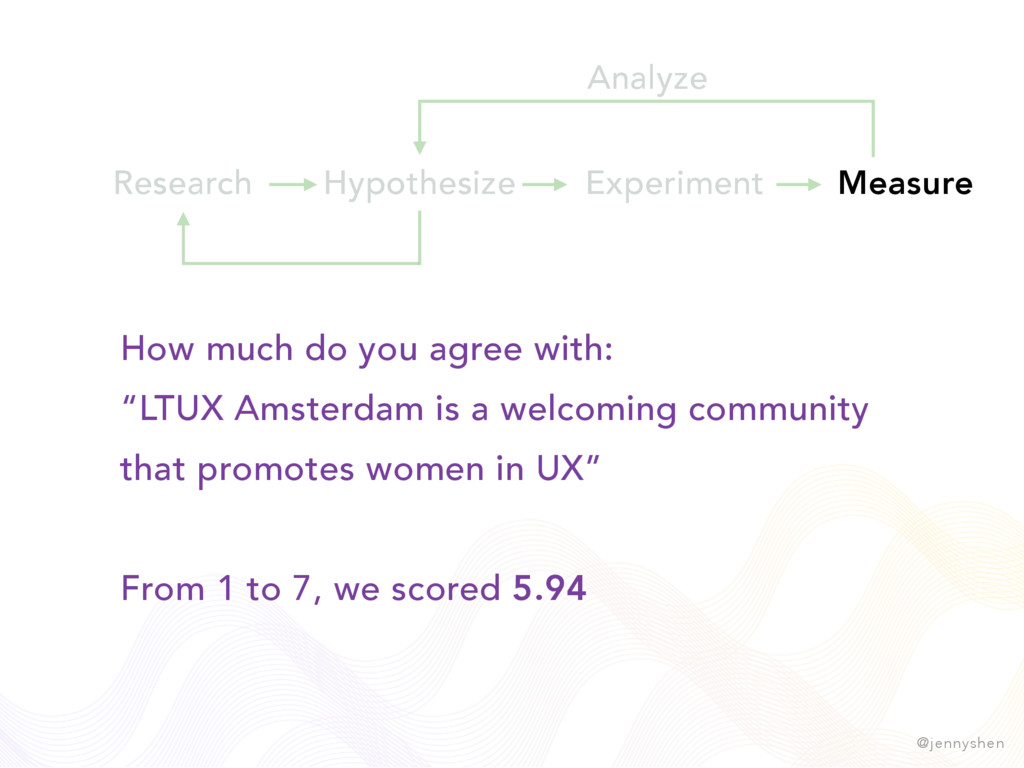
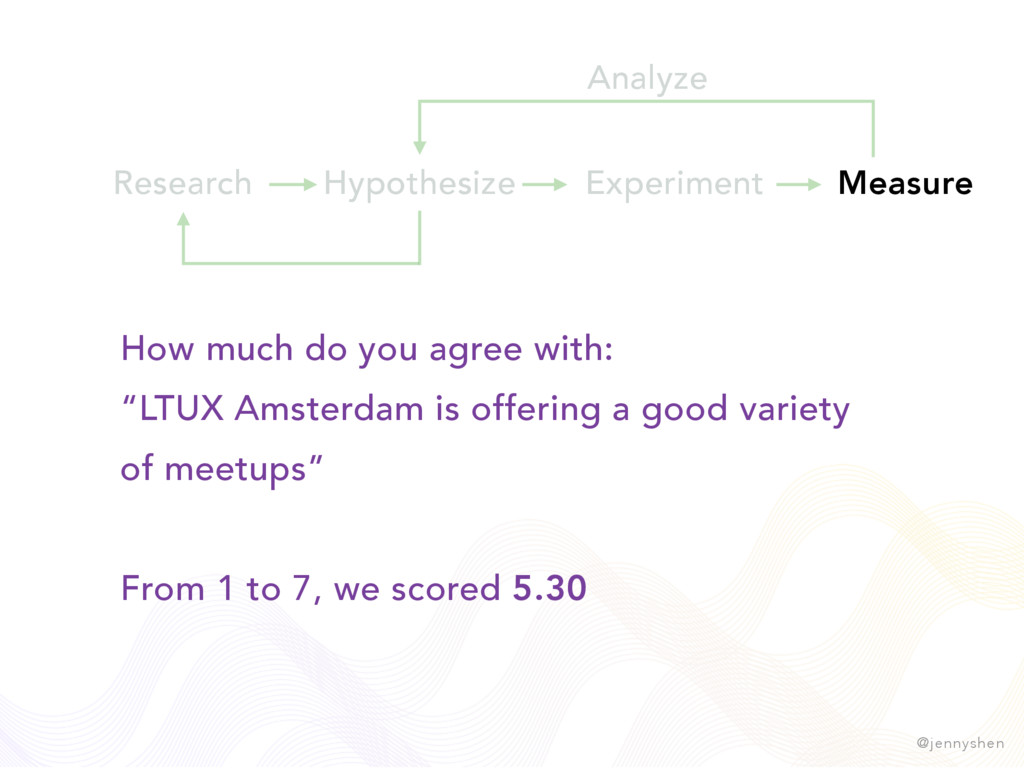
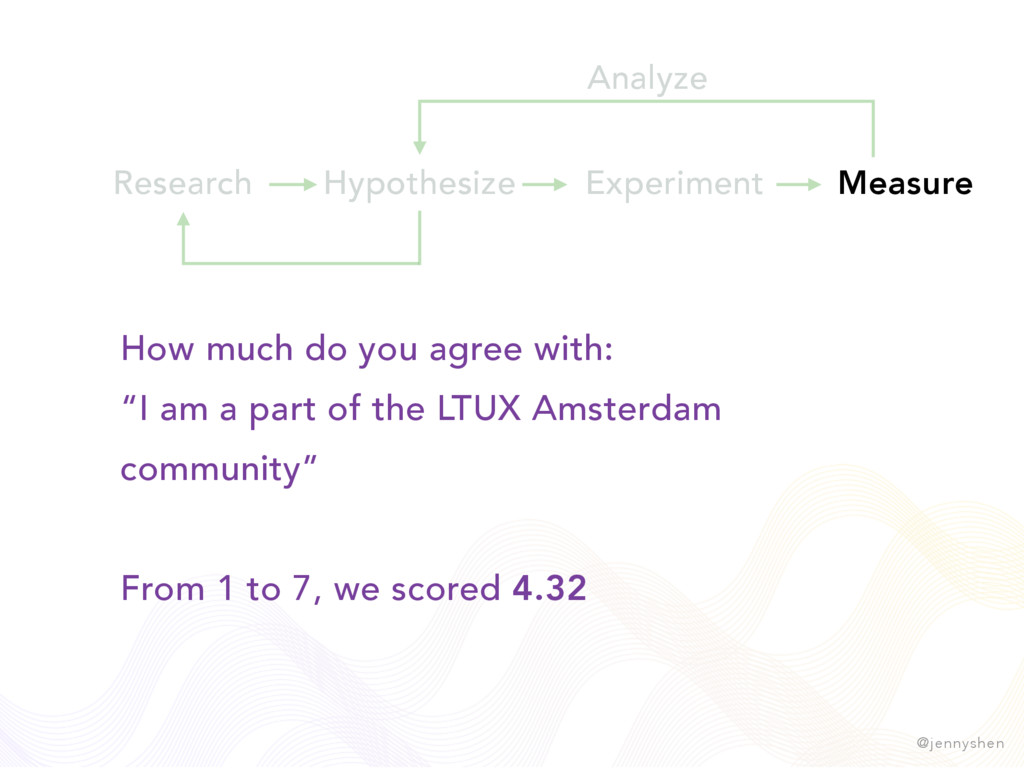
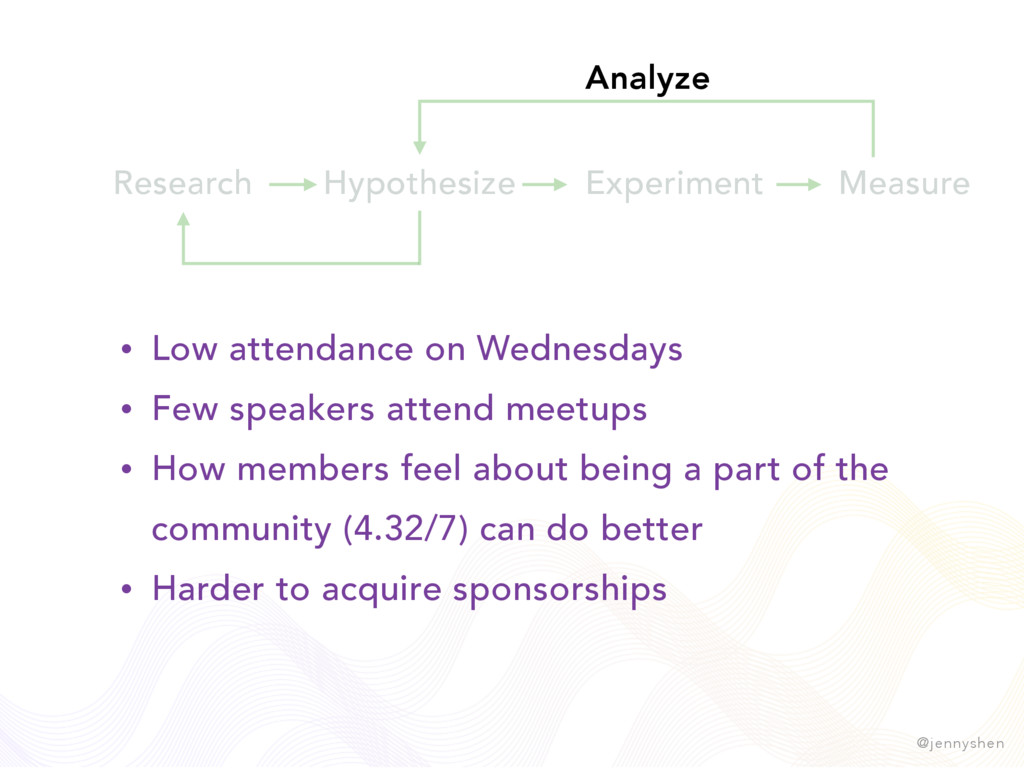
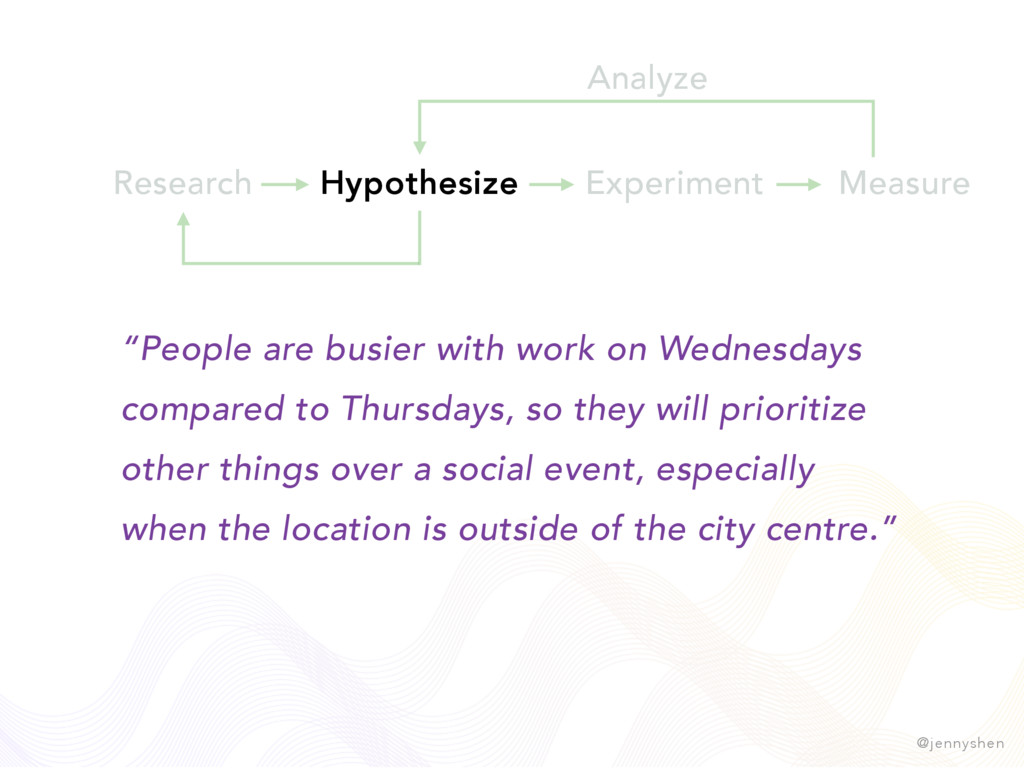
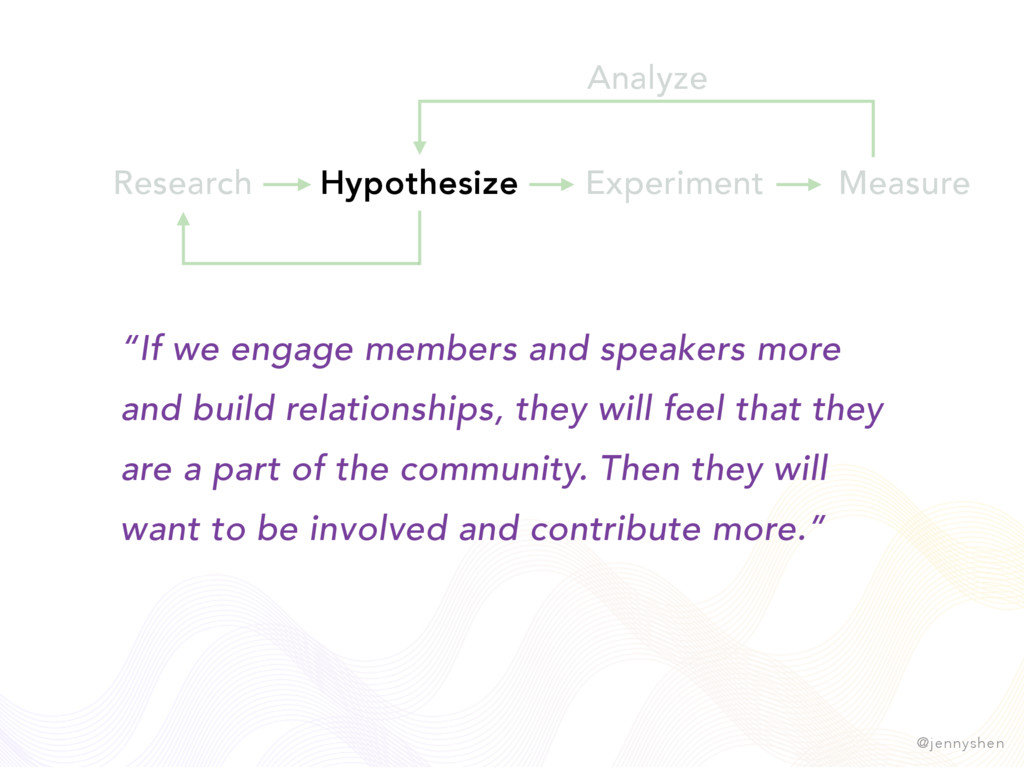
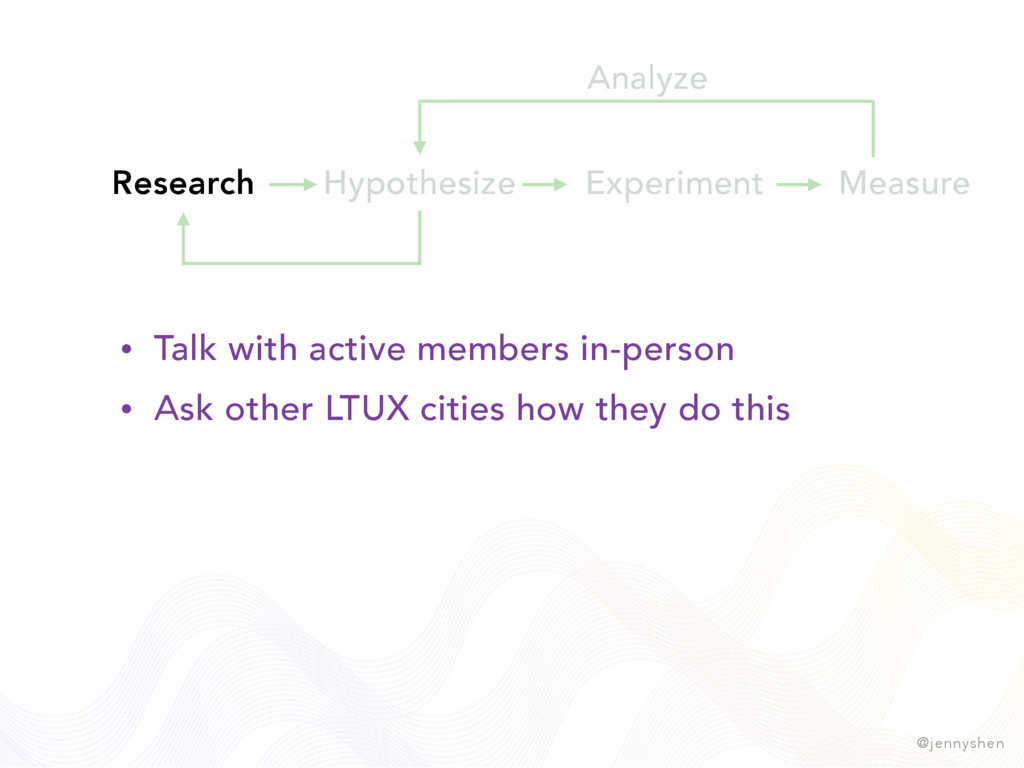
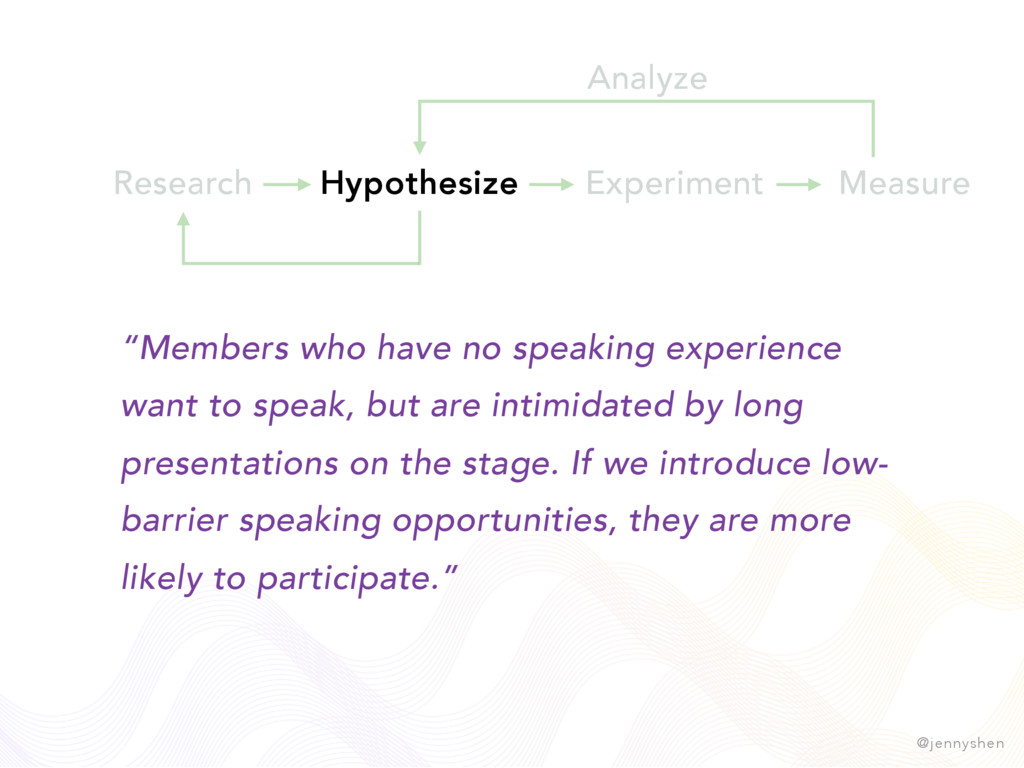
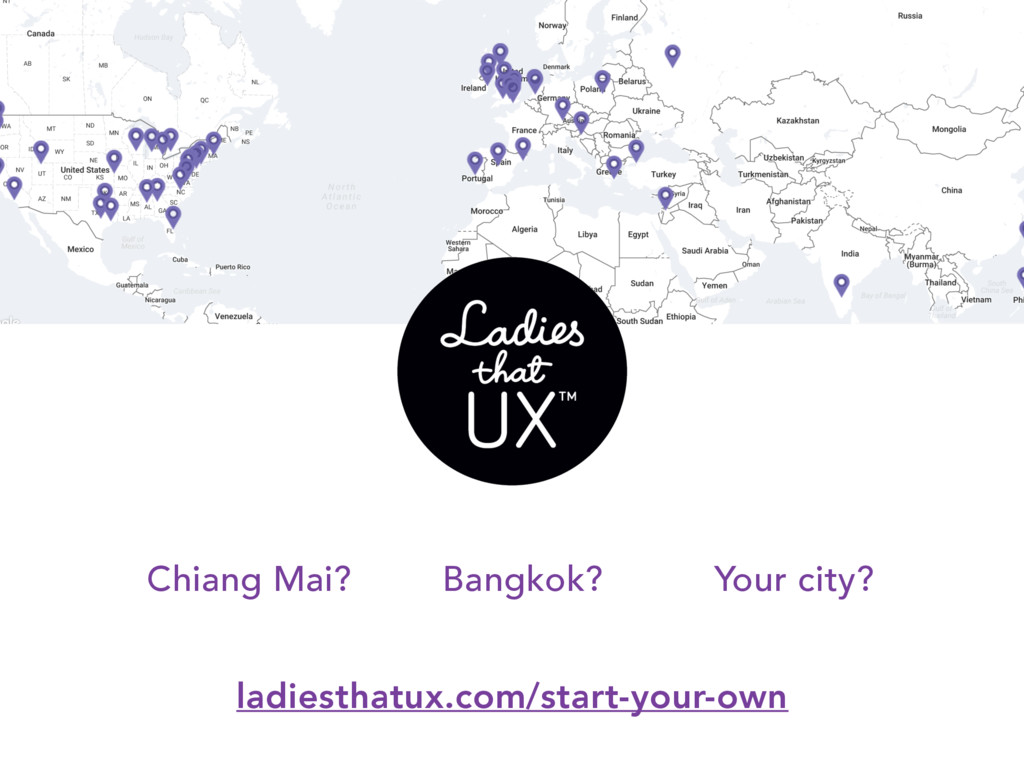
* Case study: building a UX community with data
This talk was presented at UXDA Chiang Mai, sponsored by Punspace
![S AY H E L L O @jennyshen [email protected] jennyshen.com](https://files.speakerdeck.com/presentations/50da299878de4453809c2cf2b00ed264/slide_50.jpg)