Upgrade to Pro — share decks privately, control downloads, hide ads and more …

The quantitative state of the Open Cloud

The quantitative state of the Open Cloud

Slides for my talk at OSCON, Portland, 2014. Video: https://vimeo.com/105213660

Understanding the inner life of free / open source software projects is of fundamental importance to developers, users and decision makers. This talk helps to understand what's happening behind the curtains in the most relevant open cloud platforms, by analyzing the rich data obtained from their developing repositories.

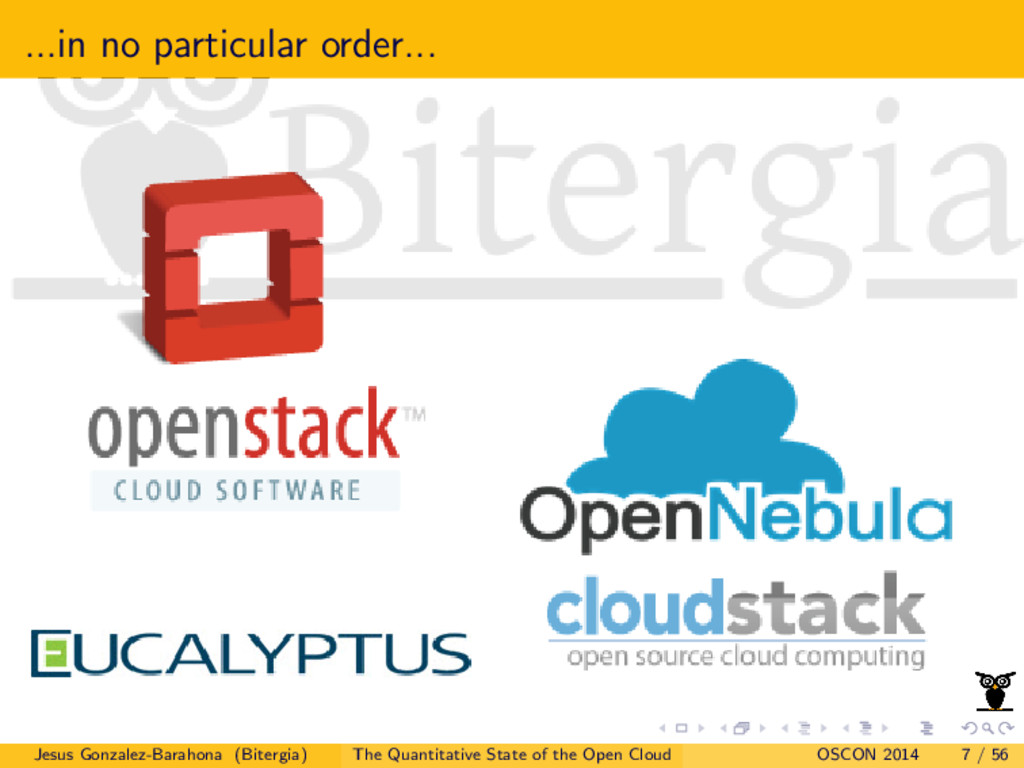
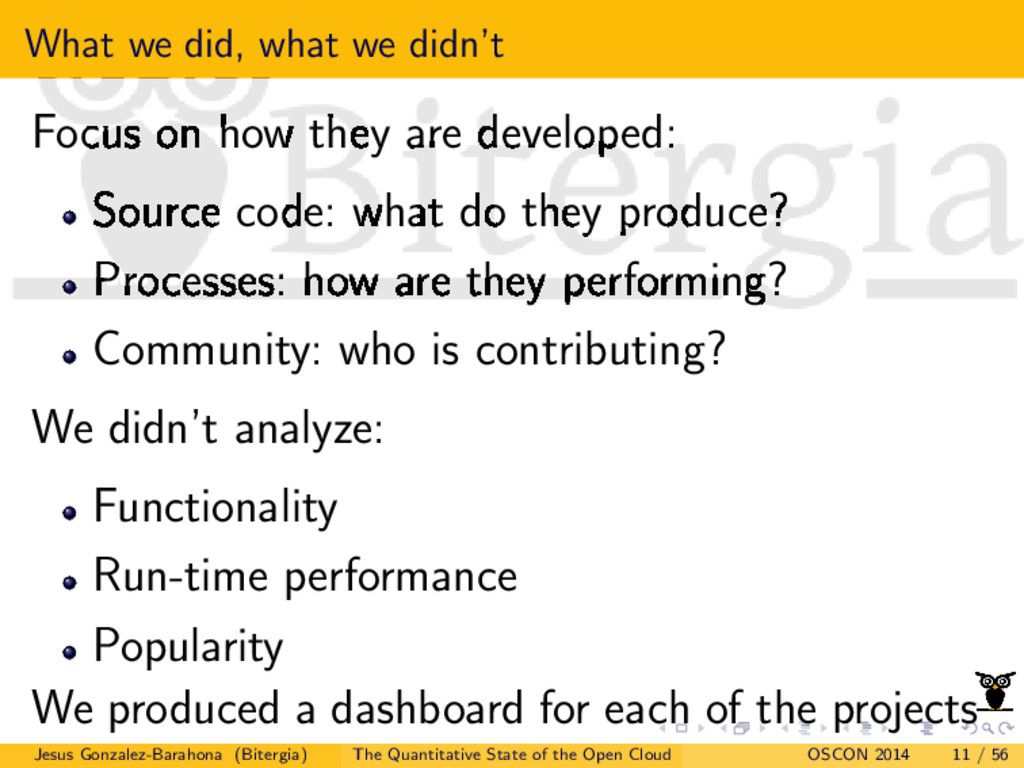
The talk covers, for the four analyzed projects, the following topics:

* How open is their development model, and to which extent they provide access to their development data.
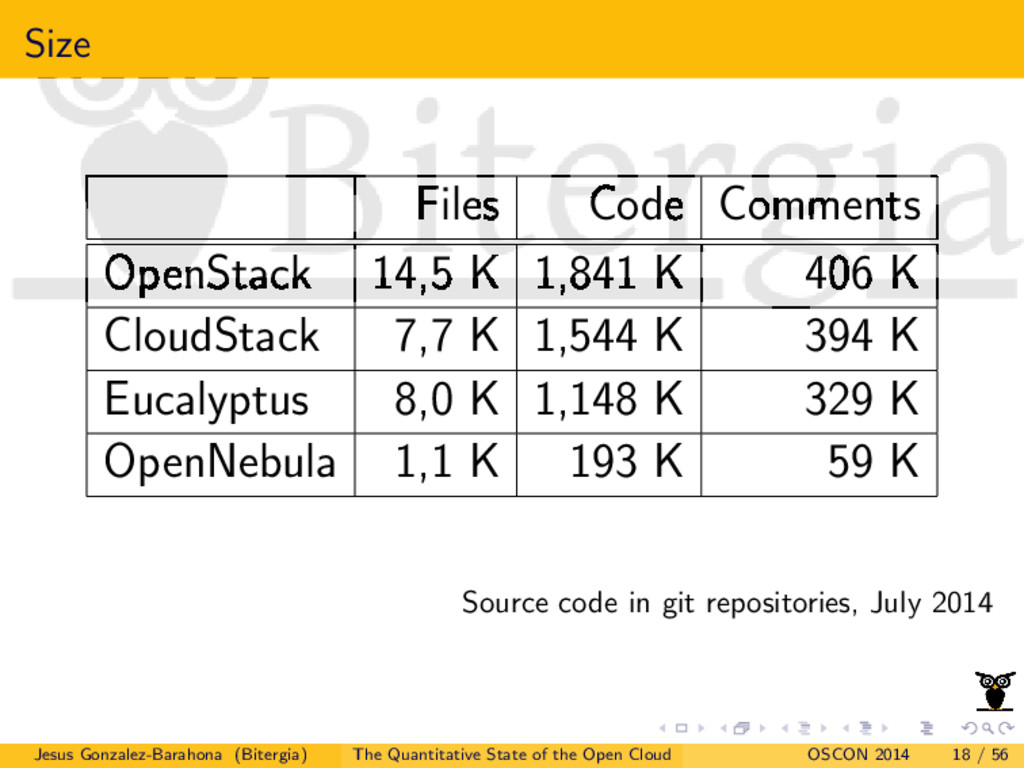
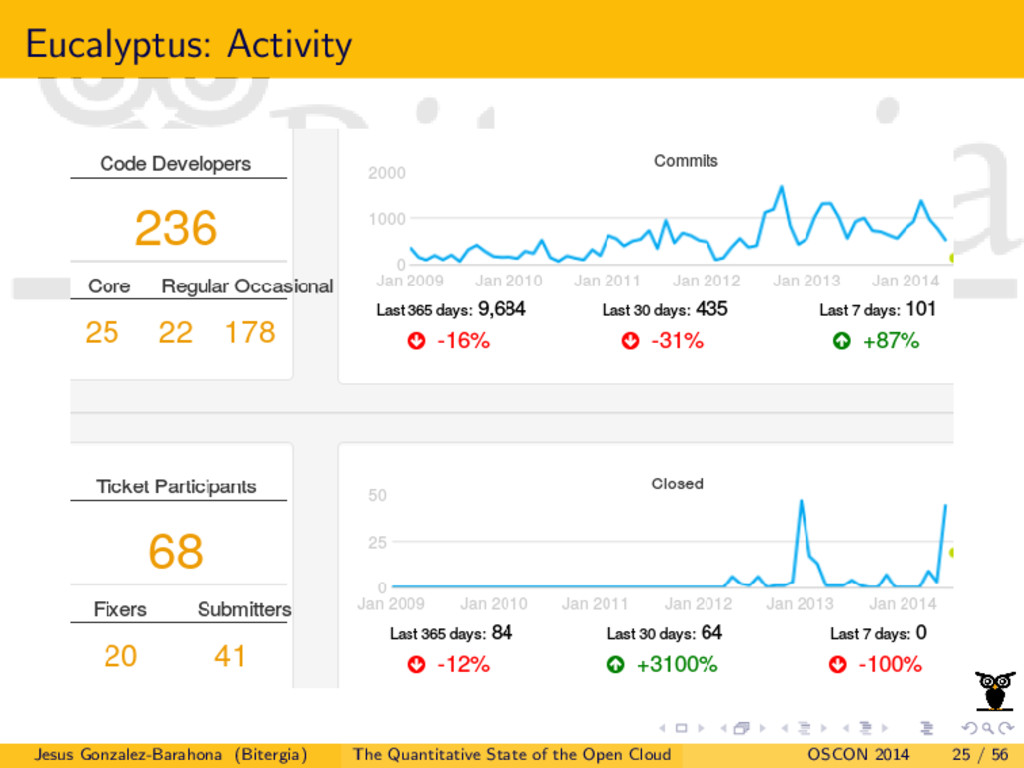
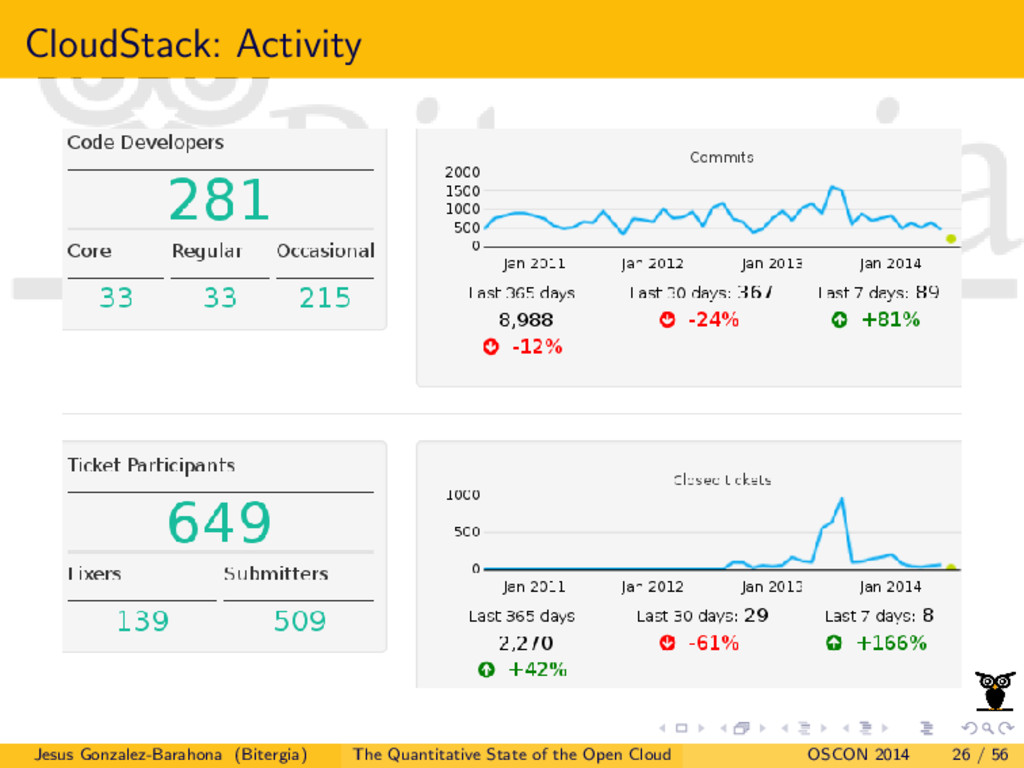
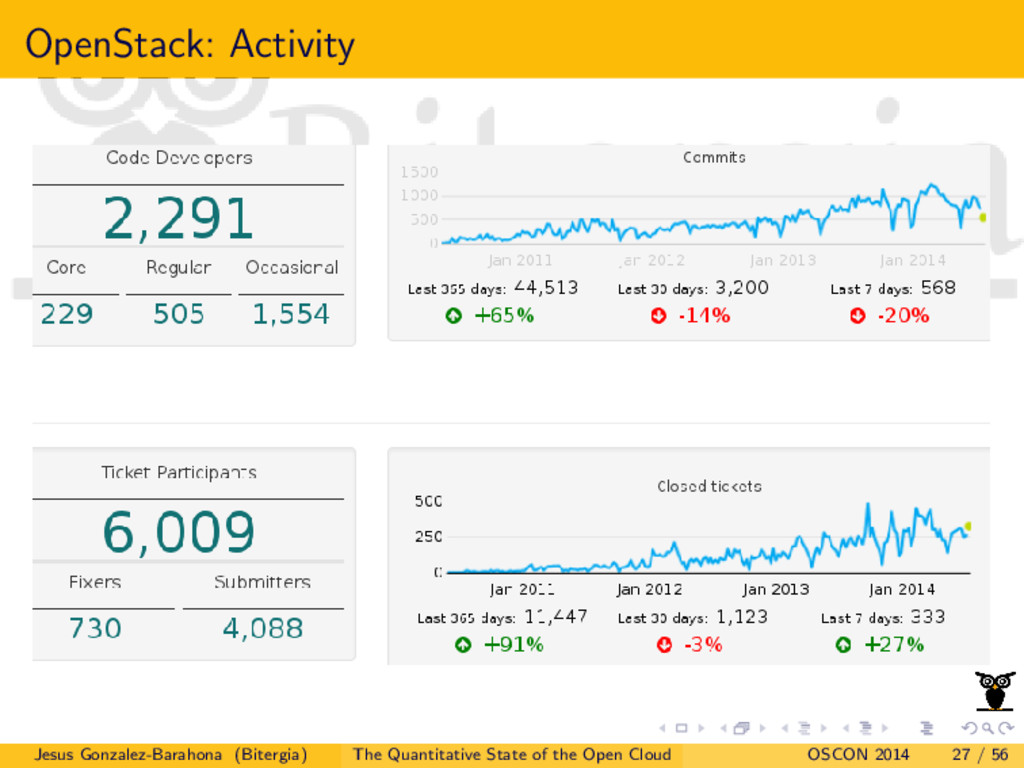
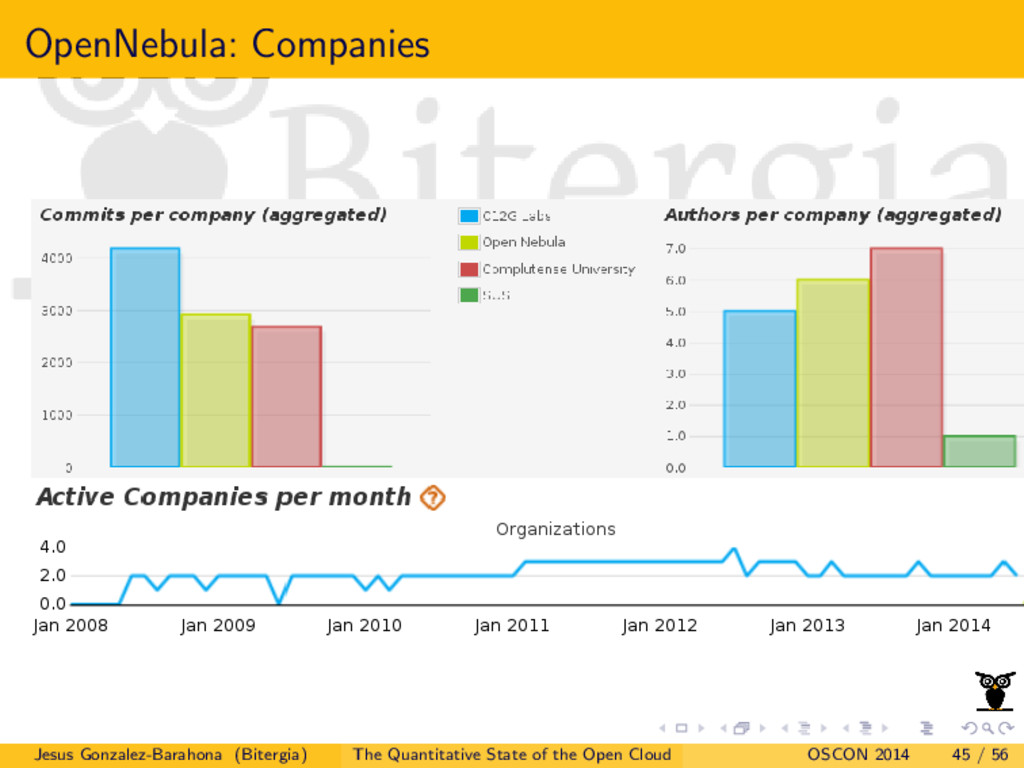
* Some parameters related to the overall activity and effort put into the development and maintenance of their products.
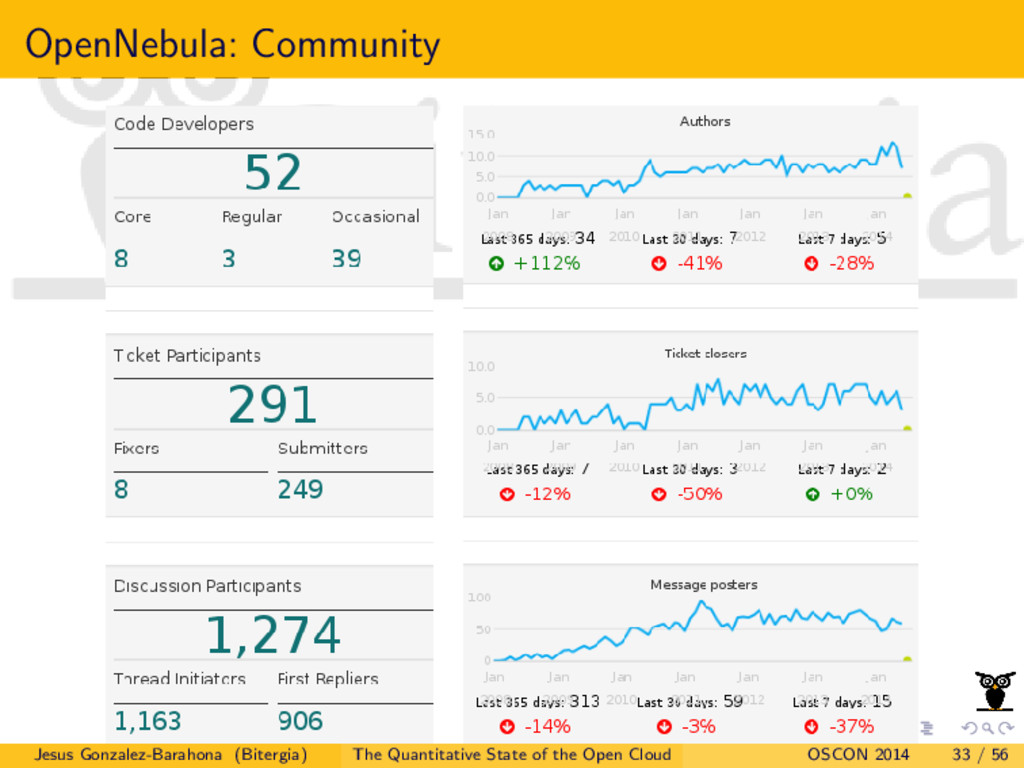
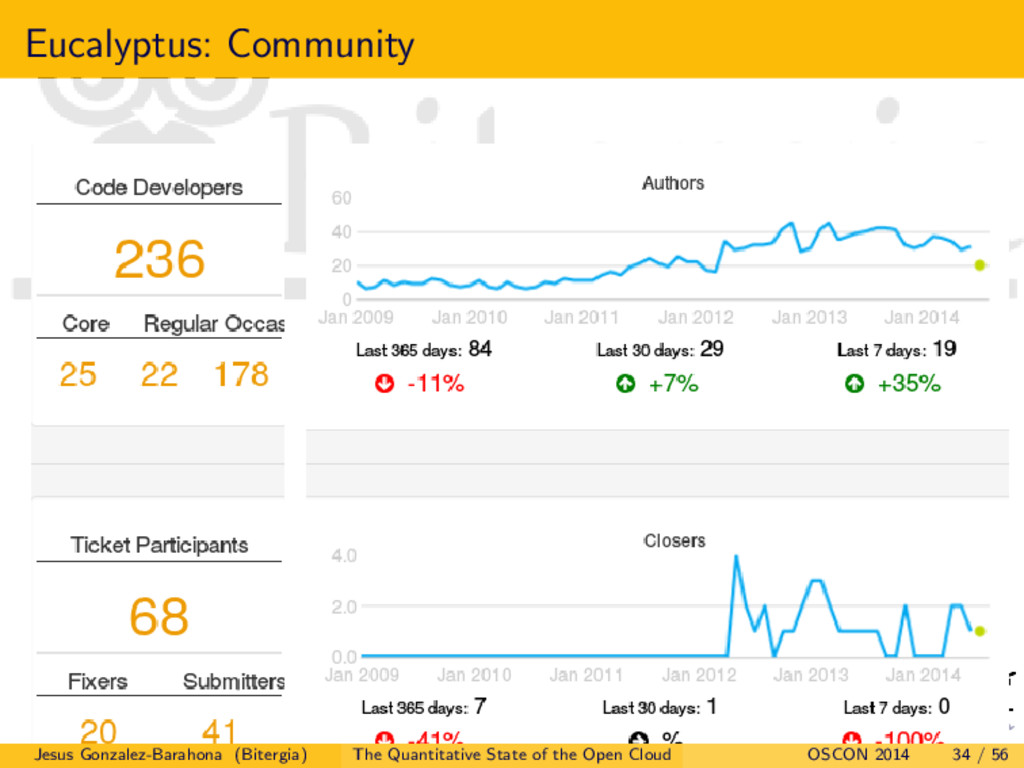
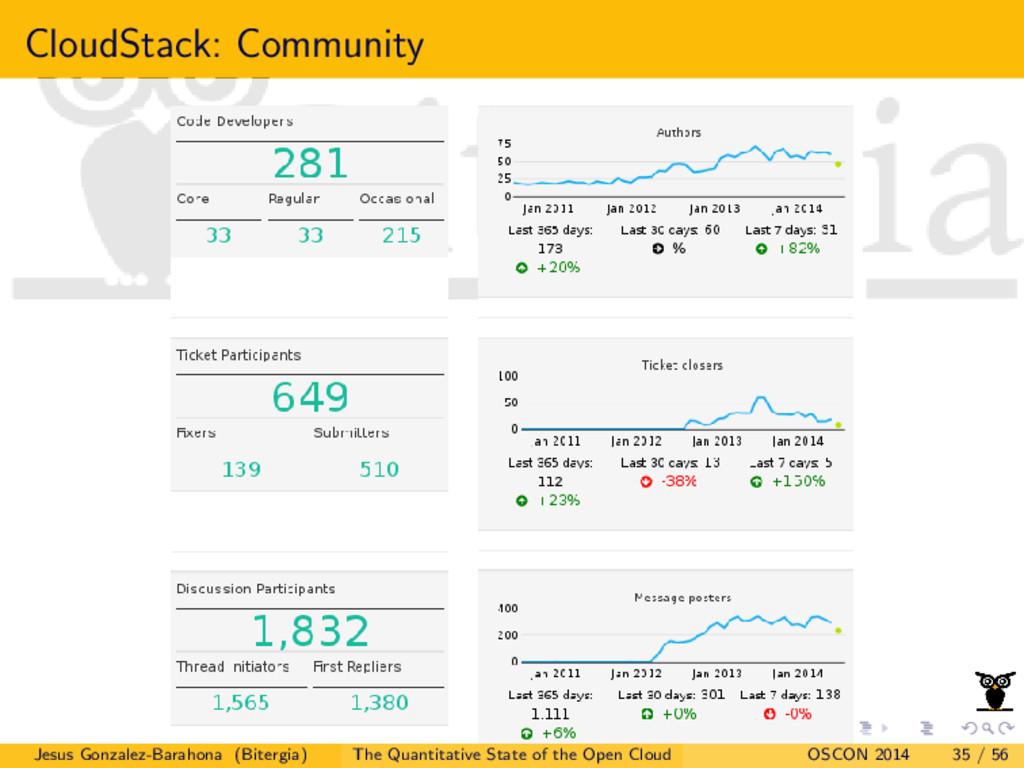
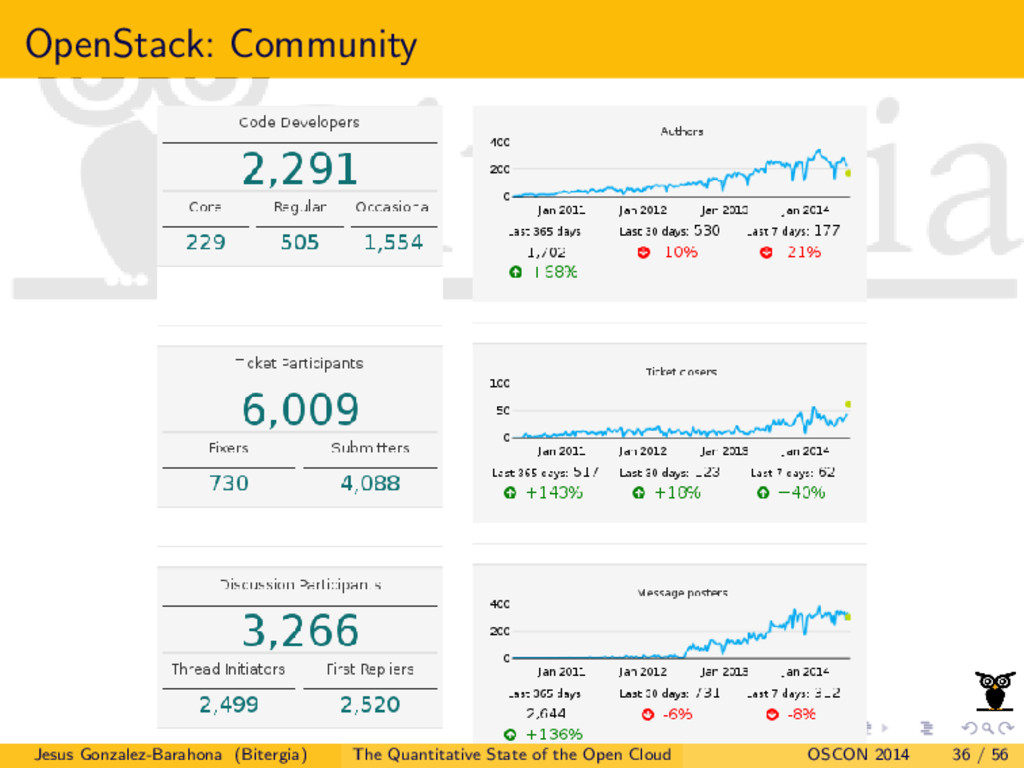
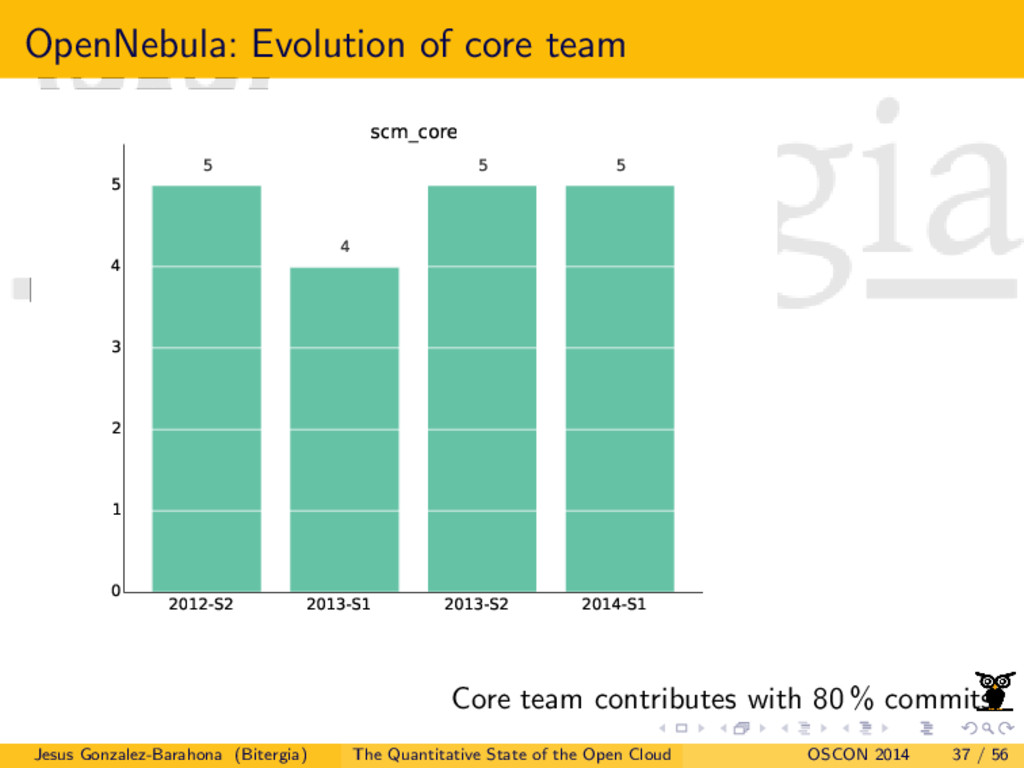
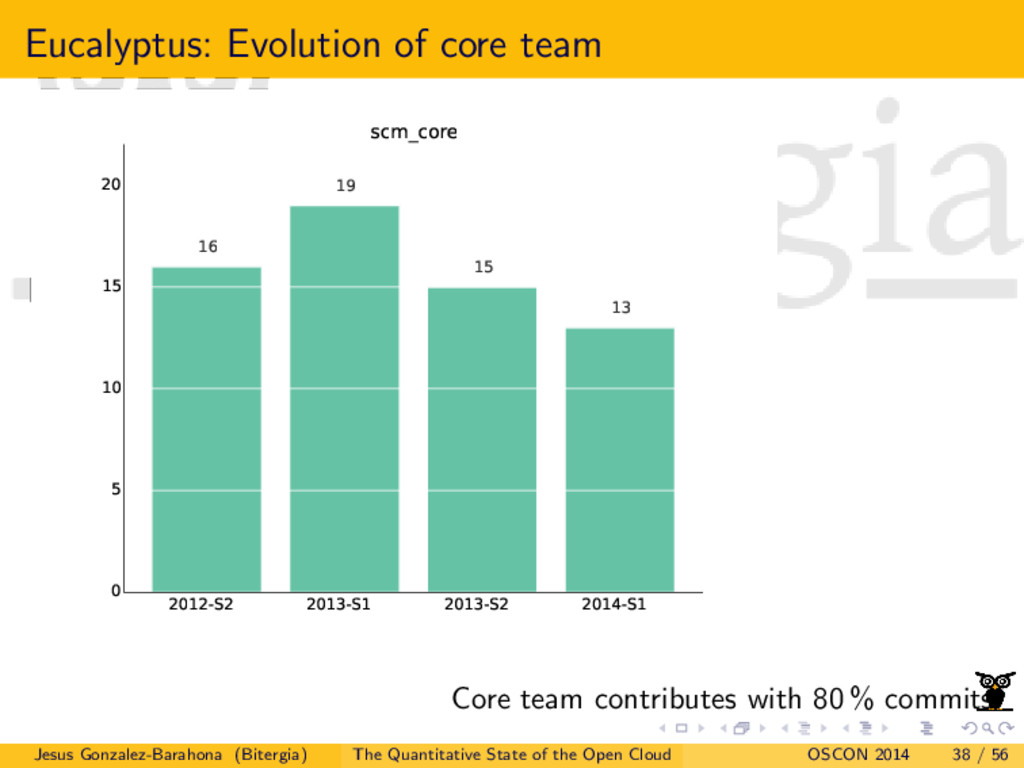
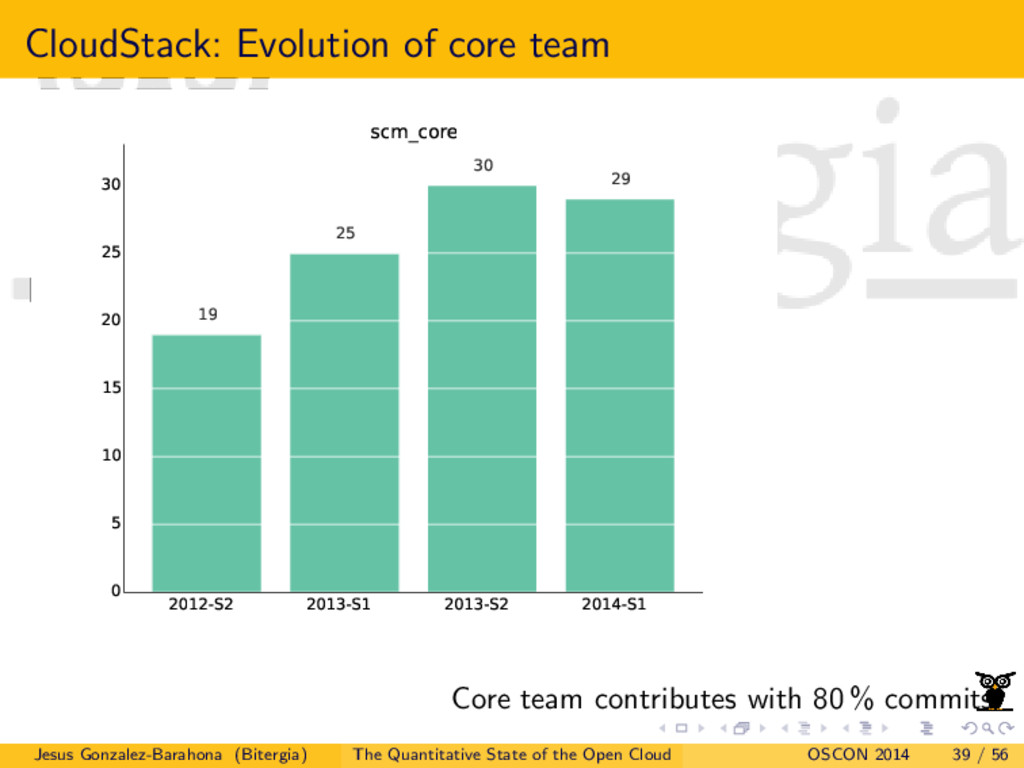
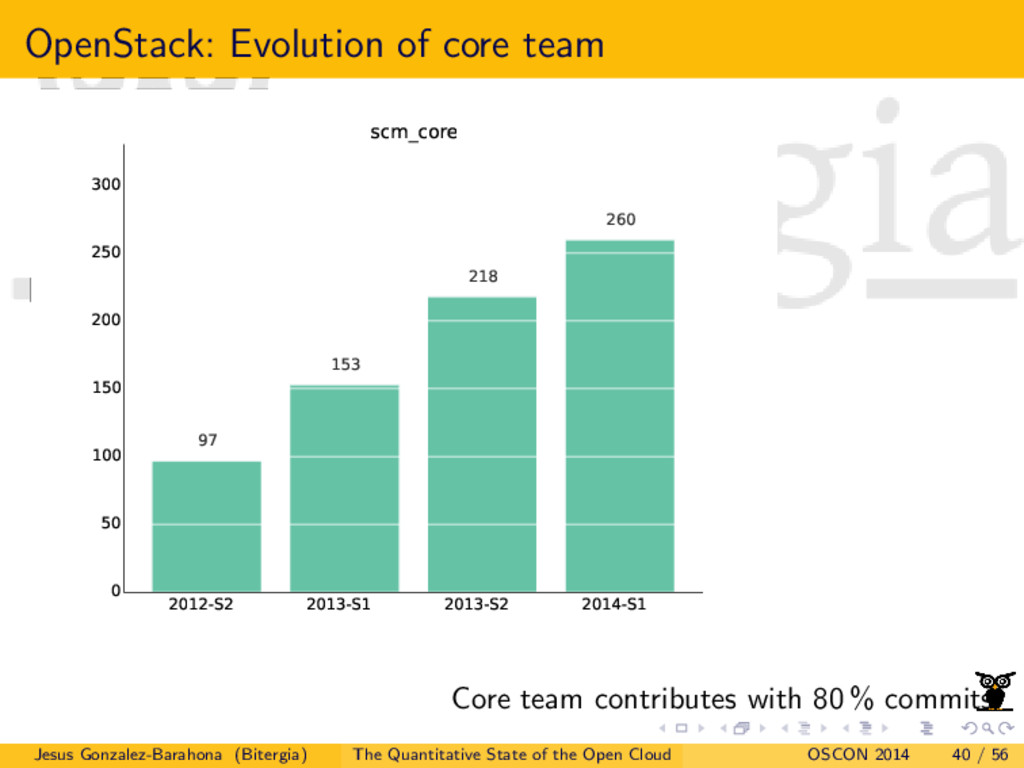
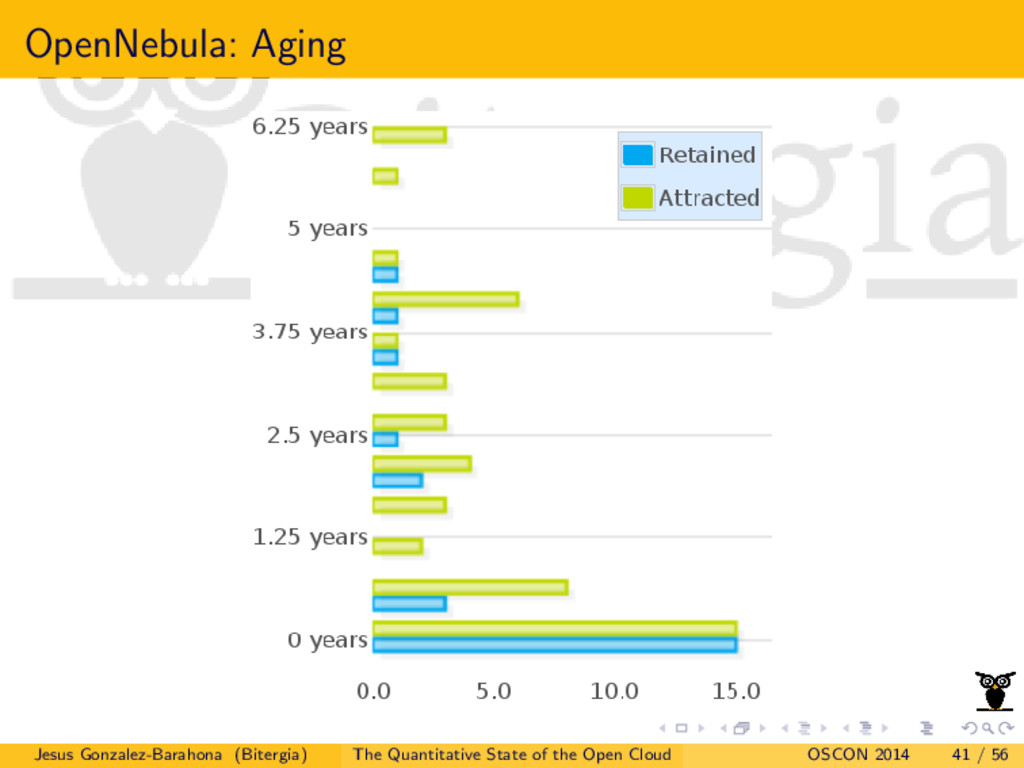
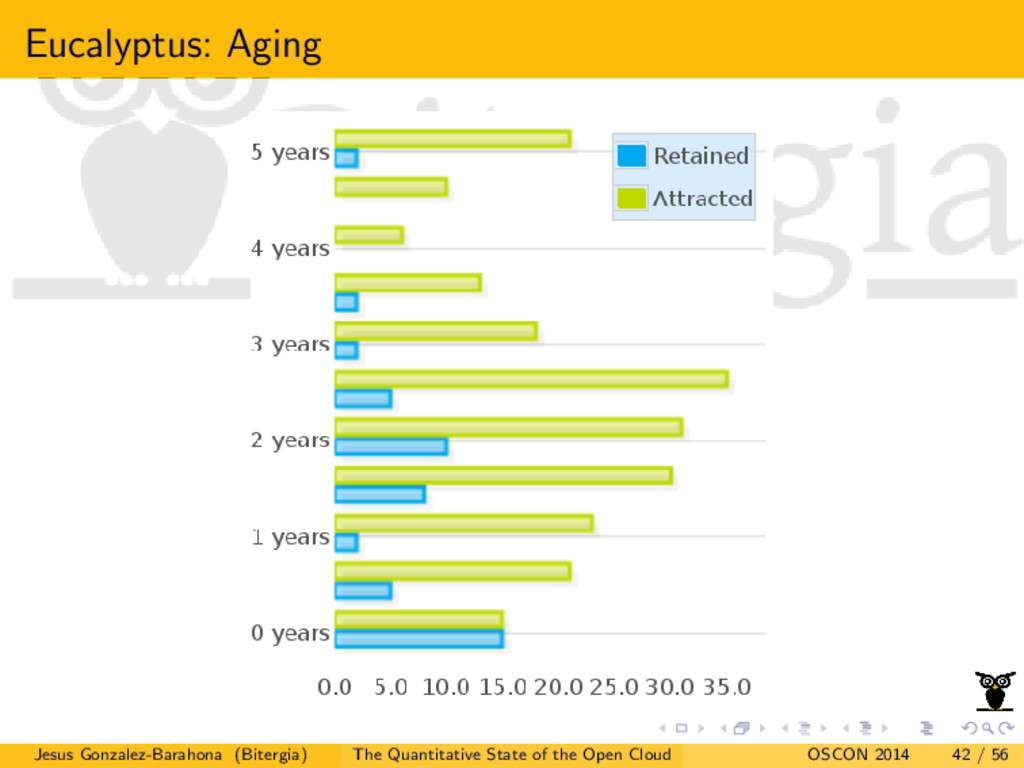
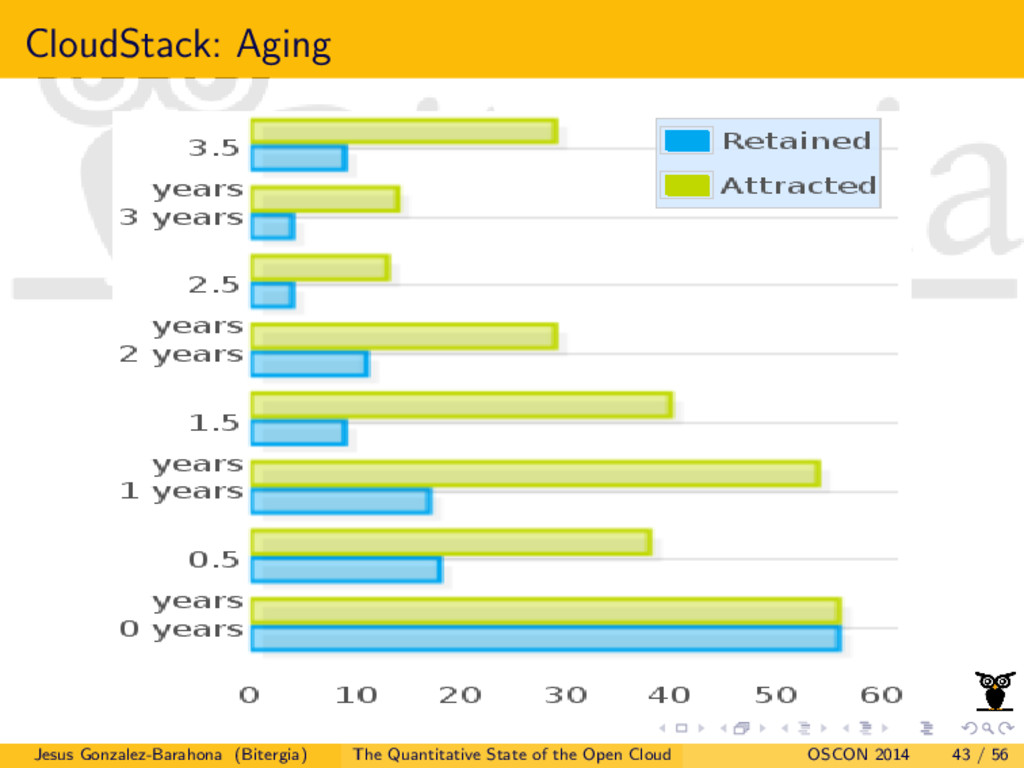
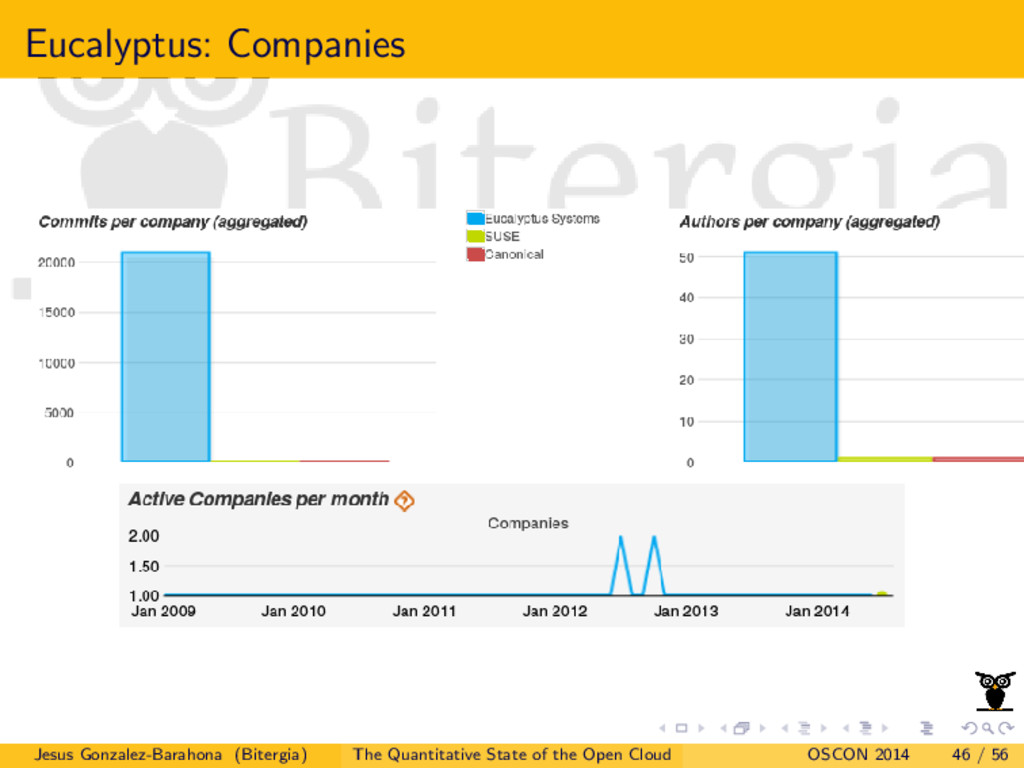
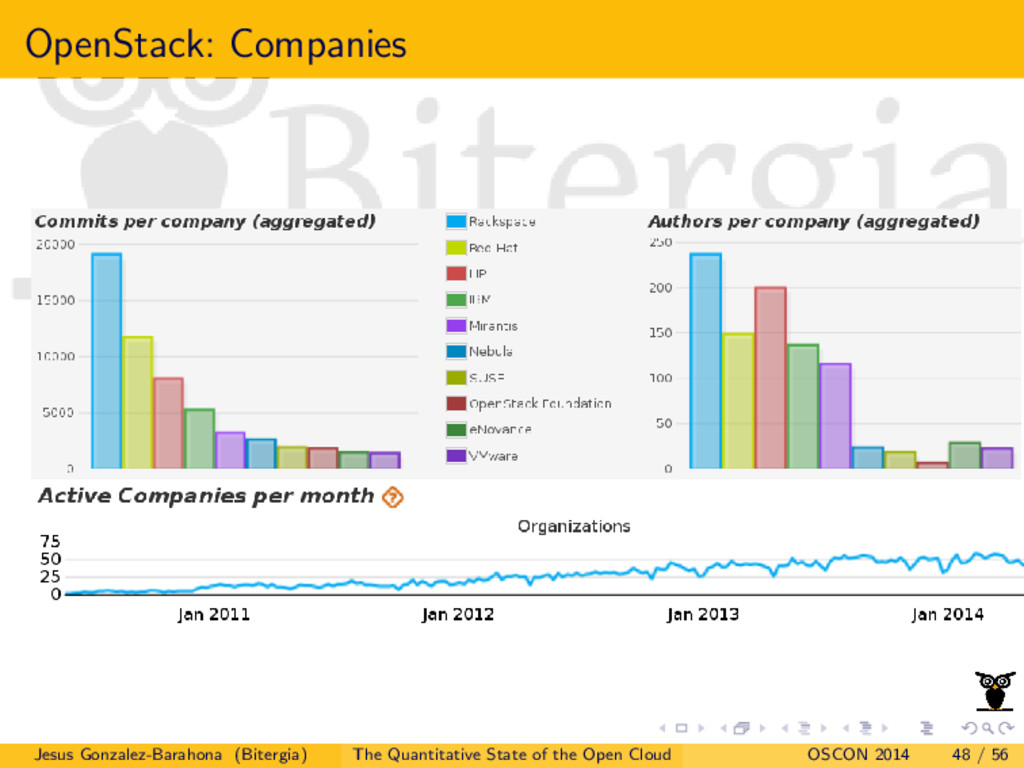
* The main characteristics of their development community: size, diversity, engagement, attraction, etc.
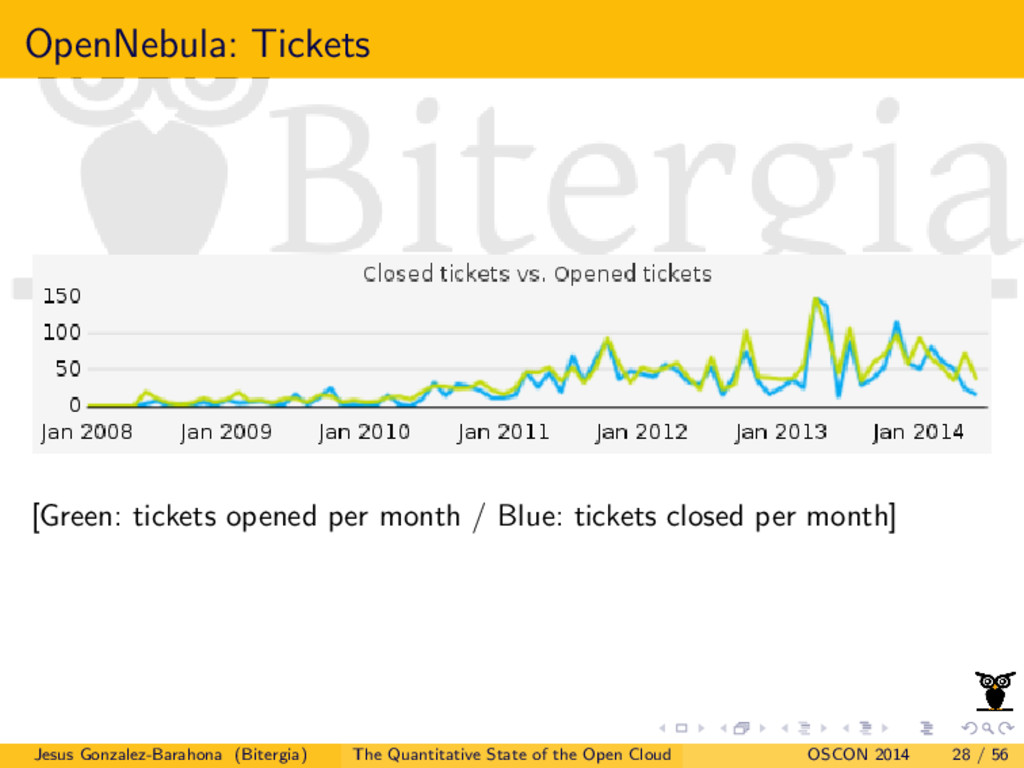
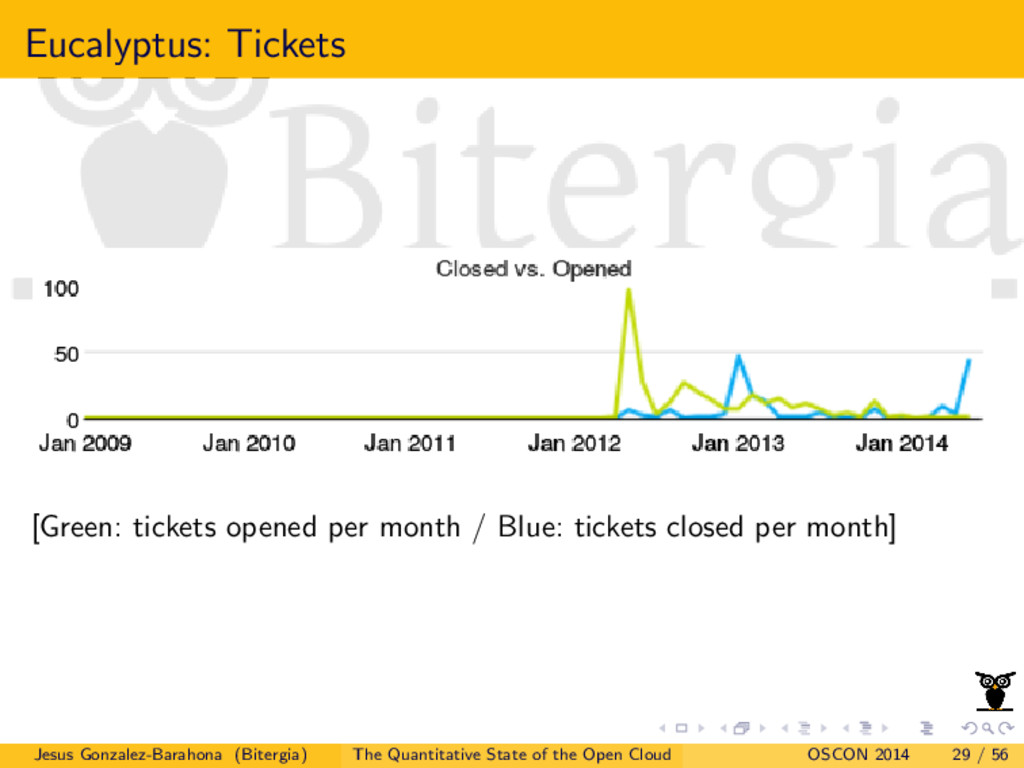
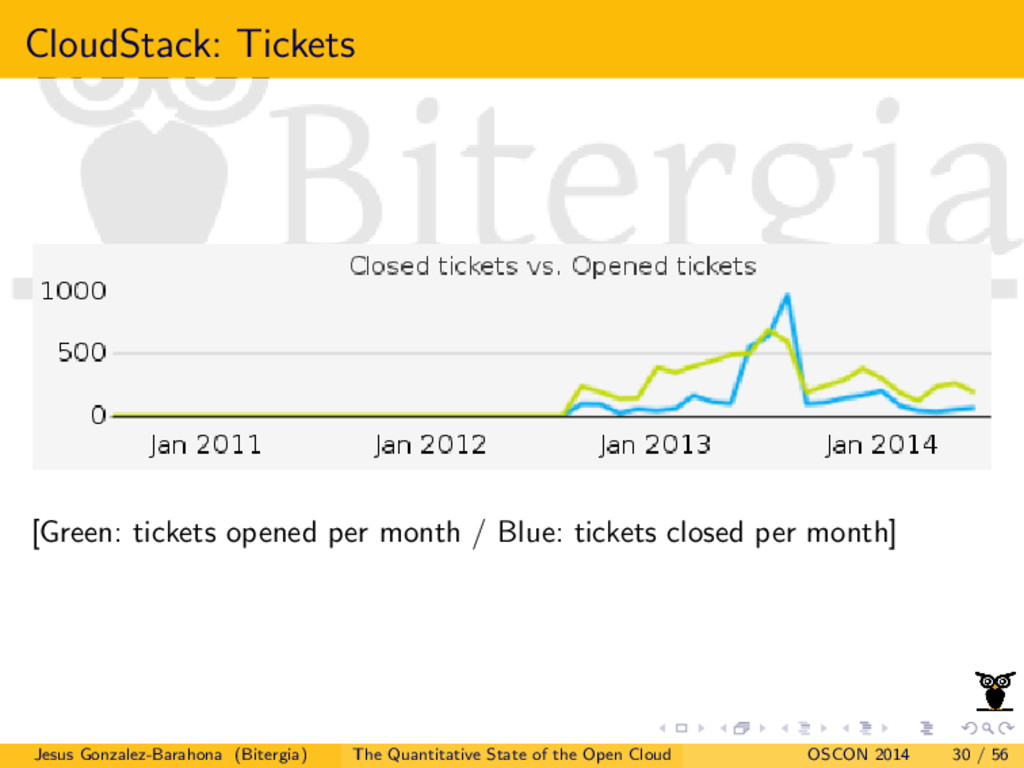
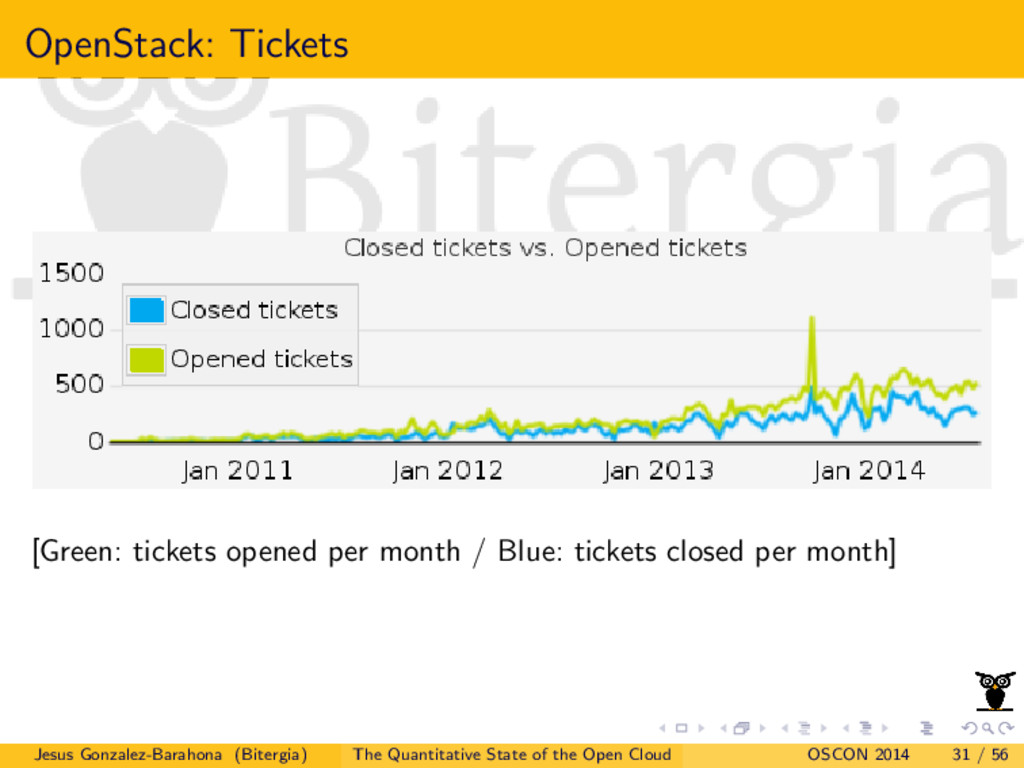
* The main parameters characterizing their performance, such as time-to-fix tickets or time-to-review patches.
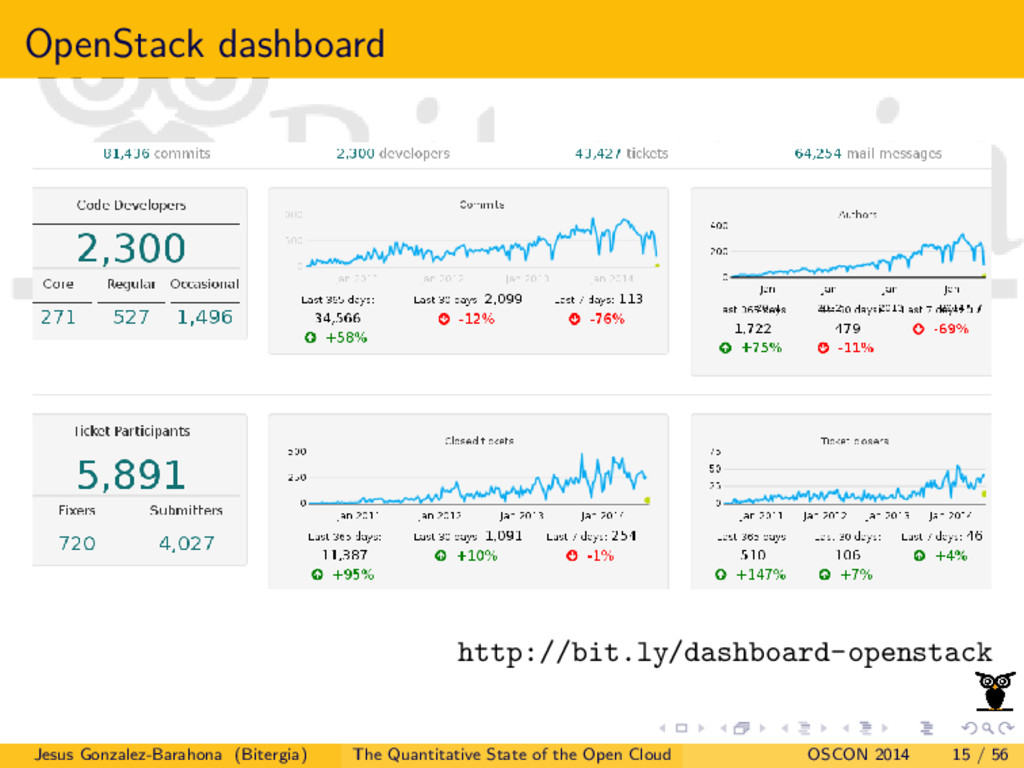
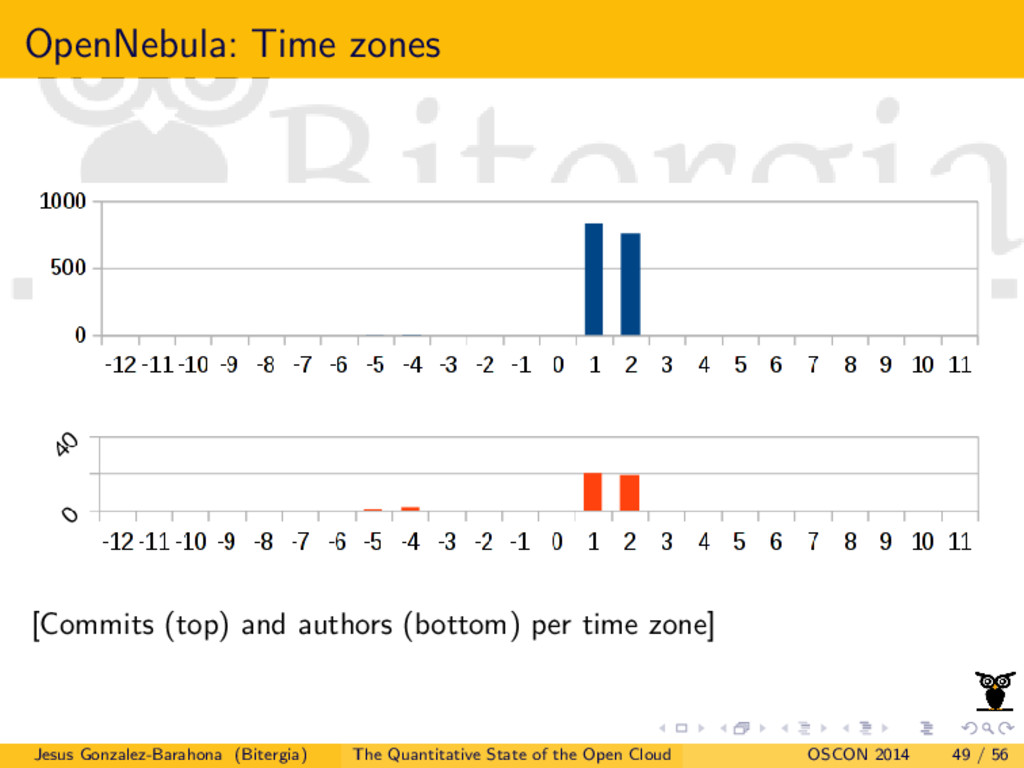
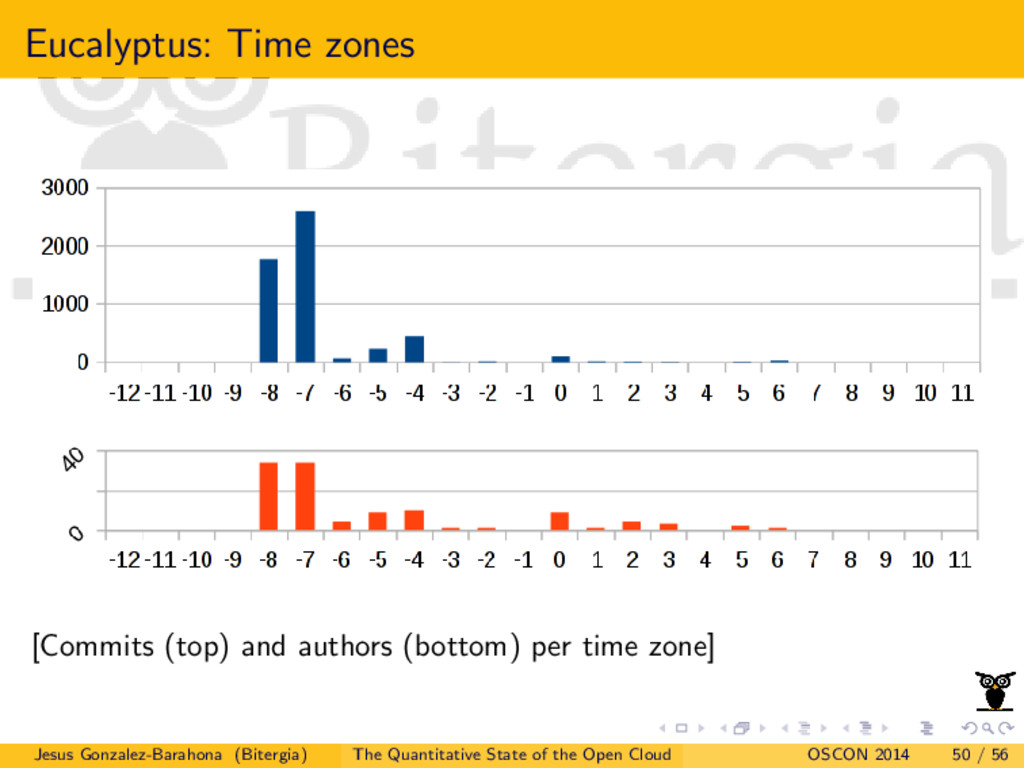
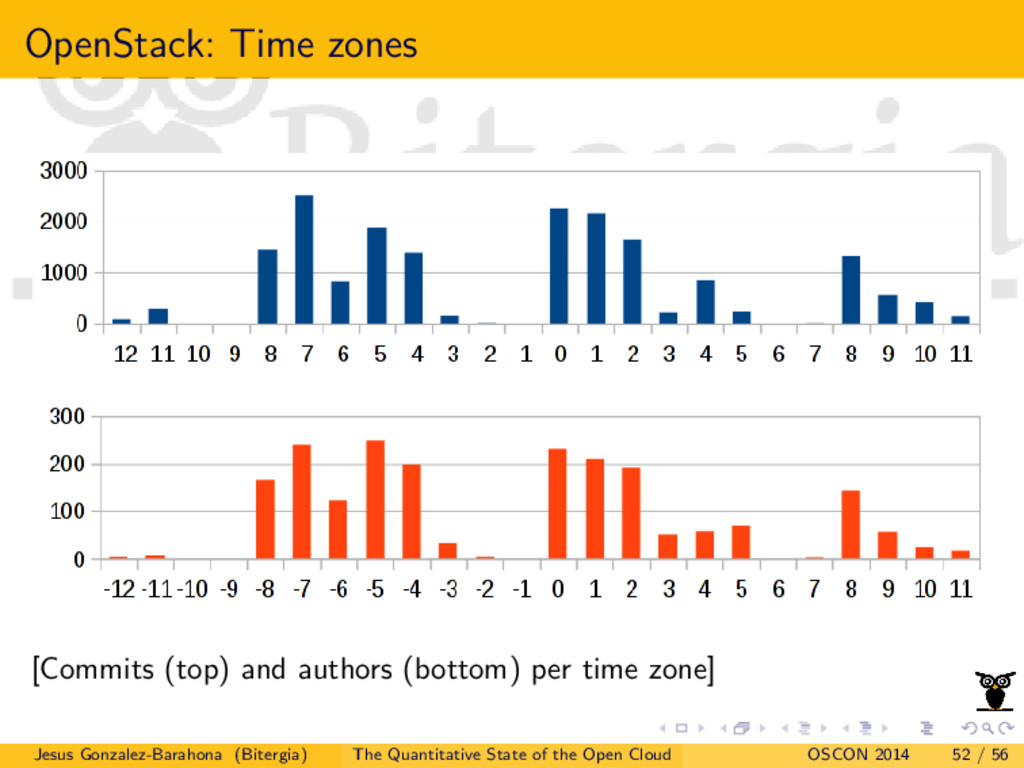
* Some visualizations of the most relevant aspects.

All the tools used to produce the analysis presented in this talk are free, open source software, based on the Grimoire technology http://vizgrimoire.github.io

More Decks by Jesus M. Gonzalez-Barahona

Other Decks in Technology

Transcript

  1. The quantitative state of the Open Cloud Jesus M. Gonzalez-Barahona

    [email protected] @jgbarah Bitergia / LibreSoft (URJC) http://bit.ly/oscon-opencloud Open Cloud Day, OSCON 2014 Portland, OR (USA), July 21st 2014 Jesus Gonzalez-Barahona (Bitergia) The Quantitative State of the Open Cloud OSCON 2014 1 / 56
  2. c 2012-2014 Bitergia Some rights reserved. This presentation is distributed

    under the “Attribution-ShareAlike 3.0” license, by Creative Commons, available at http://creativecommons.org/licenses/by-sa/3.0/ Jesus Gonzalez-Barahona (Bitergia) The Quantitative State of the Open Cloud OSCON 2014 2 / 56
  3. Structure of the presentation 1 The context 2 The study

    3 What: the source code 4 How: the process 5 Who: the community 6 The end Jesus Gonzalez-Barahona (Bitergia) The Quantitative State of the Open Cloud OSCON 2014 3 / 56
  4. Me, myself, my circumstances Bitergia: From research to the real

    world The software development analytics company Dashboards, reports, consultancy... Uni Rey Juan Carlos: LibreSoft research team Understanding free, open source software development Data analytics approach http://bitergia.com http://gsyc.es/~jgb Jesus Gonzalez-Barahona (Bitergia) The Quantitative State of the Open Cloud OSCON 2014 5 / 56
  5. All of them claim to be similar Similar in functionality

    ...but not exactly the same, differences may be important Free / open source software ...but different licenses, business models, languages All are popular ...but different market shares, different targets Jesus Gonzalez-Barahona (Bitergia) The Quantitative State of the Open Cloud OSCON 2014 9 / 56
  6. What we did, what we didn’t Focus on how they

    are developed: Source code: what do they produce? Processes: how are they performing? Community: who is contributing? We didn’t analyze: Functionality Run-time performance Popularity We produced a dashboard for each of the projects Jesus Gonzalez-Barahona (Bitergia) The Quantitative State of the Open Cloud OSCON 2014 11 / 56
  7. Transparency analysis Did we have data for all of them?

    Public source code management (git) and issue tracking systems All code seems to land in git at some point OpenStack and CloudStack: all tickets in public issue tracking system OpenNebula and Eucalyptus: maybe not all tickets in public issue tracking systems Jesus Gonzalez-Barahona (Bitergia) The Quantitative State of the Open Cloud OSCON 2014 16 / 56
  8. Size Files Code Comments OpenStack 14,5 K 1,841 K 406

    K CloudStack 7,7 K 1,544 K 394 K Eucalyptus 8,0 K 1,148 K 329 K OpenNebula 1,1 K 193 K 59 K Source code in git repositories, July 2014 Jesus Gonzalez-Barahona (Bitergia) The Quantitative State of the Open Cloud OSCON 2014 18 / 56
  9. OpenNebula: Tickets [Green: tickets opened per month / Blue: tickets

    closed per month] Jesus Gonzalez-Barahona (Bitergia) The Quantitative State of the Open Cloud OSCON 2014 28 / 56
  10. Eucalyptus: Tickets [Green: tickets opened per month / Blue: tickets

    closed per month] Jesus Gonzalez-Barahona (Bitergia) The Quantitative State of the Open Cloud OSCON 2014 29 / 56
  11. CloudStack: Tickets [Green: tickets opened per month / Blue: tickets

    closed per month] Jesus Gonzalez-Barahona (Bitergia) The Quantitative State of the Open Cloud OSCON 2014 30 / 56
  12. OpenStack: Tickets [Green: tickets opened per month / Blue: tickets

    closed per month] Jesus Gonzalez-Barahona (Bitergia) The Quantitative State of the Open Cloud OSCON 2014 31 / 56
  13. OpenNebula: Evolution of core team 2012-S2 2013-S1 2013-S2 2014-S1 0

    1 2 3 4 5 5 4 5 5 scm_core Core team contributes with 80 % commits Jesus Gonzalez-Barahona (Bitergia) The Quantitative State of the Open Cloud OSCON 2014 37 / 56
  14. Eucalyptus: Evolution of core team 2012-S2 2013-S1 2013-S2 2014-S1 0

    5 10 15 20 16 19 15 13 scm_core Core team contributes with 80 % commits Jesus Gonzalez-Barahona (Bitergia) The Quantitative State of the Open Cloud OSCON 2014 38 / 56
  15. CloudStack: Evolution of core team 2012-S2 2013-S1 2013-S2 2014-S1 0

    5 10 15 20 25 30 19 25 30 29 scm_core Core team contributes with 80 % commits Jesus Gonzalez-Barahona (Bitergia) The Quantitative State of the Open Cloud OSCON 2014 39 / 56
  16. OpenStack: Evolution of core team 2012-S2 2013-S1 2013-S2 2014-S1 0

    50 100 150 200 250 300 97 153 218 260 scm_core Core team contributes with 80 % commits Jesus Gonzalez-Barahona (Bitergia) The Quantitative State of the Open Cloud OSCON 2014 40 / 56
  17. OpenNebula: Time zones [Commits (top) and authors (bottom) per time

    zone] Jesus Gonzalez-Barahona (Bitergia) The Quantitative State of the Open Cloud OSCON 2014 49 / 56
  18. Eucalyptus: Time zones [Commits (top) and authors (bottom) per time

    zone] Jesus Gonzalez-Barahona (Bitergia) The Quantitative State of the Open Cloud OSCON 2014 50 / 56
  19. CloudStack: Time zones [Commits (top) and authors (bottom) per time

    zone] Jesus Gonzalez-Barahona (Bitergia) The Quantitative State of the Open Cloud OSCON 2014 51 / 56
  20. OpenStack: Time zones [Commits (top) and authors (bottom) per time

    zone] Jesus Gonzalez-Barahona (Bitergia) The Quantitative State of the Open Cloud OSCON 2014 52 / 56
  21. Final considerations There are huge differences in most of the

    metrics But we cannot define good or bad: that depends on your target Look at the details... ...and draw your own conclusions The bottom line: the Open Cloud is really transparent you can drill down to any level of detail Jesus Gonzalez-Barahona (Bitergia) The Quantitative State of the Open Cloud OSCON 2014 54 / 56
  22. Disclamer and transparency package OpenStack Foundation and Citrix are Bitergia’s

    customers They fund the OpenStack and the CloudStack dashboards All the data has been checked, but could have some errors All database dumps and resulting JSON files are available from the corresponding dashboards. Jesus Gonzalez-Barahona (Bitergia) The Quantitative State of the Open Cloud OSCON 2014 55 / 56
  23. Final note Show me the numbers! OpenNebula dashboard: http://bit.ly/dashboard-opennebula Eucalyptus

    dashboard: http://bit.ly/dashboard-eucalyptus CloudStack dashboard: http://bit.ly/dashboard-cloudstack OpenStack dashboard: http://bit.ly/dashboard-openstack This presentation: http://bit.ly/oscon-opencloud Jesus Gonzalez-Barahona (Bitergia) The Quantitative State of the Open Cloud OSCON 2014 56 / 56