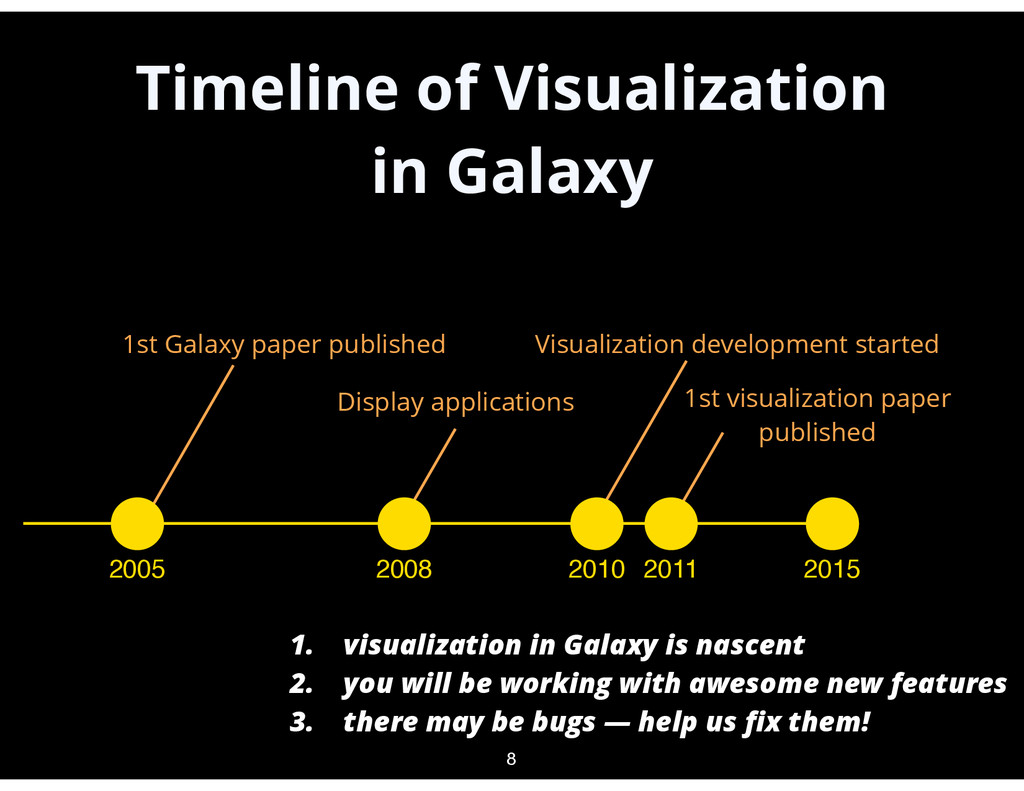
Galaxy paper published Visualization development started 2011 1st visualization paper published 2008 Display applications 1. visualization in Galaxy is nascent 2. you will be working with awesome new features 3. there may be bugs — help us fix them!
data in Galaxy ✦ biological visualizations ✦ numerical visualizations ✦ what Galaxy is doing underneath the covers • Instructors: feedback from you about what you like, don’t like, and where to go next 9
like tools • A visualization can be added to Galaxy via a configuration file that specifies: ✦ datasets that can be used ✦ location of visualization code (client-side or on server) • Galaxy handles visualization integration and data management ✦ users can focus on analyzing data ✦ developers can focus on creating visualizations 10
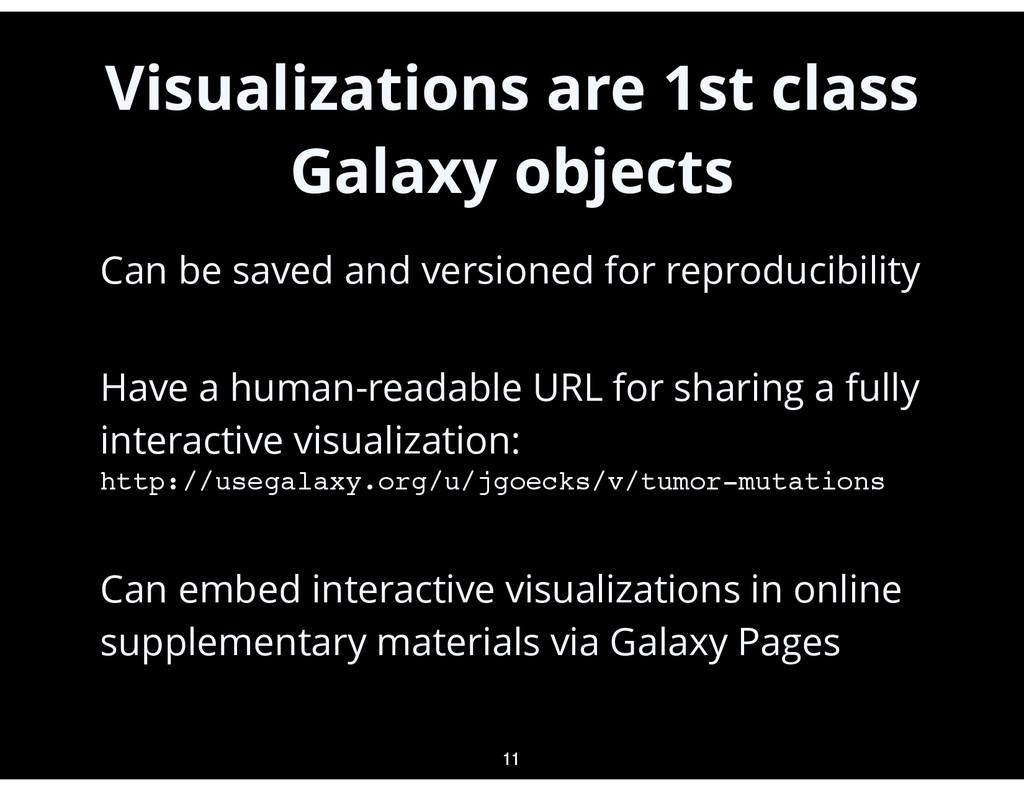
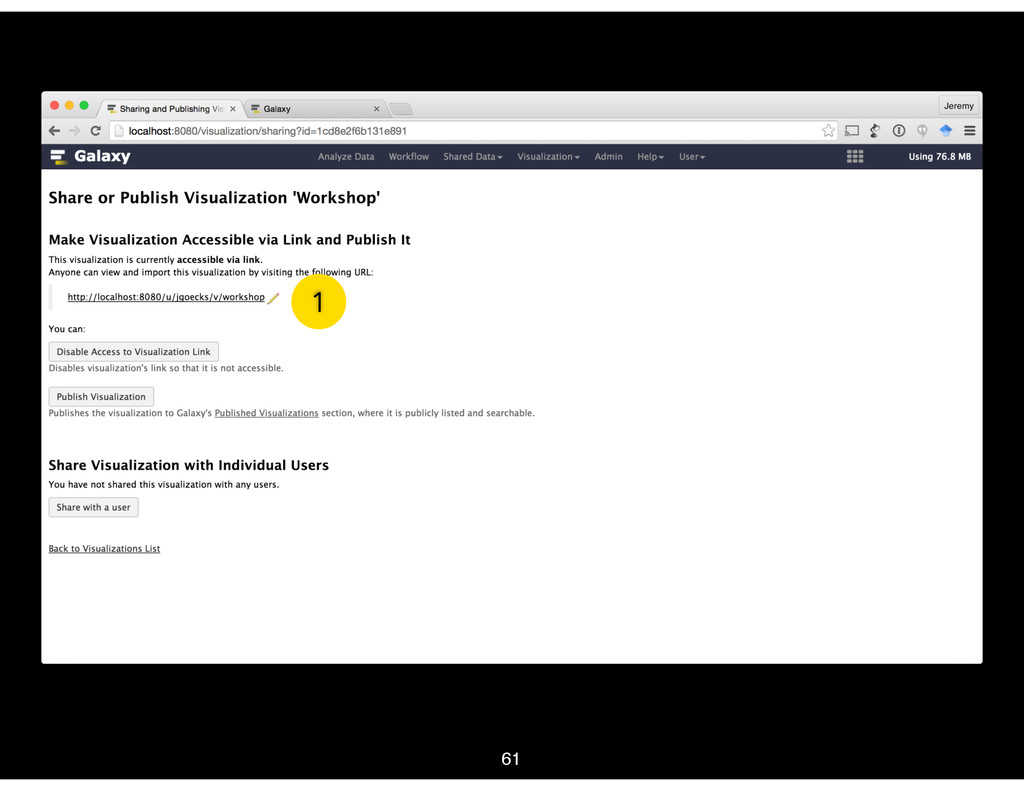
and versioned for reproducibility • Have a human-readable URL for sharing a fully interactive visualization: http://usegalaxy.org/u/jgoecks/v/tumor-mutations • Can embed interactive visualizations in online supplementary materials via Galaxy Pages 11
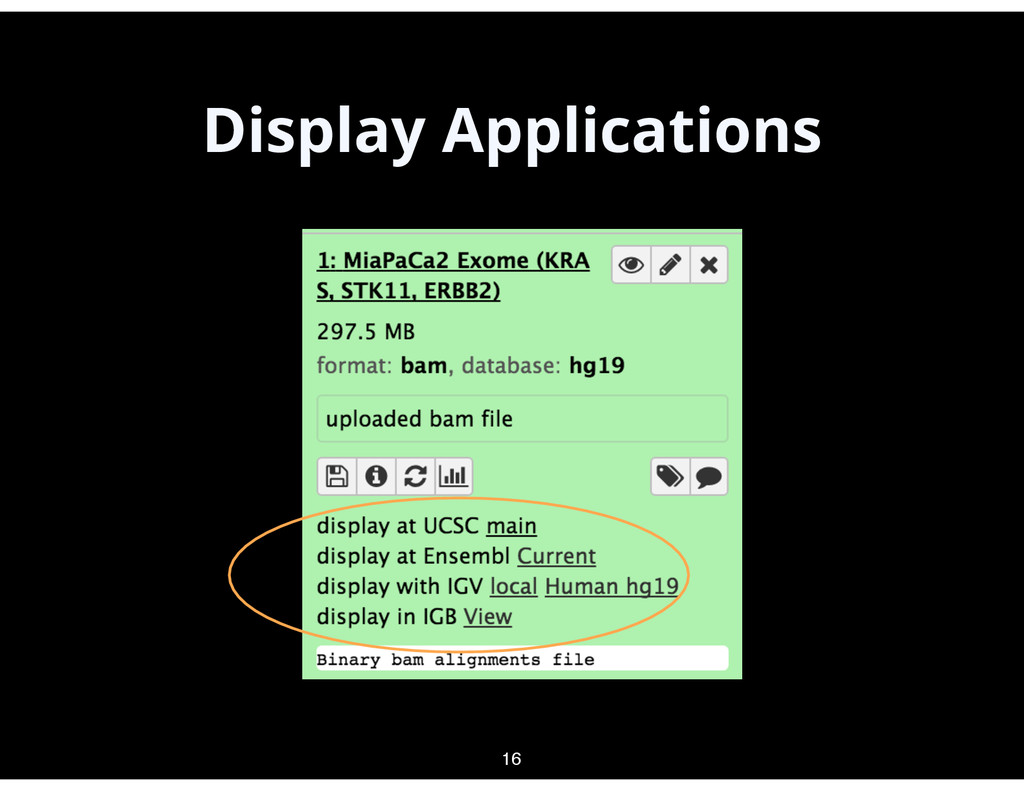
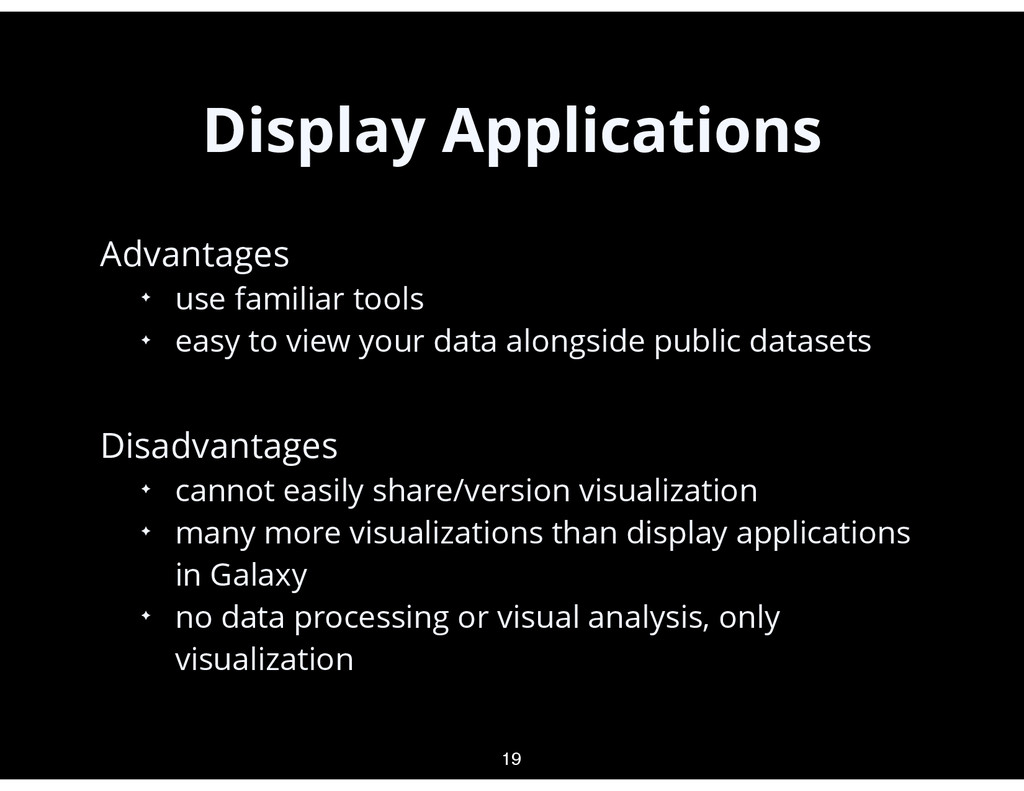
to view your data alongside public datasets • Disadvantages ✦ cannot easily share/version visualization ✦ many more visualizations than display applications in Galaxy ✦ no data processing or visual analysis, only visualization 19
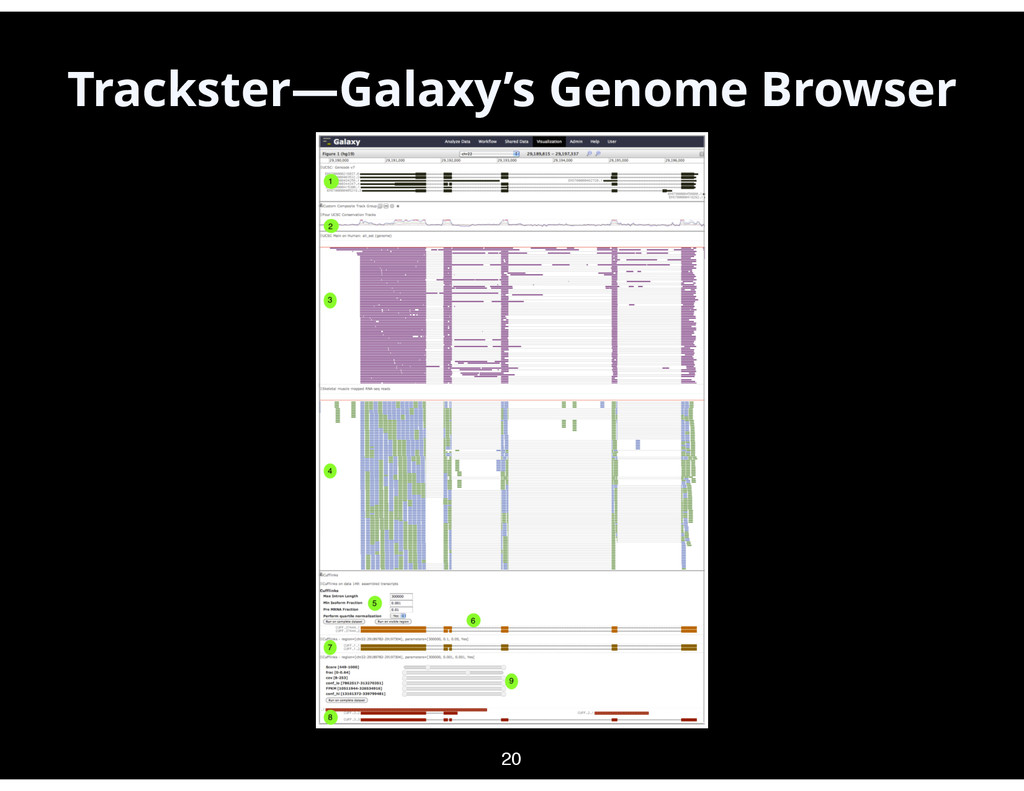
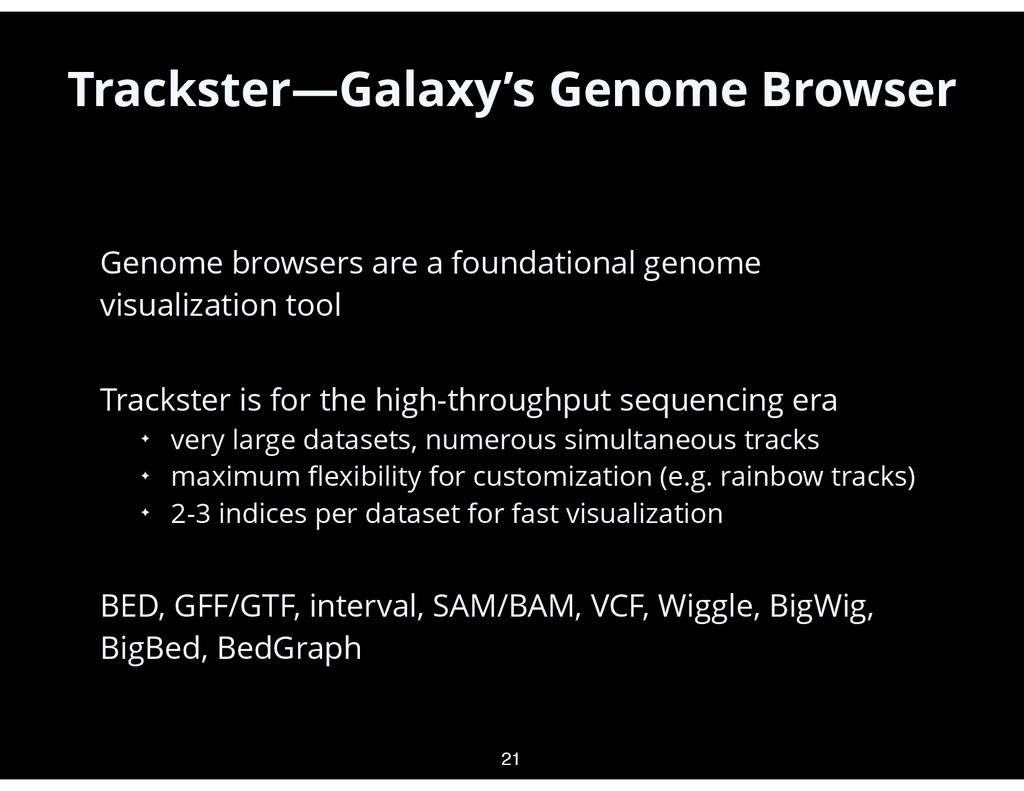
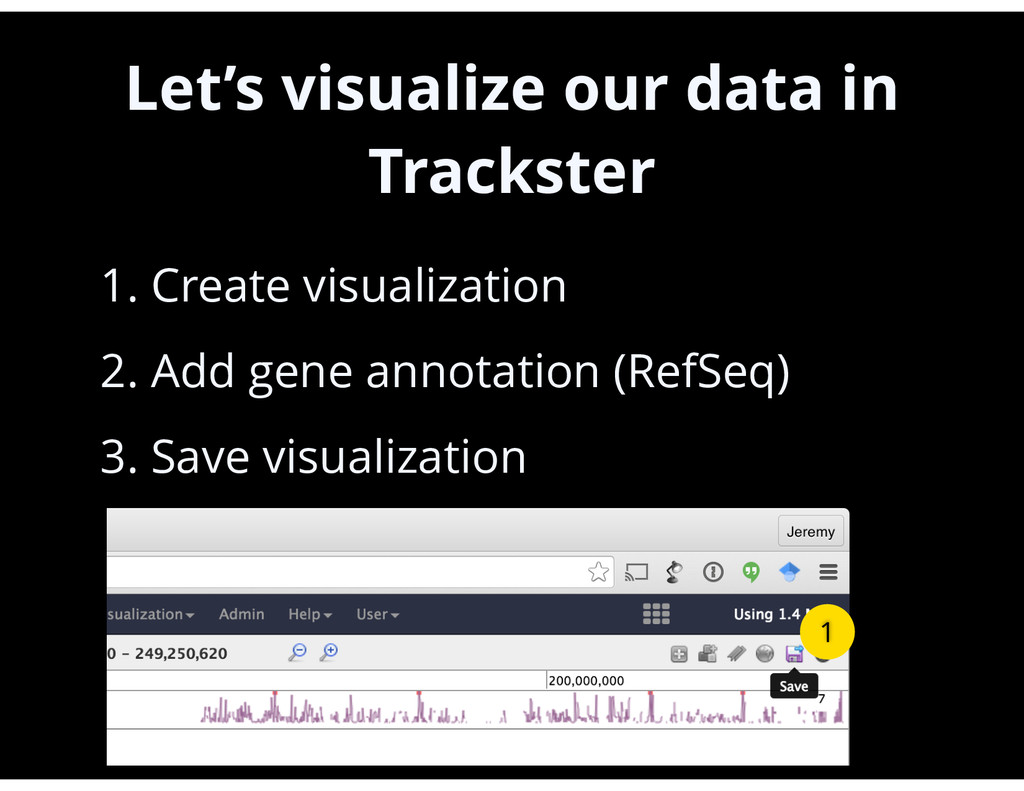
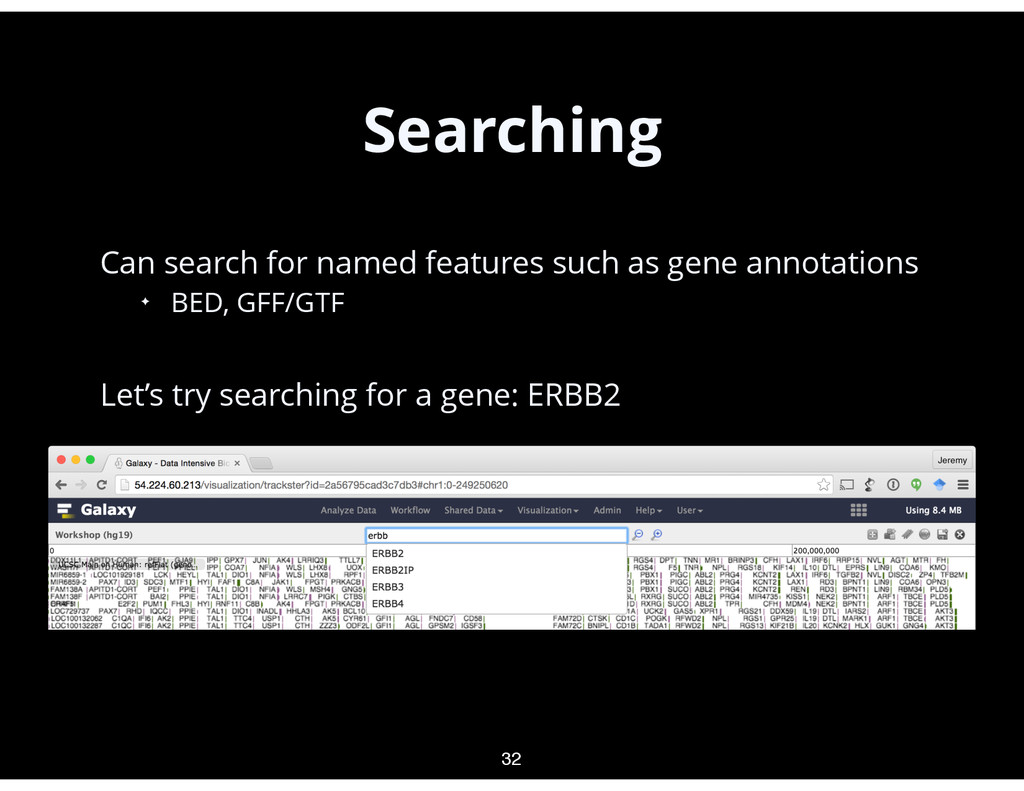
Trackster is for the high-throughput sequencing era ✦ very large datasets, numerous simultaneous tracks ✦ maximum flexibility for customization (e.g. rainbow tracks) ✦ 2-3 indices per dataset for fast visualization • BED, GFF/GTF, interval, SAM/BAM, VCF, Wiggle, BigWig, BigBed, BedGraph 21 Trackster—Galaxy’s Genome Browser
viewing large genomic regions (coverage plots) ✦ viewing small genomic regions (getting individual data points) ✦ feature names and locations • Indexes is the primary way that big datasets are visualized quickly 30
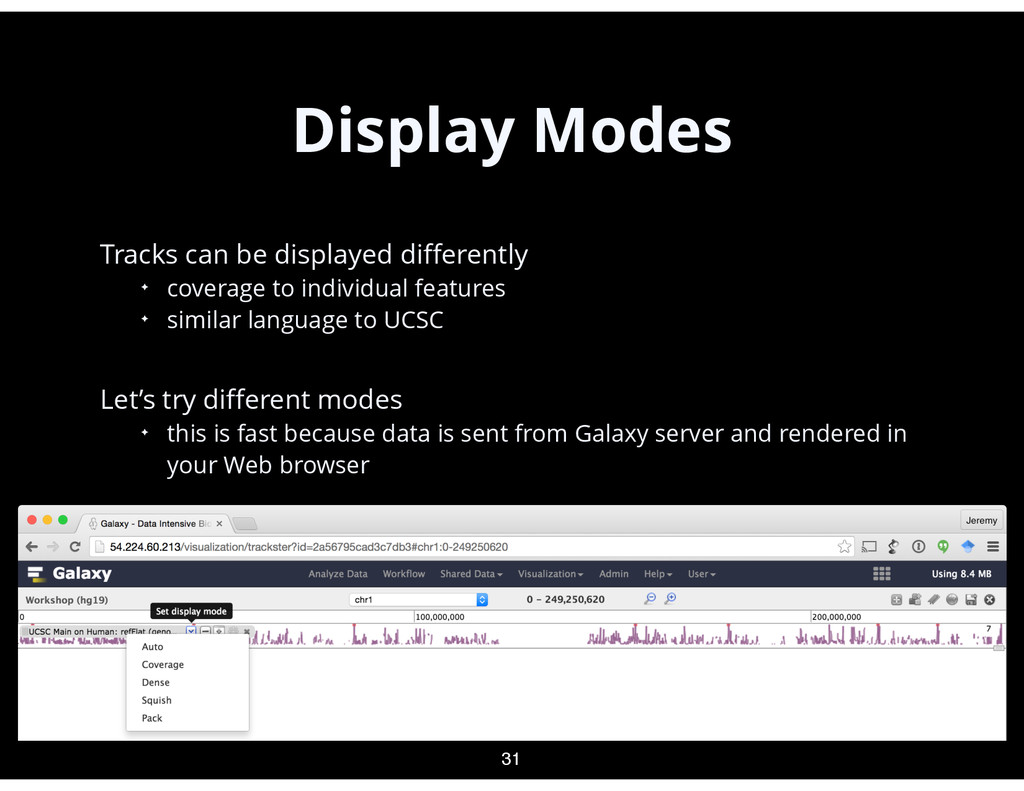
to individual features ✦ similar language to UCSC • Let’s try different modes ✦ this is fast because data is sent from Galaxy server and rendered in your Web browser 31
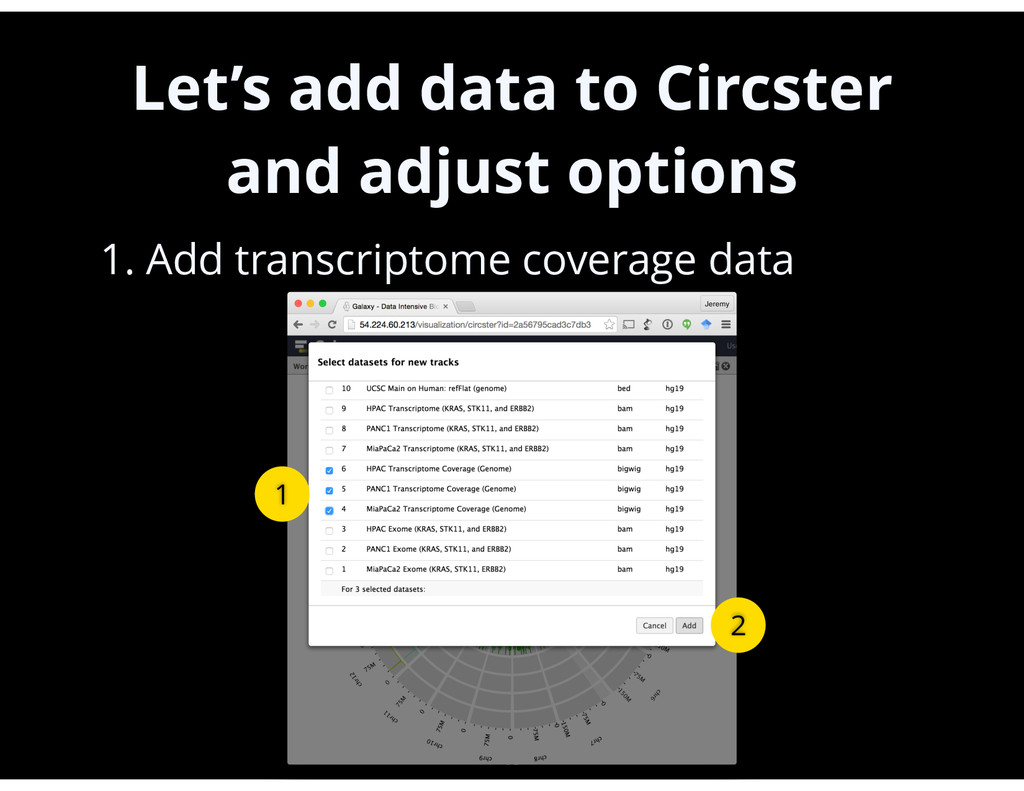
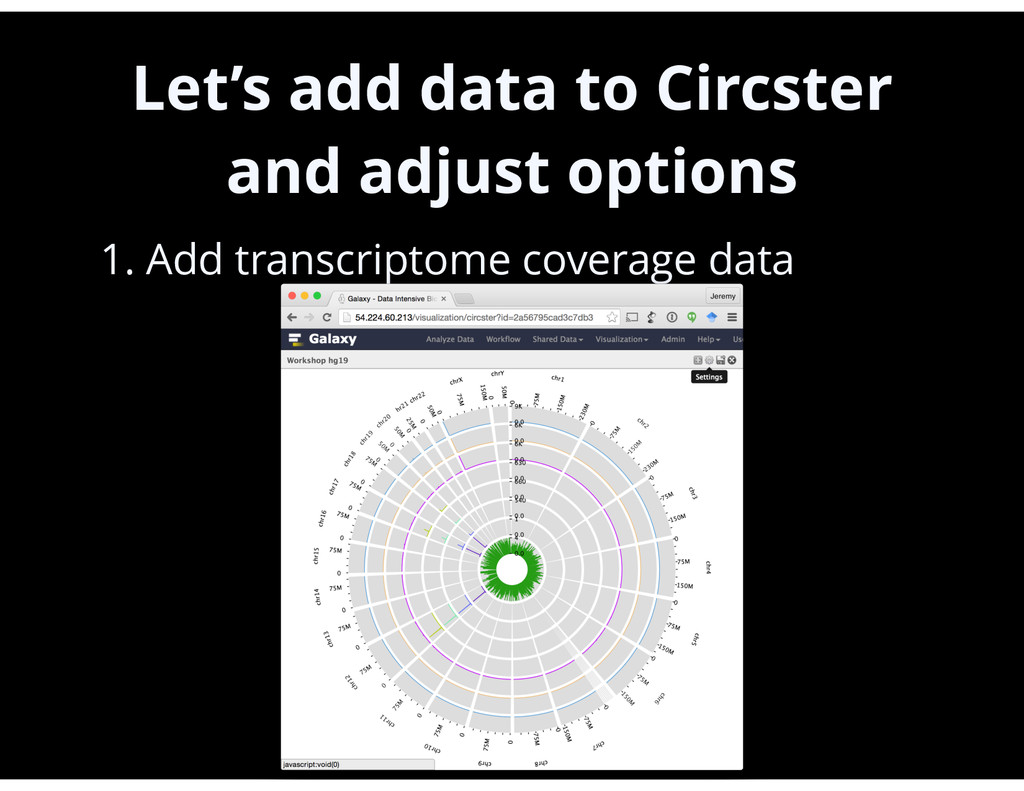
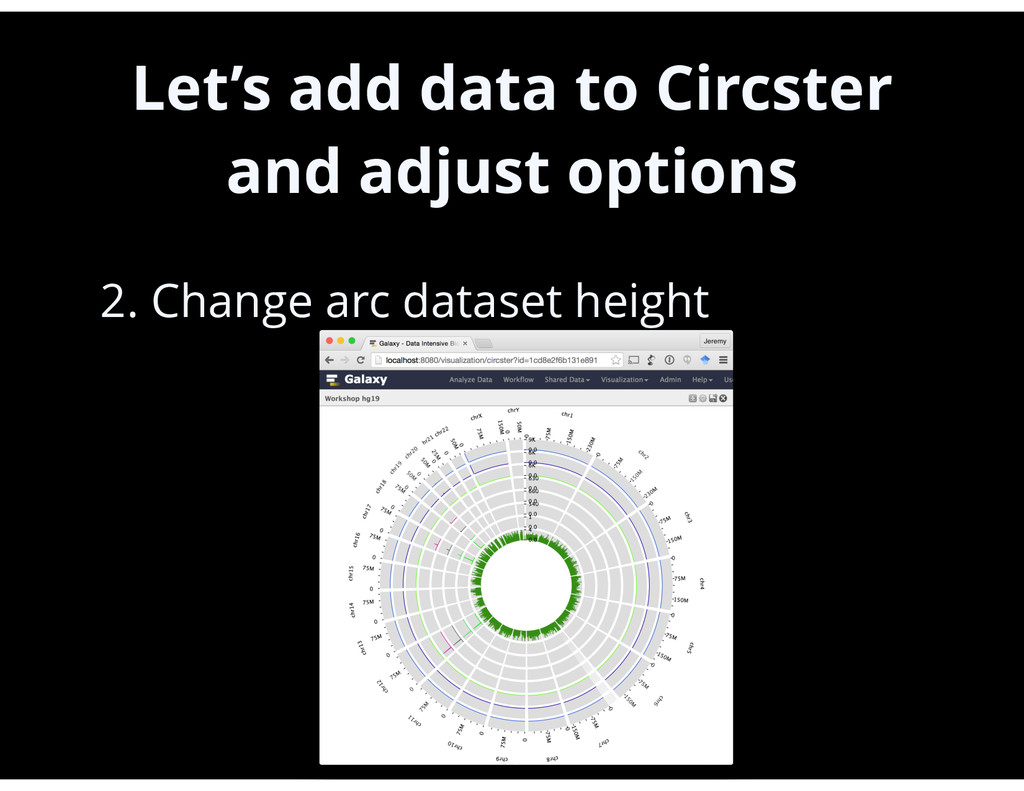
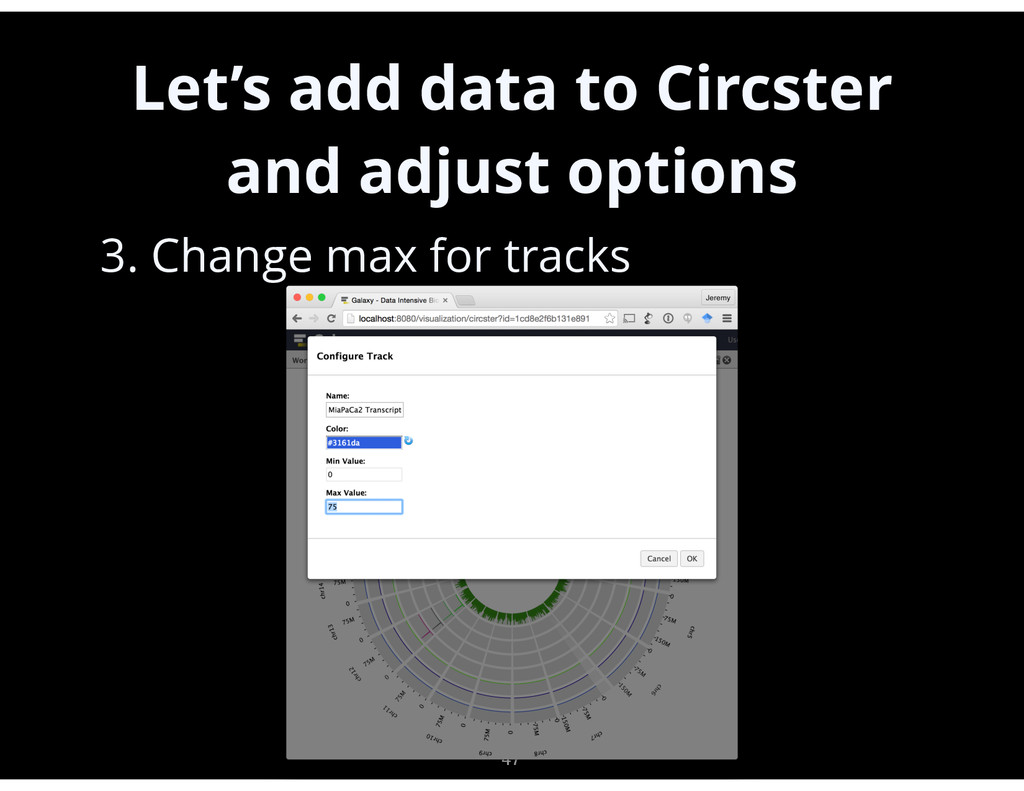
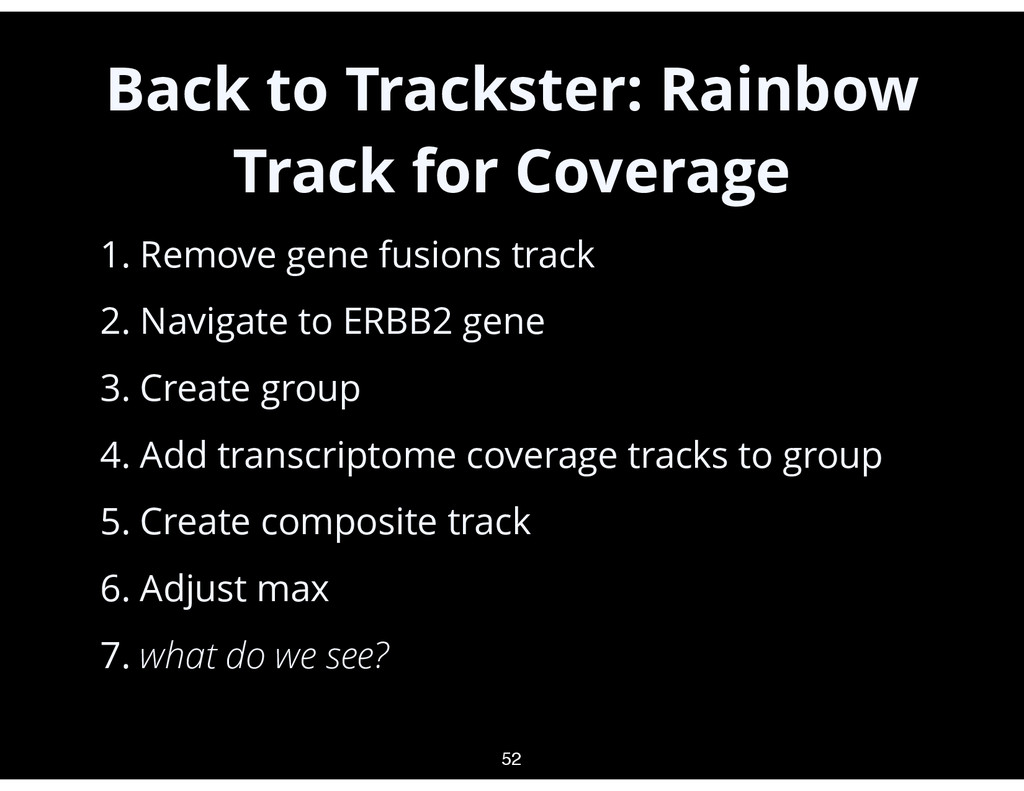
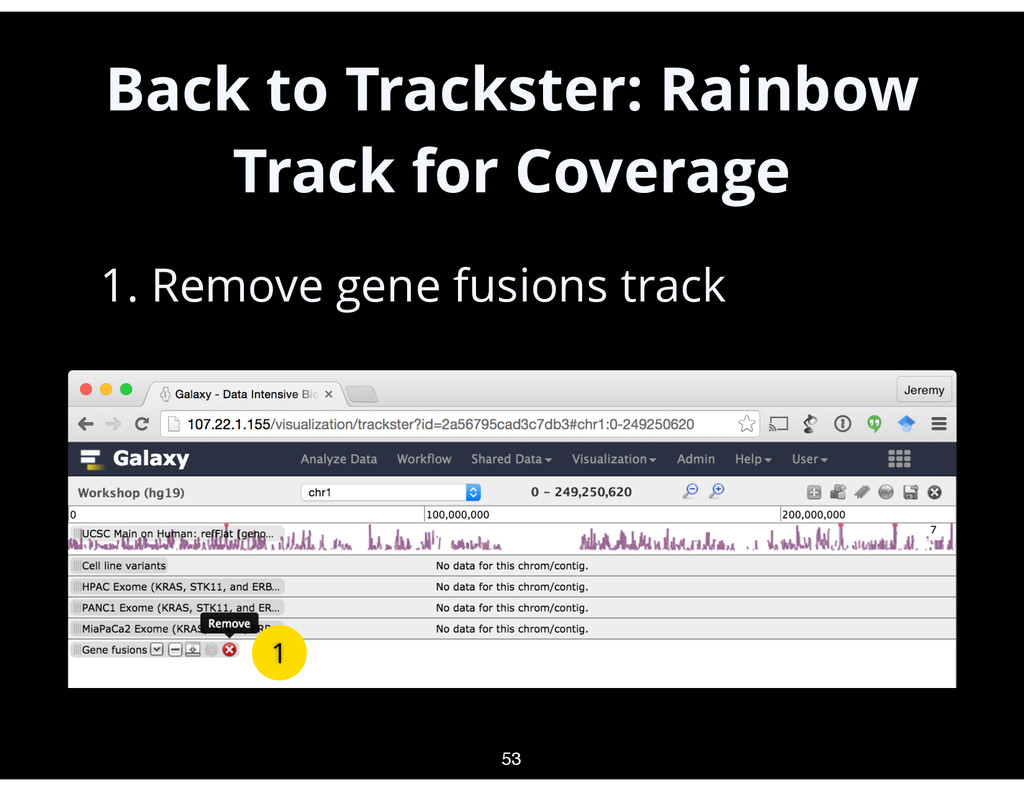
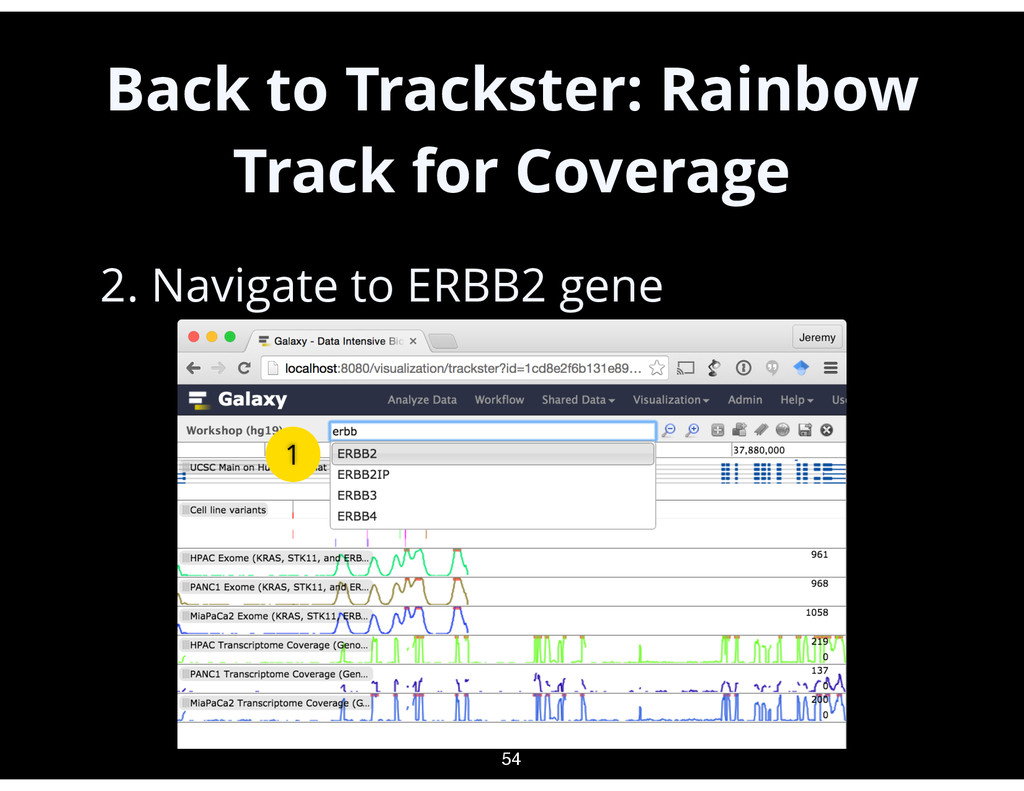
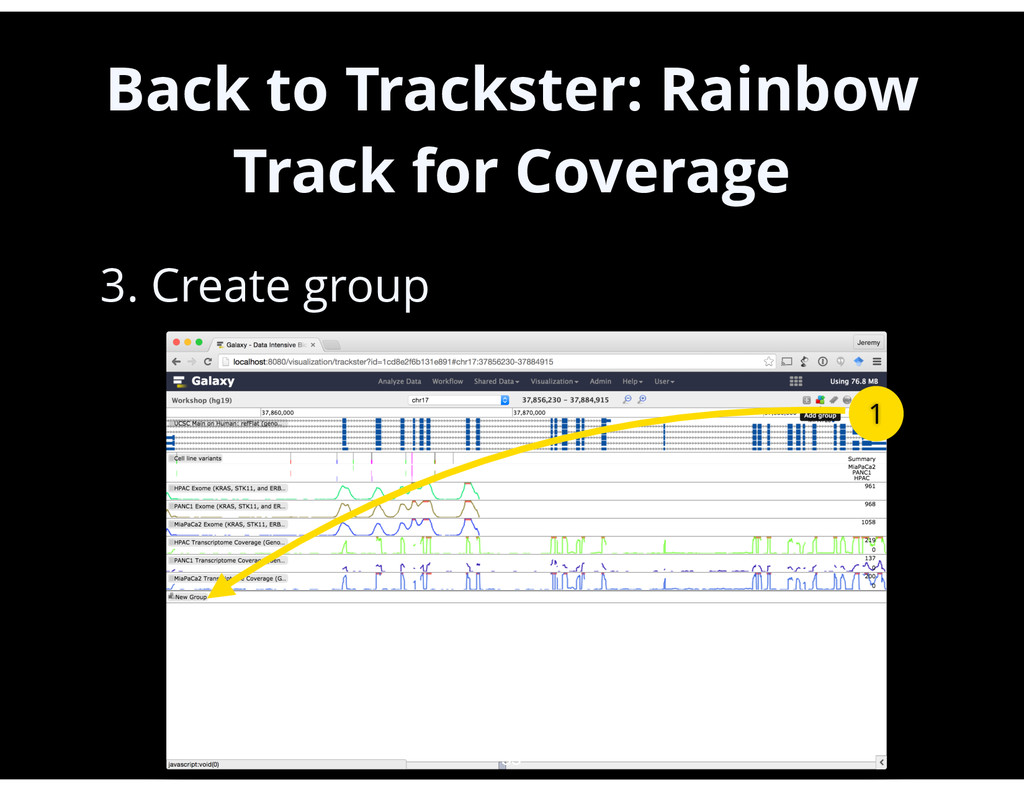
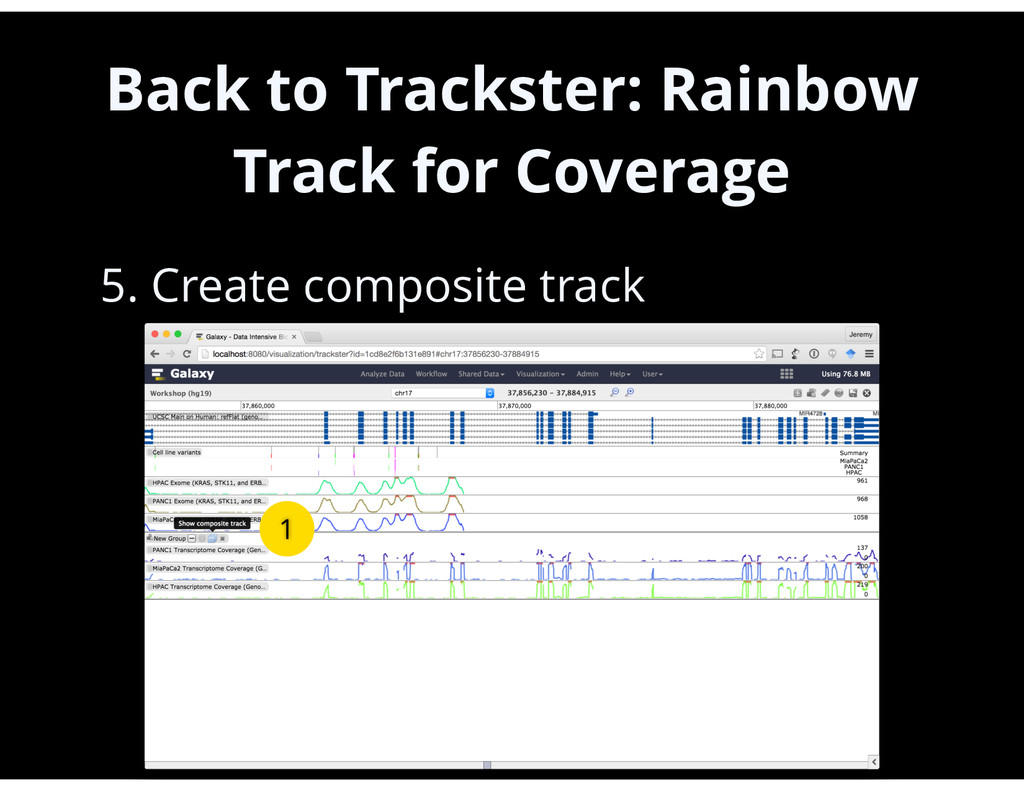
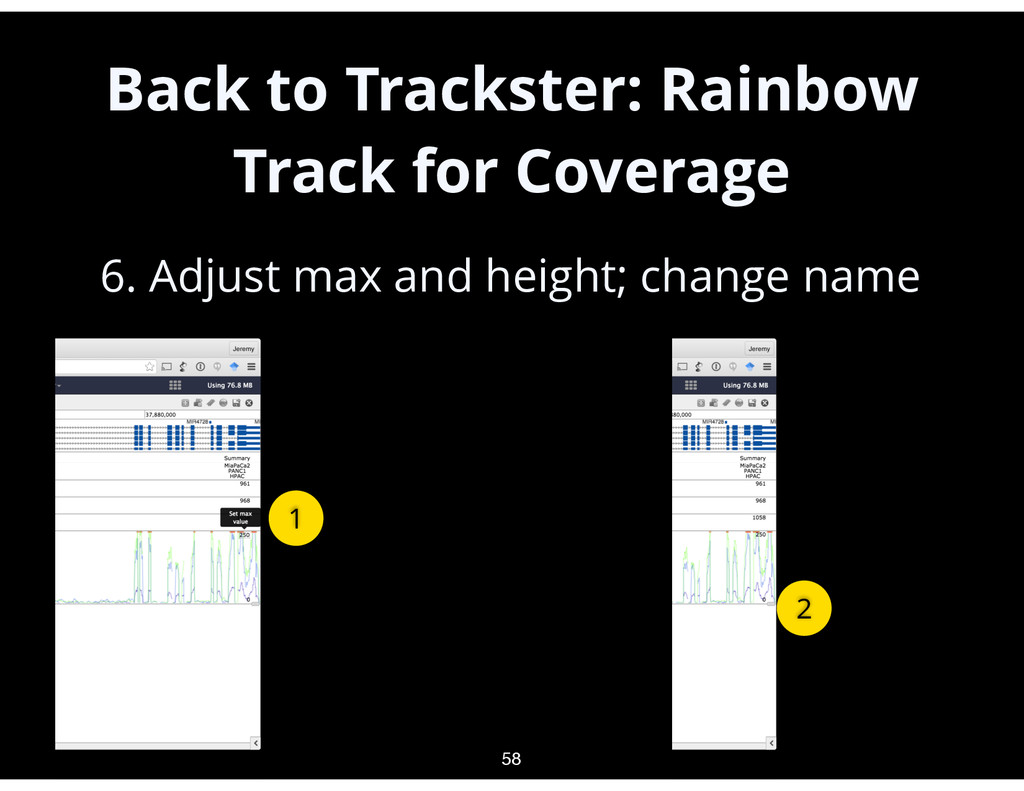
gene fusions track • 2. Navigate to ERBB2 gene • 3. Create group • 4. Add transcriptome coverage tracks to group • 5. Create composite track • 6. Adjust max • 7. what do we see? 52
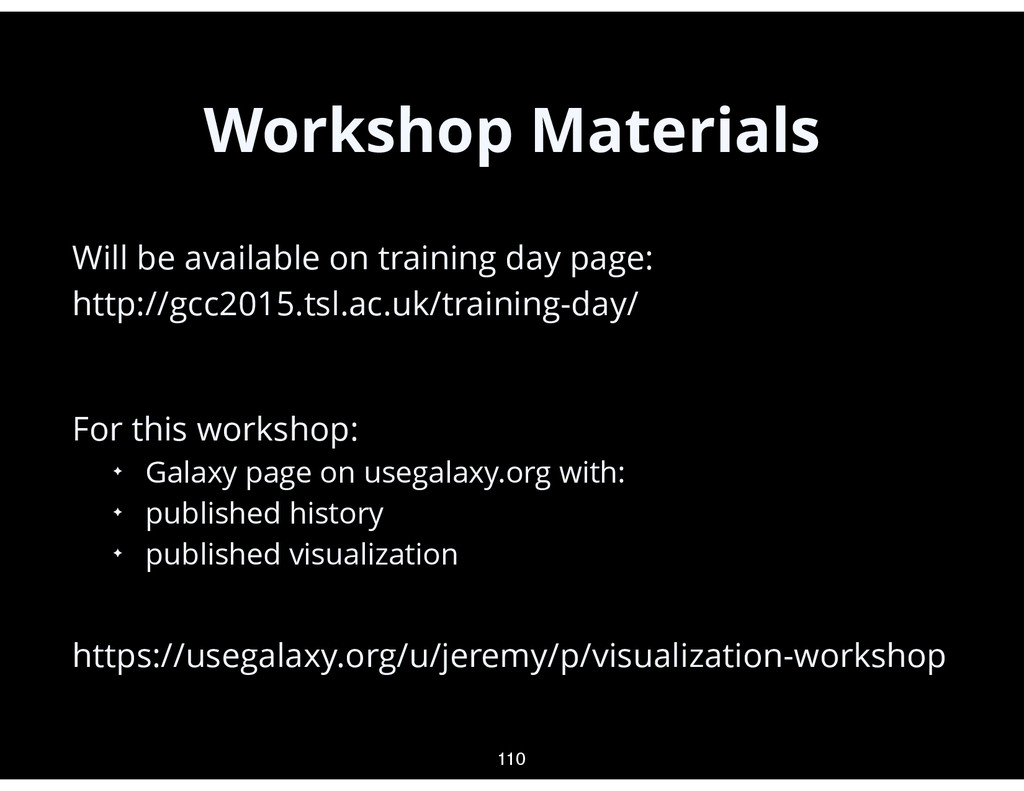
http://gcc2015.tsl.ac.uk/training-day/ • For this workshop: ✦ Galaxy page on usegalaxy.org with: ✦ published history ✦ published visualization • https://usegalaxy.org/u/jeremy/p/visualization-workshop 110