Upgrade to Pro — share decks privately, control downloads, hide ads and more …

Getting more out of Matplotlib with GR

Getting more out of Matplotlib with GR

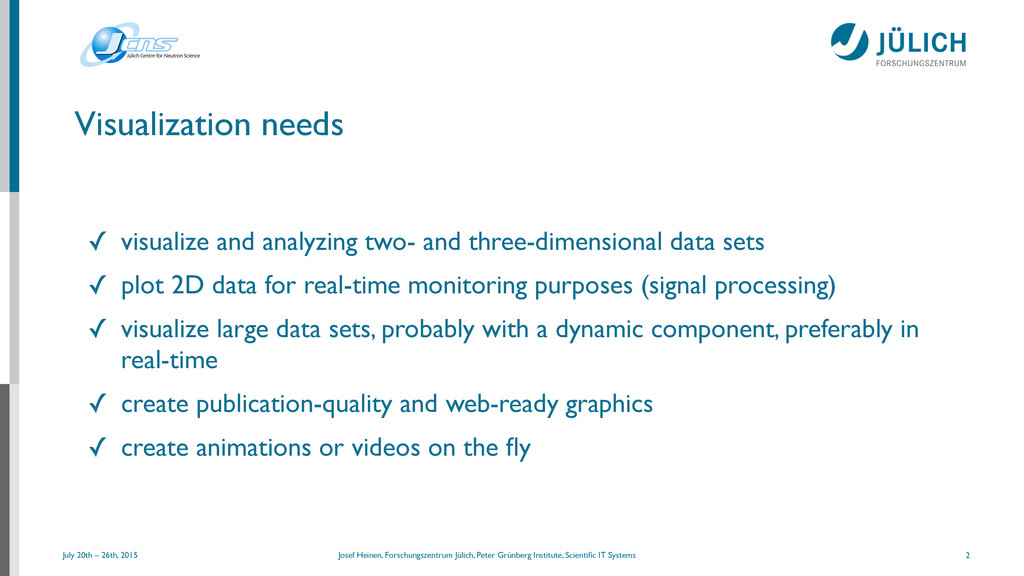
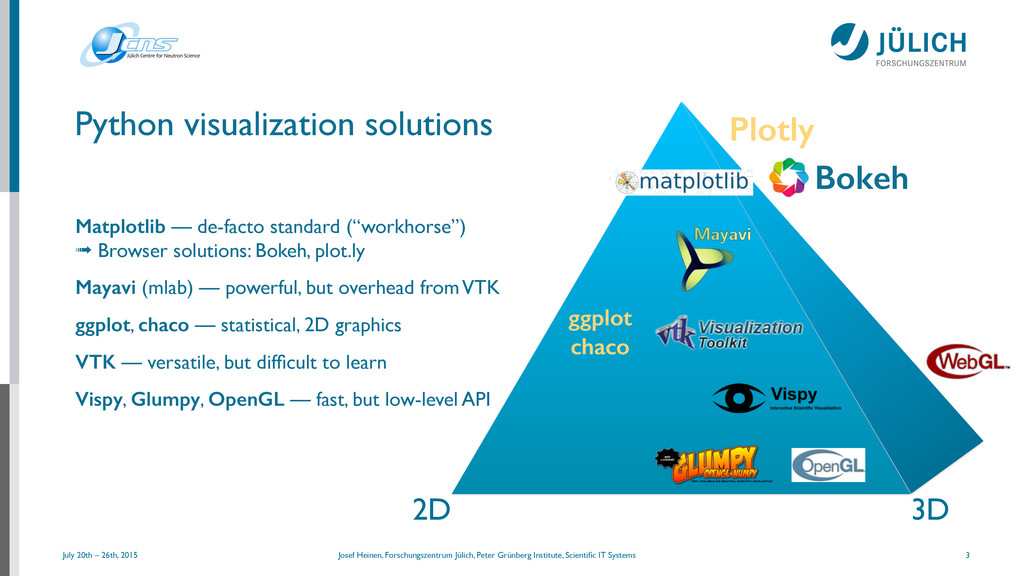
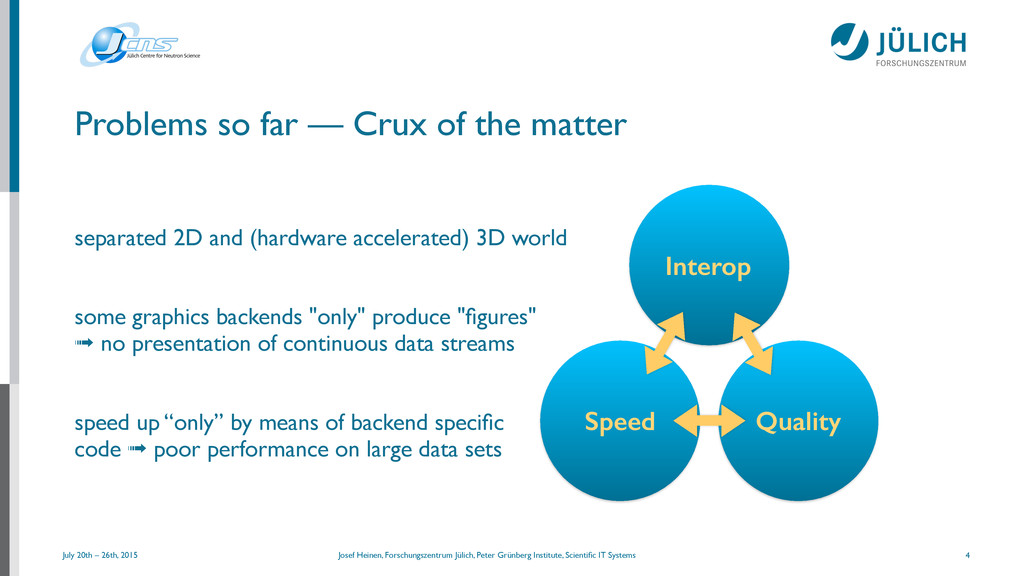
Python is well established in software development departments of research and industry, not least because of the proliferation of libraries such as SciPy and Matplotlib. However, when processing large amounts of data, in particular in combination with GUI toolkits (Qt) or three-dimensional visualizations (OpenGL), Python as an interpretative programming language seems to be reaching its limits. In particular, large amounts of data or the visualization of three-dimensional scenes may overwhelm the system.

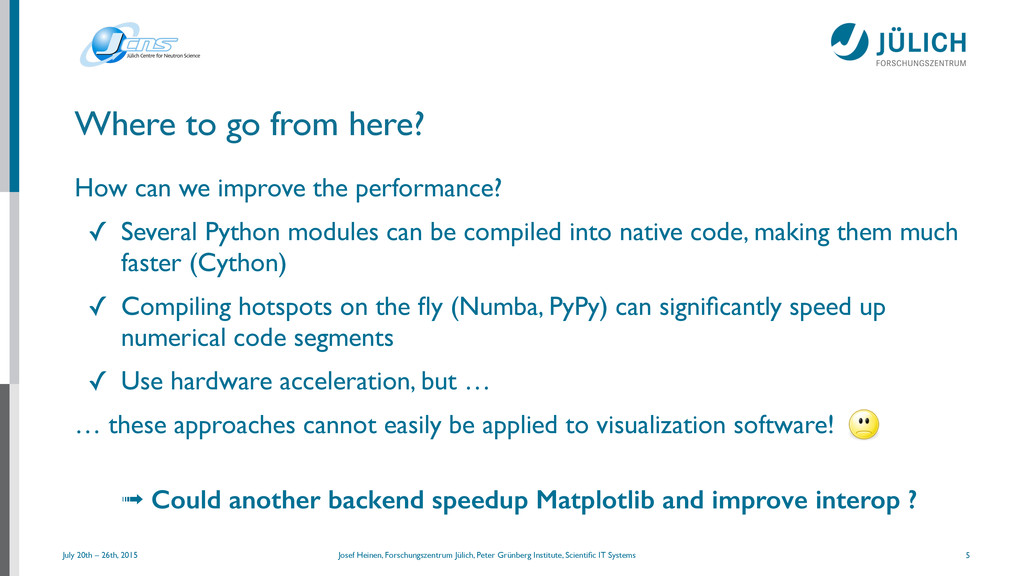
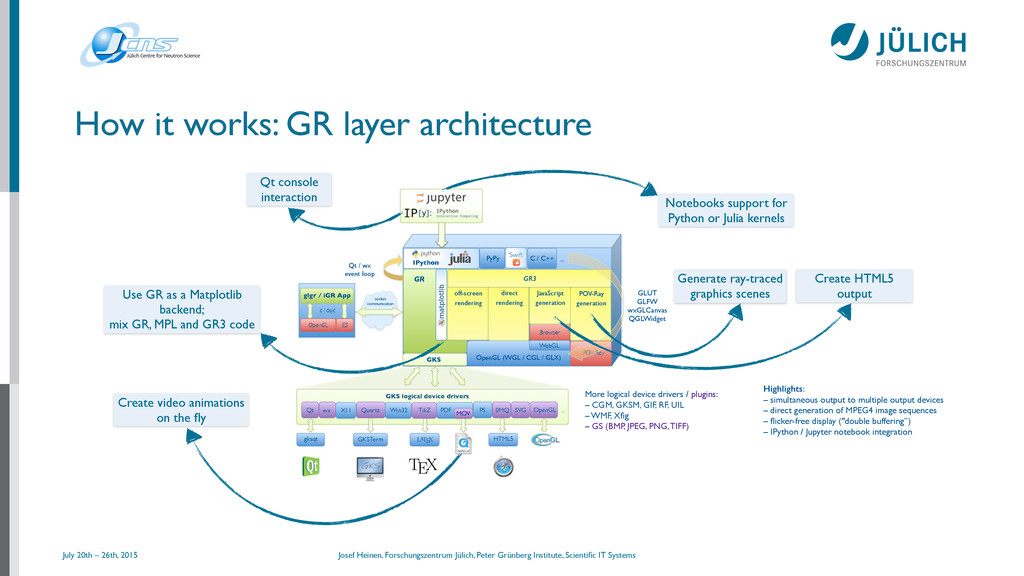
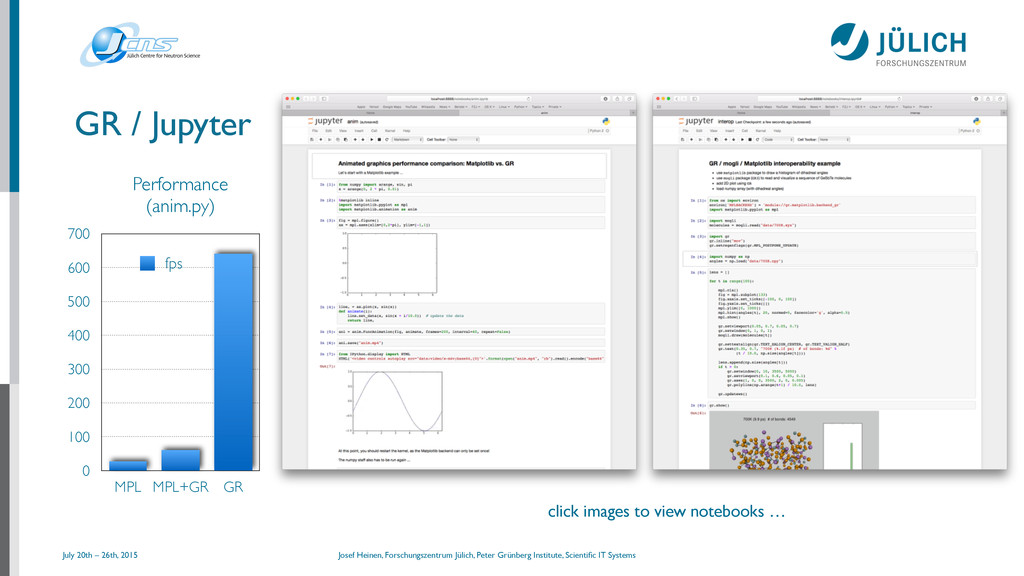
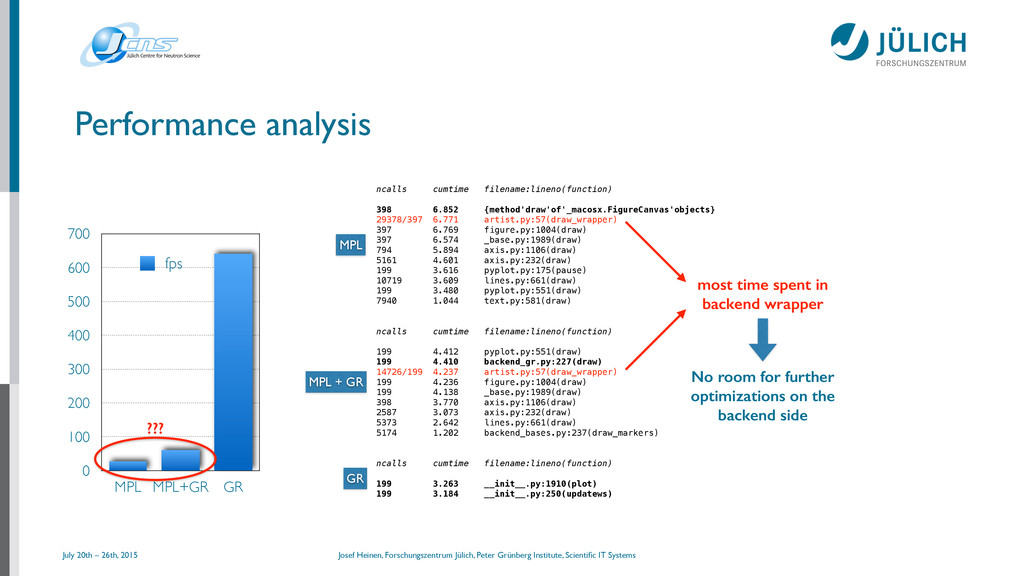
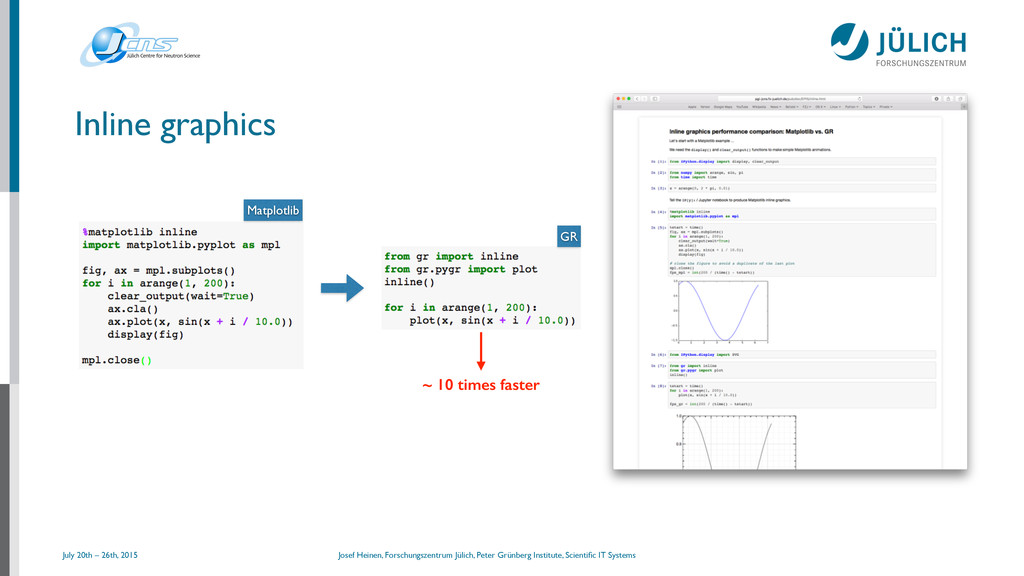
This presentation shows how visualization applications with special performance requirements can be designed on the basis of Matplotlib and GR, a high-performance visualization library for Linux, OS X and Windows. The lecture focuses on the development of a new graphics backend for Matplotlib based on the GR framework. By combining the power of those libraries the responsiveness of animated visualization applications and their resulting frame rates can be improved significantly. This in turn allows the use of Matplotlib in real-time environments, for example in the area of signal processing.

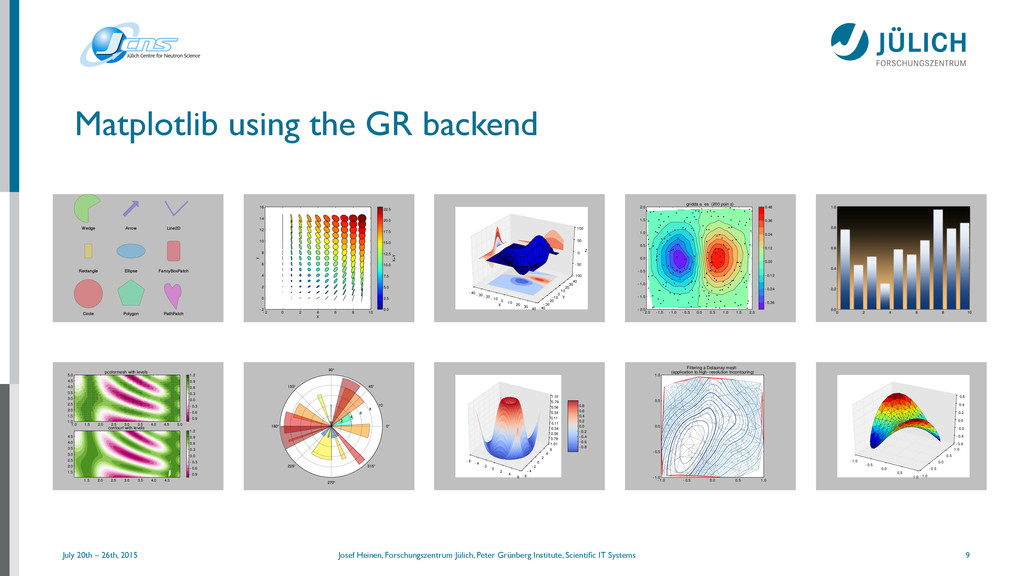
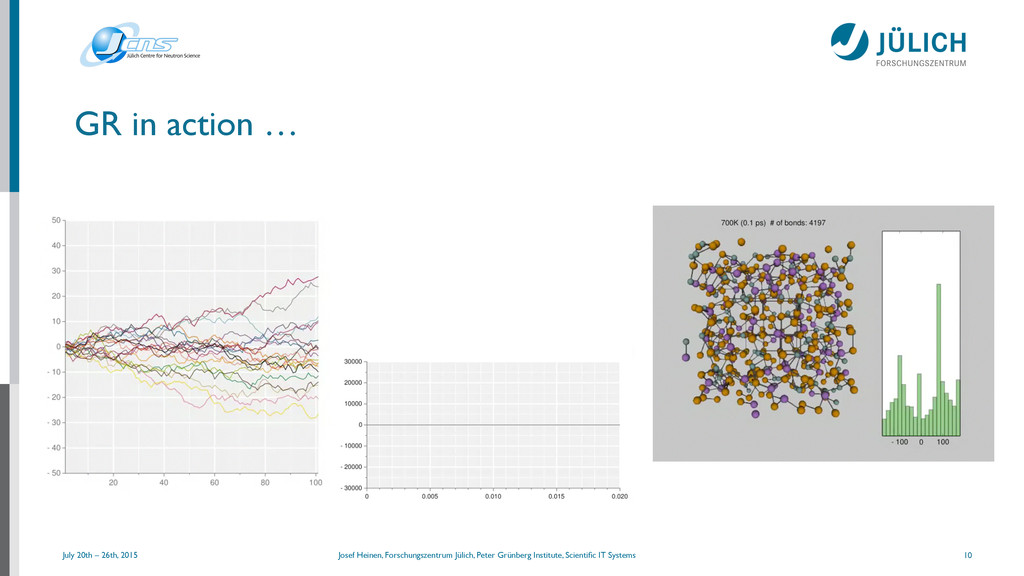
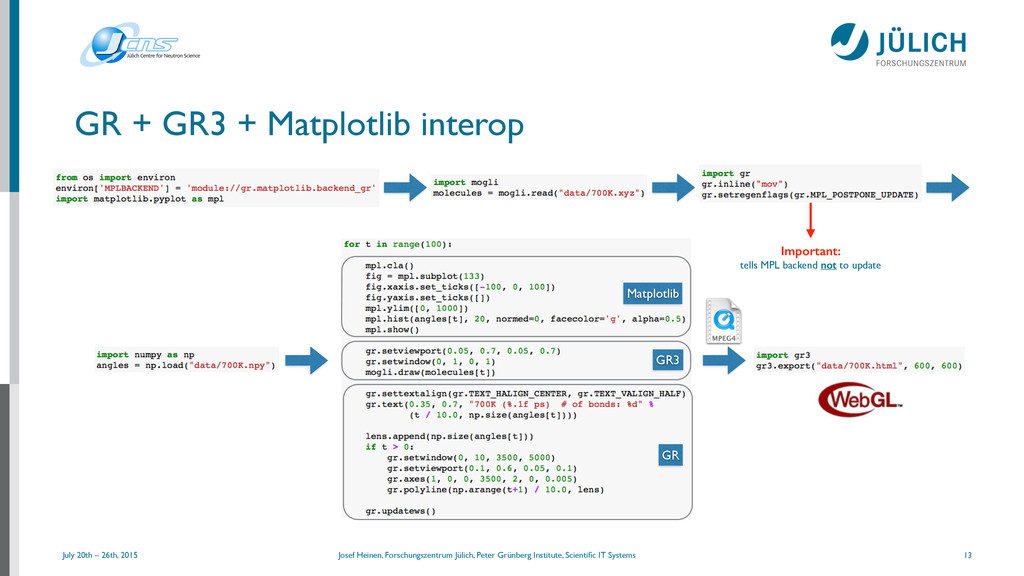
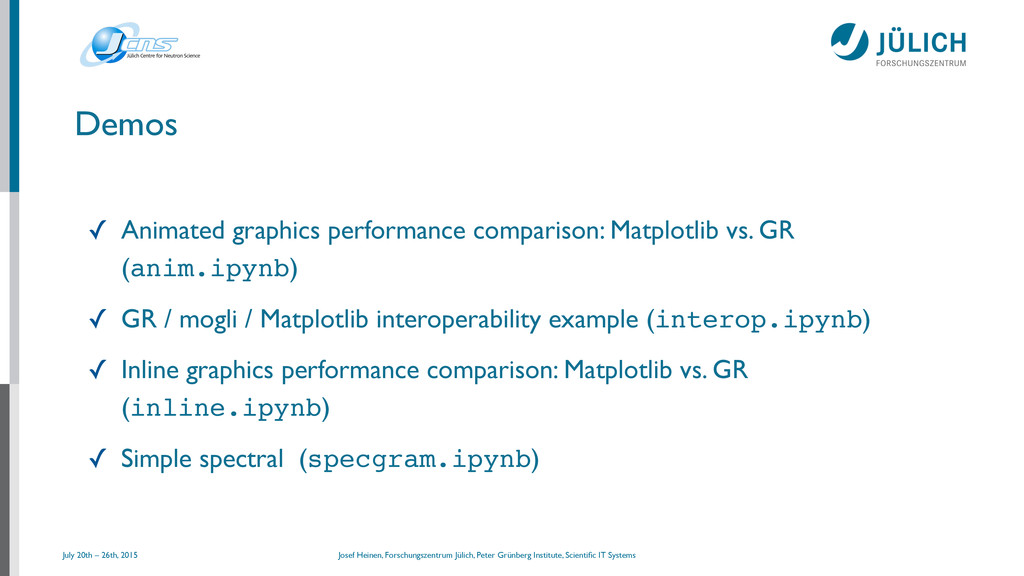
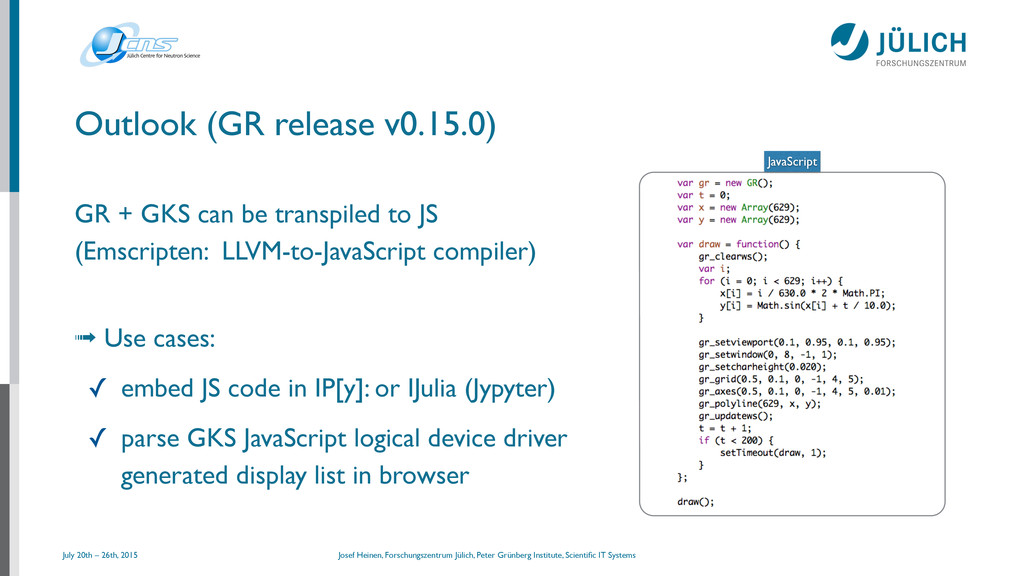
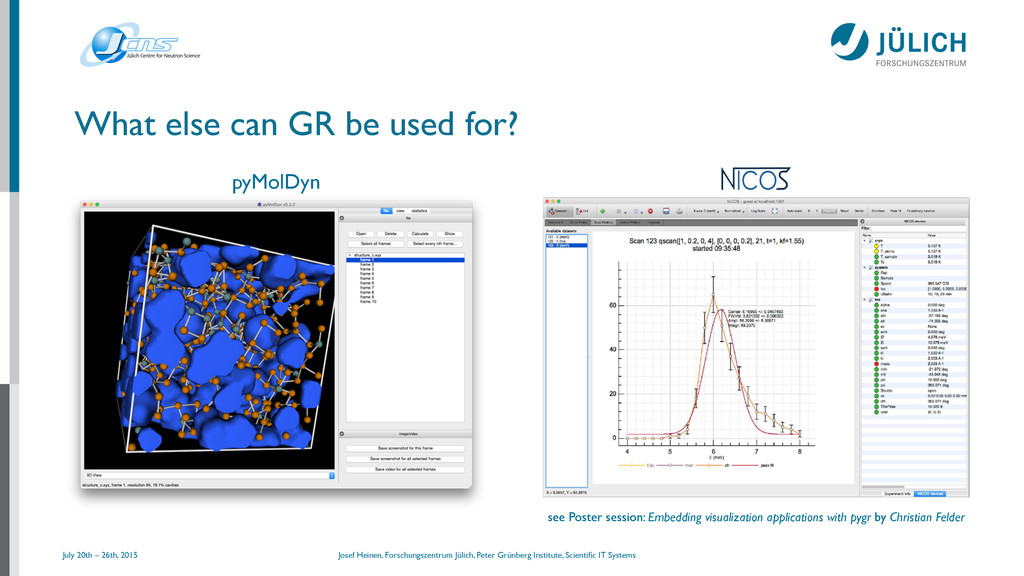
Using concrete examples, the presentation will demonstrate the benefits of the GR framework as a companion module for Matplotlib, both in Python and Julia. Based on selected applications, the suitability of the GR framework will be highlighted especially in environments where time is critical. The system’s performance capabilities will be illustrated using demanding live applications. In addition, the special abilities of the GR framework are emphasized in terms of interoperability with graphical user interfaces (Qt/PySide) and OpenGL, which opens up new possibilities for existing Matplotlib applications.

Josef Heinen

July 20, 2015
Tweet

More Decks by Josef Heinen

Other Decks in Science

Transcript

  1. Getting more out of Matplotlib with GR July 20th –

    26th, 2015 Bilbao | EuroPython 2015 | Josef Heinen | @josef_heinen Member of the Helmholtz Association
  2. July 20th – 26th, 2015 Josef Heinen, Forschungszentrum Jülich, Peter

    Grünberg Institute, Scientific IT Systems ✓ visualize and analyzing two- and three-dimensional data sets ✓ plot 2D data for real-time monitoring purposes (signal processing) ✓ visualize large data sets, probably with a dynamic component, preferably in real-time ✓ create publication-quality and web-ready graphics ✓ create animations or videos on the fly 2 Visualization needs
  3. July 20th – 26th, 2015 Josef Heinen, Forschungszentrum Jülich, Peter

    Grünberg Institute, Scientific IT Systems Python visualization solutions Matplotlib — de-facto standard (“workhorse”)
 ➟ Browser solutions: Bokeh, plot.ly Mayavi (mlab) — powerful, but overhead from VTK ggplot, chaco — statistical, 2D graphics VTK — versatile, but difficult to learn Vispy, Glumpy, OpenGL — fast, but low-level API 3 2D 3D Bokeh Plotly ggplot chaco
  4. July 20th – 26th, 2015 Josef Heinen, Forschungszentrum Jülich, Peter

    Grünberg Institute, Scientific IT Systems separated 2D and (hardware accelerated) 3D world some graphics backends "only" produce "figures"
 ➟ no presentation of continuous data streams speed up “only” by means of backend specific
 code ➟ poor performance on large data sets Problems so far — Crux of the matter 4 Quality Interop Speed
  5. July 20th – 26th, 2015 Josef Heinen, Forschungszentrum Jülich, Peter

    Grünberg Institute, Scientific IT Systems How can we improve the performance? ✓ Several Python modules can be compiled into native code, making them much faster (Cython) ✓ Compiling hotspots on the fly (Numba, PyPy) can significantly speed up numerical code segments ✓ Use hardware acceleration, but … … these approaches cannot easily be applied to visualization software!
 ➟ Could another backend speedup Matplotlib and improve interop ? 5 Where to go from here?
  6. July 20th – 26th, 2015 Josef Heinen, Forschungszentrum Jülich, Peter

    Grünberg Institute, Scientific IT Systems Use GR to achieve more graphics performance ✓ procedural graphics backend (completely written in C)
 ➟ presentation of continuous data streams ✓ builtin support for 2D plotting and OpenGL (GR3)
 ➟ coexistent 2D and 3D world ✓ interoperability with GUI toolkits and Web frameworks
 ➟ good user interaction 6
  7. July 20th – 26th, 2015 Josef Heinen, Forschungszentrum Jülich, Peter

    Grünberg Institute, Scientific IT Systems Use GR to extend Matplotlib’s capabilities ✓ combine the power of Matplotlib and GR
 ➟ next Matplotlib release will allow selecting the backend by setting the environment variable MPLBACKEND ✓ produce video contents on the fly by adding a single line of code
 ➟ no need to import an animation module or write extra code ✓ create plots containing both 2D and 3D graphics elements 7
  8. July 20th – 26th, 2015 Josef Heinen, Forschungszentrum Jülich, Peter

    Grünberg Institute, Scientific IT Systems How it works: GR layer architecture GKS logical device drivers C / C++ GKS GR OpenGL (WGL / CGL / GLX) POV-Ray
 generation off-screen rendering direct rendering Browser JavaScript
 generation WebGL IPython Win32 X11 GKSTerm gksqt LATEX Qt Quartz PDF C / ObjC OpenGL ES glgr / iGR App socket
 communication Qt / wx
 event loop 0MQ OpenGL More logical device drivers / plugins: – CGM, GKSM, GIF, RF, UIL – WMF, Xfig – GS (BMP, JPEG, PNG, TIFF) ... HTML5 wx POV-Ray GLUT GLFW wxGLCanvas QGLWidget ... SVG PS MOV GR3 Highlights: – simultaneous output to multiple output devices – direct generation of MPEG4 image sequences – flicker-free display ("double buffering”) – IPython / Jupyter notebook integration TikZ Swift PyPy Generate ray-traced graphics scenes Notebooks support for Python or Julia kernels Use GR as a Matplotlib backend;
 mix GR, MPL and GR3 code Create HTML5 output Qt console interaction Create video animations on the fly
  9. July 20th – 26th, 2015 Josef Heinen, Forschungszentrum Jülich, Peter

    Grünberg Institute, Scientific IT Systems Matplotlib using the GR backend 9 Circle Rectangle Wedge Polygon Ellipse Arrow PathPatch FancyBoxPatch Line2D ! % # % & ( * $# + ! % # % & ( * $# $% $& $( - #"# %"' '"# )"' $#"# $%"' $'"# $)"' %#"# %%"' + , ' %! $! #! "! ! "! #! $! %! ( %! $! #! "! ! "! #! $! %! ) "!! &! ! &! "!! # '$% # &$* # &$% # %$* %$% %$* &$% &$* '$% # '$% # &$* # &$% # %$* %$% %$* &$% &$* '$% 051..-7- 7/67 !'%% 431276" # %$(+ # %$') # %$&' %$%% %$&' %$') %$(+ %$), $"# $"( %"# %"( &"# &"( '"# '"( ("# $"# $"( %"# %"( &"# &"( '"# '"( ("# 4+30351,6. :/7. 0,9,06 ! #"* ! #") ! #"& #"# #"& #") #"* $"% $"( %"# %"( &"# &"( '"# '"( $"( %"# %"( &"# &"( '"# '"( +327385- :/7. 0,9,06 ! #"* ! #") ! #"& #"# #"& #") #"* $"% 0° 45° 90° 135° 180° 225° 270° 315° 2 4 6 8 10 ( & $ " $ & ( ( & $ " $ & ( #!"# "!)+ "!'( "!%& "!## "!## "!%& "!'( "!)+ #!"# "!* "!( "!& "!$ "!" "!$ "!& "!( "!* # &$% # %$' %$% %$' &$% # &$% # %$' %$% %$' &$% )/07,5/2- * (,0*82*9 1,6. !*440/+*7/32 73 ./-.# 5,63087/32 75/+327385/2-" #!" "!& "!" "!& #!" #!" "!& "!" "!& #!" "!' "!% "!$ "!" "!$ "!% "!'
  10. July 20th – 26th, 2015 Josef Heinen, Forschungszentrum Jülich, Peter

    Grünberg Institute, Scientific IT Systems GR in action … 10
  11. July 20th – 26th, 2015 Josef Heinen, Forschungszentrum Jülich, Peter

    Grünberg Institute, Scientific IT Systems GR / Jupyter Performance (anim.py) 0 100 200 300 400 500 600 700 MPL MPL+GR GR fps click images to view notebooks …
  12. July 20th – 26th, 2015 Josef Heinen, Forschungszentrum Jülich, Peter

    Grünberg Institute, Scientific IT Systems Performance analysis 0 100 200 300 400 500 600 700 MPL MPL+GR GR fps ncalls cumtime filename:lineno(function) 398 6.852 {method'draw'of'_macosx.FigureCanvas'objects} 29378/397 6.771 artist.py:57(draw_wrapper) 397 6.769 figure.py:1004(draw) 397 6.574 _base.py:1989(draw) 794 5.894 axis.py:1106(draw) 5161 4.601 axis.py:232(draw) 199 3.616 pyplot.py:175(pause) 10719 3.609 lines.py:661(draw) 199 3.480 pyplot.py:551(draw) 7940 1.044 text.py:581(draw) ncalls cumtime filename:lineno(function) 199 4.412 pyplot.py:551(draw) 199 4.410 backend_gr.py:227(draw) 14726/199 4.237 artist.py:57(draw_wrapper) 199 4.236 figure.py:1004(draw) 199 4.138 _base.py:1989(draw) 398 3.770 axis.py:1106(draw) 2587 3.073 axis.py:232(draw) 5373 2.642 lines.py:661(draw) 5174 1.202 backend_bases.py:237(draw_markers) ncalls cumtime filename:lineno(function) 199 3.263 __init__.py:1910(plot) 199 3.184 __init__.py:250(updatews) MPL MPL + GR GR most time spent in backend wrapper ??? No room for further optimizations on the backend side
  13. July 20th – 26th, 2015 Josef Heinen, Forschungszentrum Jülich, Peter

    Grünberg Institute, Scientific IT Systems GR + GR3 + Matplotlib interop 13 Matplotlib GR3 GR Important: tells MPL backend not to update
  14. July 20th – 26th, 2015 Josef Heinen, Forschungszentrum Jülich, Peter

    Grünberg Institute, Scientific IT Systems Inline graphics Matplotlib GR ~ 10 times faster
  15. July 20th – 26th, 2015 Josef Heinen, Forschungszentrum Jülich, Peter

    Grünberg Institute, Scientific IT Systems Demos ✓ Animated graphics performance comparison: Matplotlib vs. GR (anim.ipynb) ✓ GR / mogli / Matplotlib interoperability example (interop.ipynb) ✓ Inline graphics performance comparison: Matplotlib vs. GR (inline.ipynb) ✓ Simple spectral (specgram.ipynb)
  16. July 20th – 26th, 2015 Josef Heinen, Forschungszentrum Jülich, Peter

    Grünberg Institute, Scientific IT Systems GR + GKS can be transpiled to JS
 (Emscripten: LLVM-to-JavaScript compiler) 
 ➟ Use cases: ✓ embed JS code in IP[y]: or IJulia (Jypyter) ✓ parse GKS JavaScript logical device driver
 generated display list in browser Outlook (GR release v0.15.0) JavaScript
  17. July 20th – 26th, 2015 Josef Heinen, Forschungszentrum Jülich, Peter

    Grünberg Institute, Scientific IT Systems What else can GR be used for? pyMolDyn see Poster session: Embedding visualization applications with pygr by Christian Felder
  18. July 20th – 26th, 2015 Josef Heinen, Forschungszentrum Jülich, Peter

    Grünberg Institute, Scientific IT Systems Conclusions ✓ Using the GR Matplotlib backend has not turned out satisfactory as the speedups were not as expected ✓ GR adds more plotting capabilities to Matplotlib allowing to mix 2D drawings and 3D graphics scenes or create movies on the fly ✓ Producing plots / figures is much faster with the GR framework (speedup for plots > 20, > 100 respectively) 18
  19. July 20th – 26th, 2015 Josef Heinen, Forschungszentrum Jülich, Peter

    Grünberg Institute, Scientific IT Systems What happens next? ✓ integrate JavaScript GKS logical device driver ✓ provide more convenience function ✓ migrate the GR3 library to modern OpenGL (using OpenGL shader language)
 ➟ visualize millions of vertices / faces ✓ simplify the installation 19
  20. July 20th – 26th, 2015 Josef Heinen, Forschungszentrum Jülich, Peter

    Grünberg Institute, Scientific IT Systems Resources ✓ Website: http://gr-framework.org ✓ GR framework: https://github.com/jheinen/gr ✓ PyPI: https://pypi.python.org/pypi/gr ✓ Talk material: Getting more out of Matplotlib with GR 20
  21. July 20th – 26th, 2015 Josef Heinen, Forschungszentrum Jülich, Peter

    Grünberg Institute, Scientific IT Systems Thank you for your attention Questions? Contact: [email protected]
 @josef_heinen Thanks to: Fabian Beule, Steffen Drossard, Christian Felder, Marvin Goblet, Ingo Heimbach, Daniel Kaiser, Philip Klinkhammer, David Knodt, Florian Rhiem, Jörg Winkler et al. 21