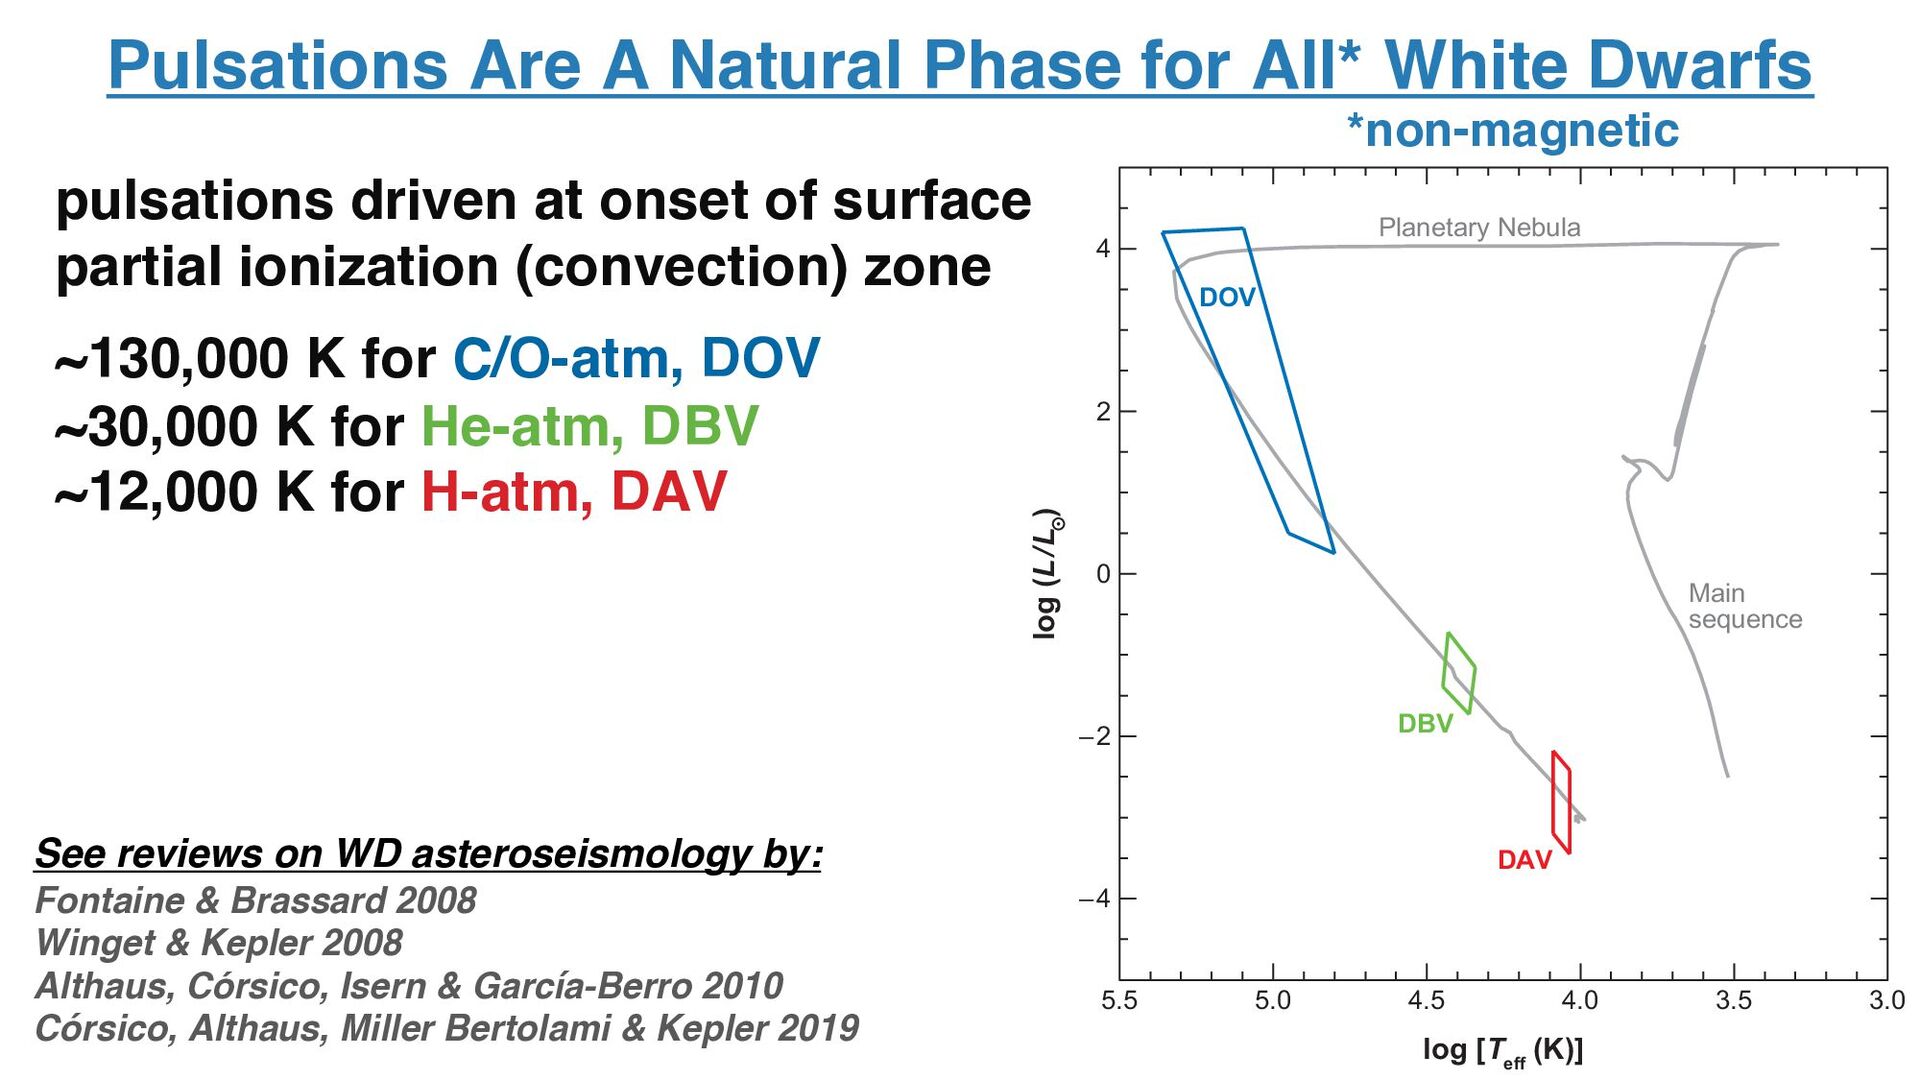
in the H-R diagram, in Figure 3. The pulsating pre-white dwarf PG 1159 stars, the DOVs, around 7 170,000 K have the highest number of detected modes. The first class of pulsating 5.5 5.0 4.5 Planetary Nebula Main sequence DOV DBV DAV 4.0 3.5 3.0 log [T eff (K)] 4 2 0 –2 –4 log (L/L ) Annu. Rev. Astro. Astrophys. 2008.46:157-199. Downloade by University of Texas - Austin on 01/28/09. Pulsations Are A Natural Phase for All* White Dwarfs pulsations driven at onset of surface partial ionization (convection) zone ~130,000 K for C/O-atm, DOV ~30,000 K for He-atm, DBV ~12,000 K for H-atm, DAV *non-magnetic See reviews on WD asteroseismology by: Fontaine & Brassard 2008 Winget & Kepler 2008 Althaus, Córsico, Isern & García-Berro 2010 Córsico, Althaus, Miller Bertolami & Kepler 2019
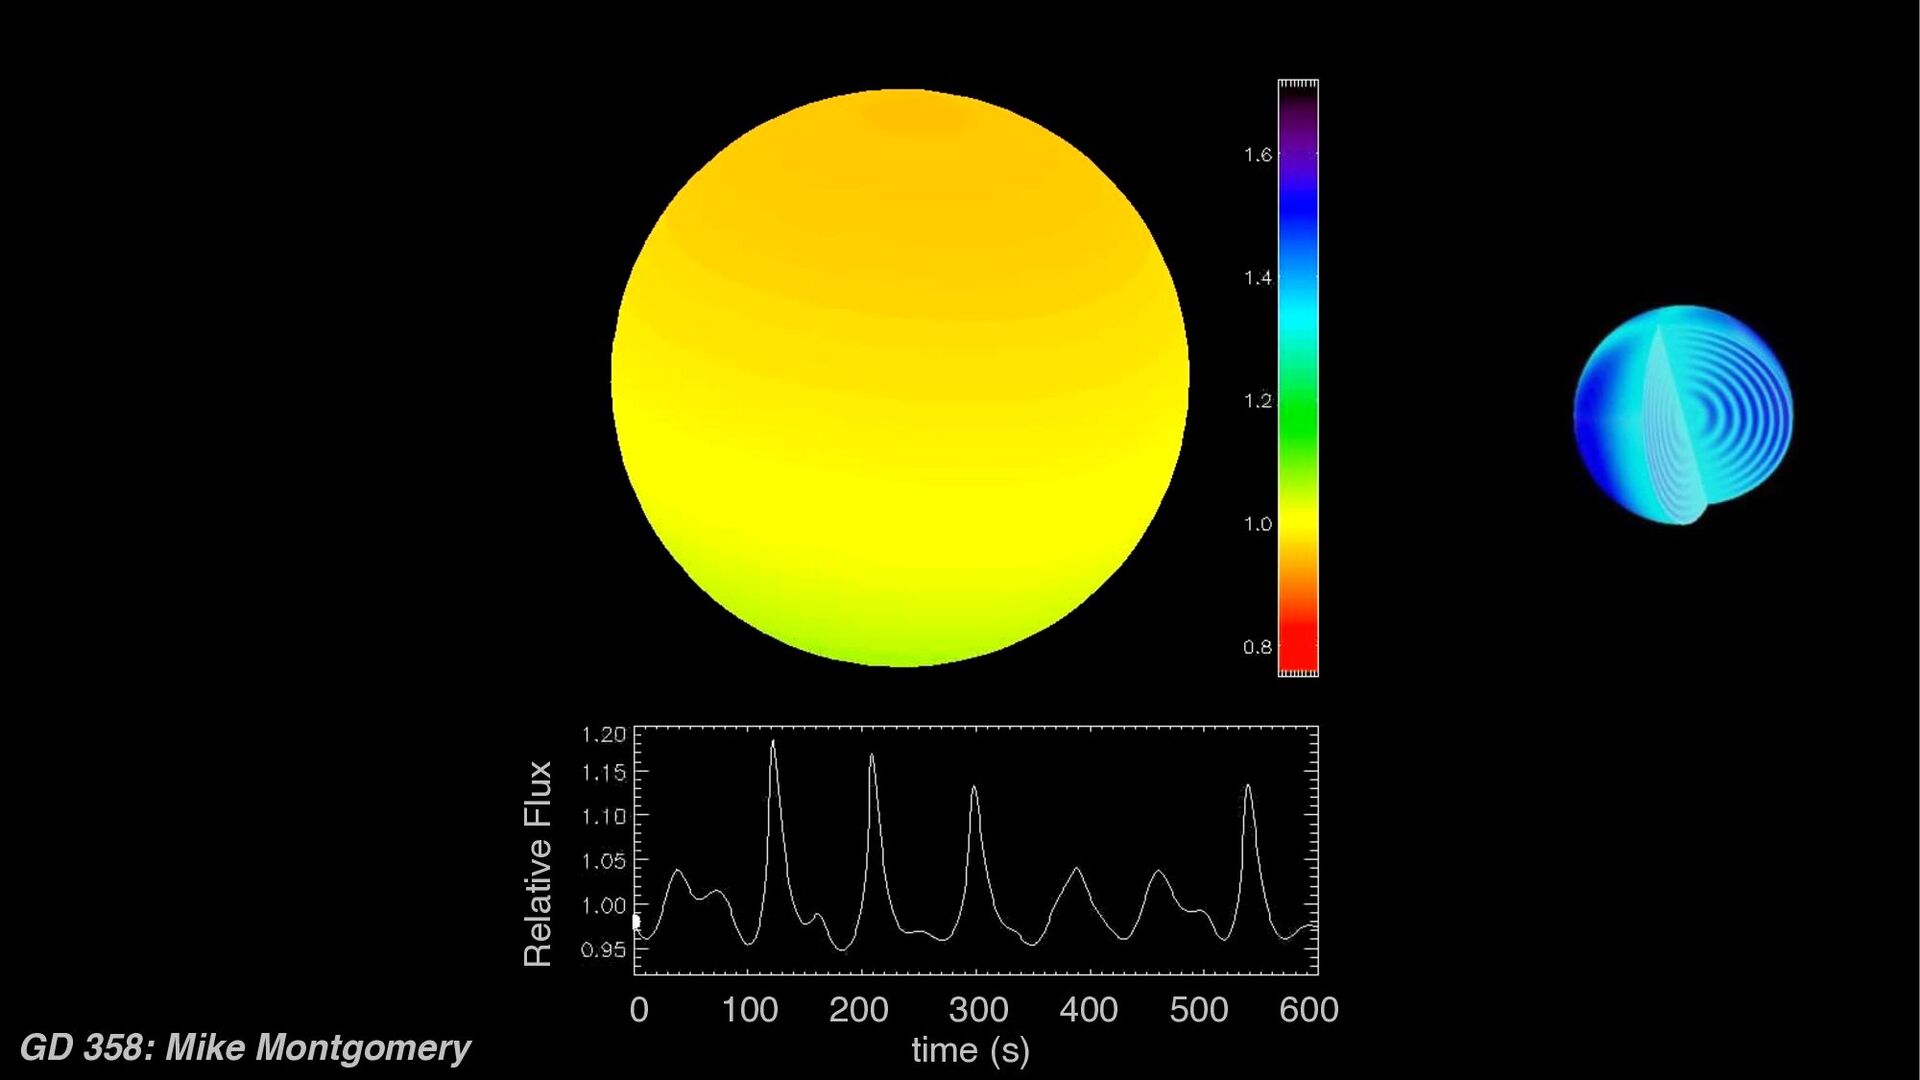
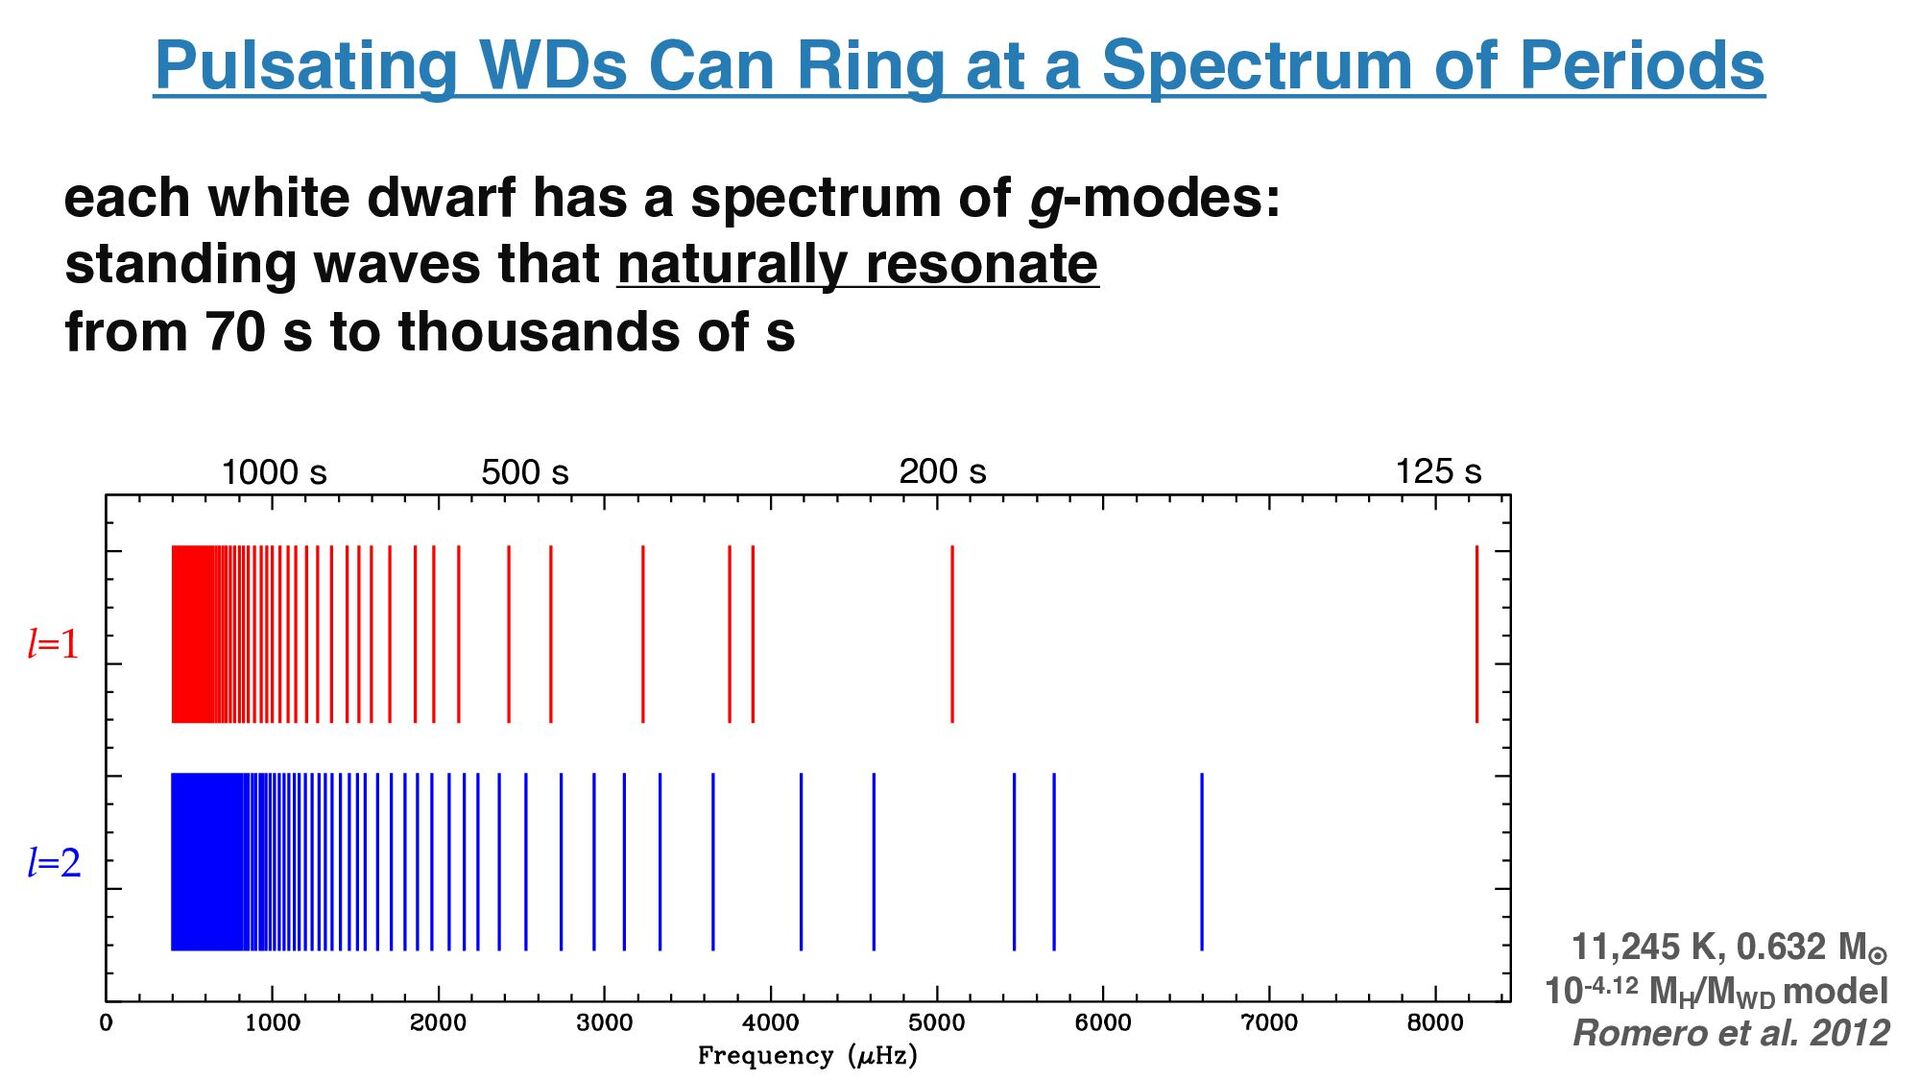
that naturally resonate from 70 s to thousands of s l=1 l=2 Pulsating WDs Can Ring at a Spectrum of Periods 1000 s 200 s 500 s 125 s 11,245 K, 0.632 M¤ 10-4.12 MH /MWD model Romero et al. 2012
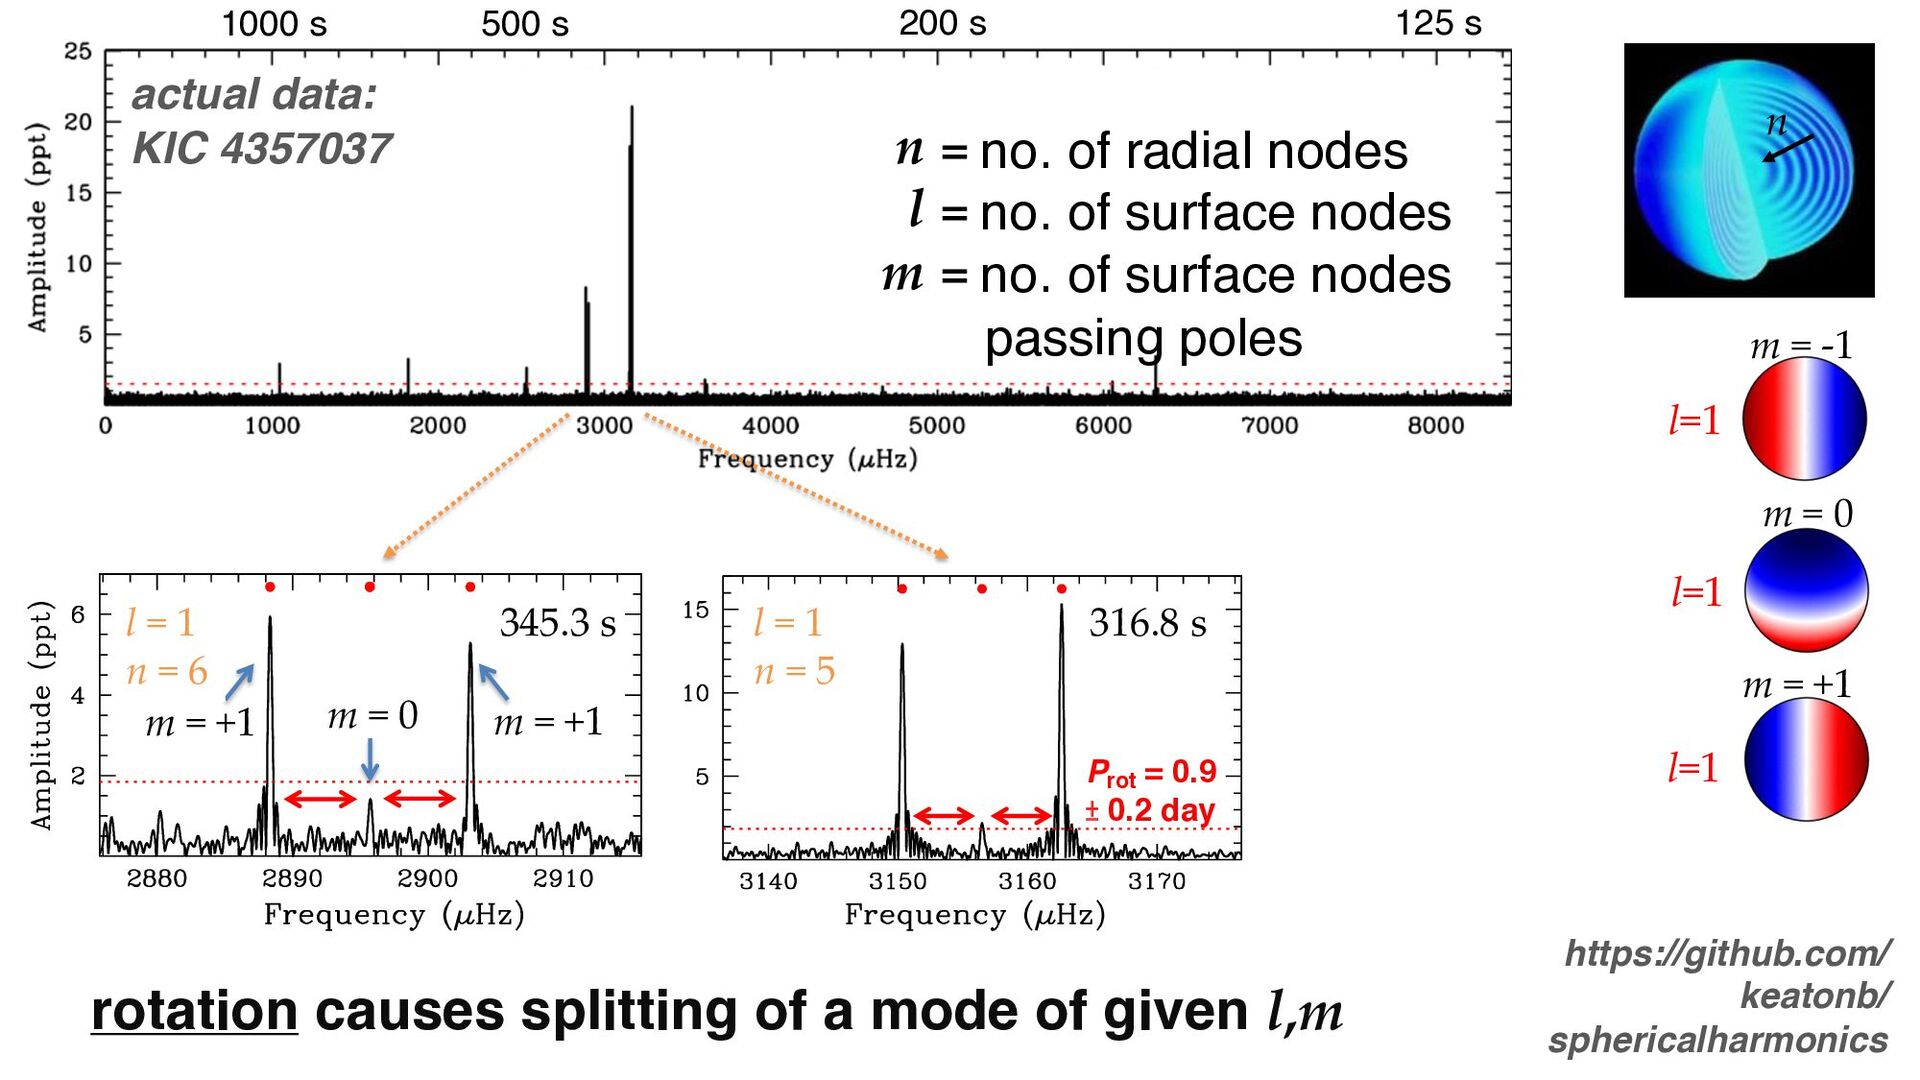
l=1 n m = +1 m = +1 m = 0 345.3 s l = 1 n = 6 Prot = 0.9 ± 0.2 day l = 1 n = 5 316.8 s m = +1 m = 0 m = -1 = no. of radial nodes = no. of surface nodes = no. of surface nodes passing poles n l m actual data: KIC 4357037 rotation causes splitting of a mode of given l,m https://github.com/ keatonb/ sphericalharmonics
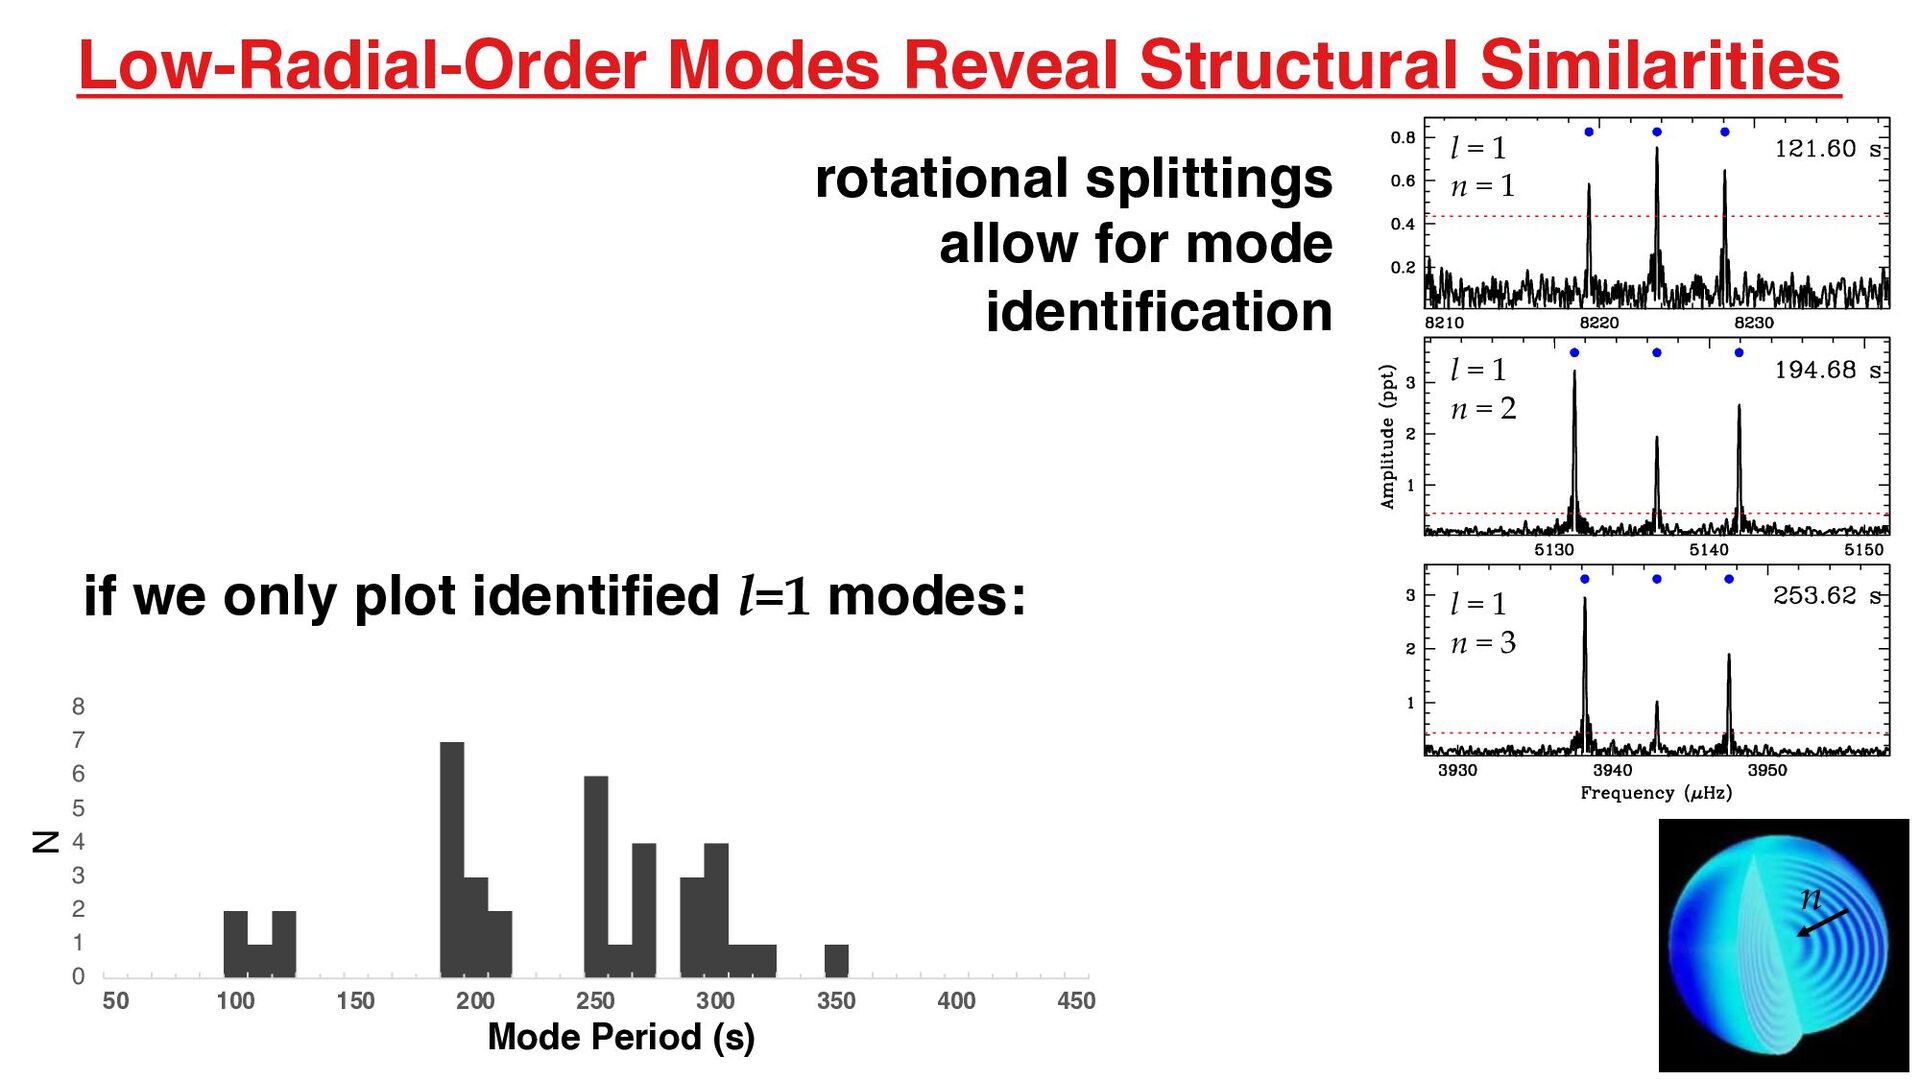
1 l = 1 n = 2 l = 1 n = 3 rotational splittings allow for mode identification if we only plot identified l=1 modes: 0 1 2 3 4 5 6 7 8 50 100 150 200 250 300 350 400 450 Mode Period (s) N n
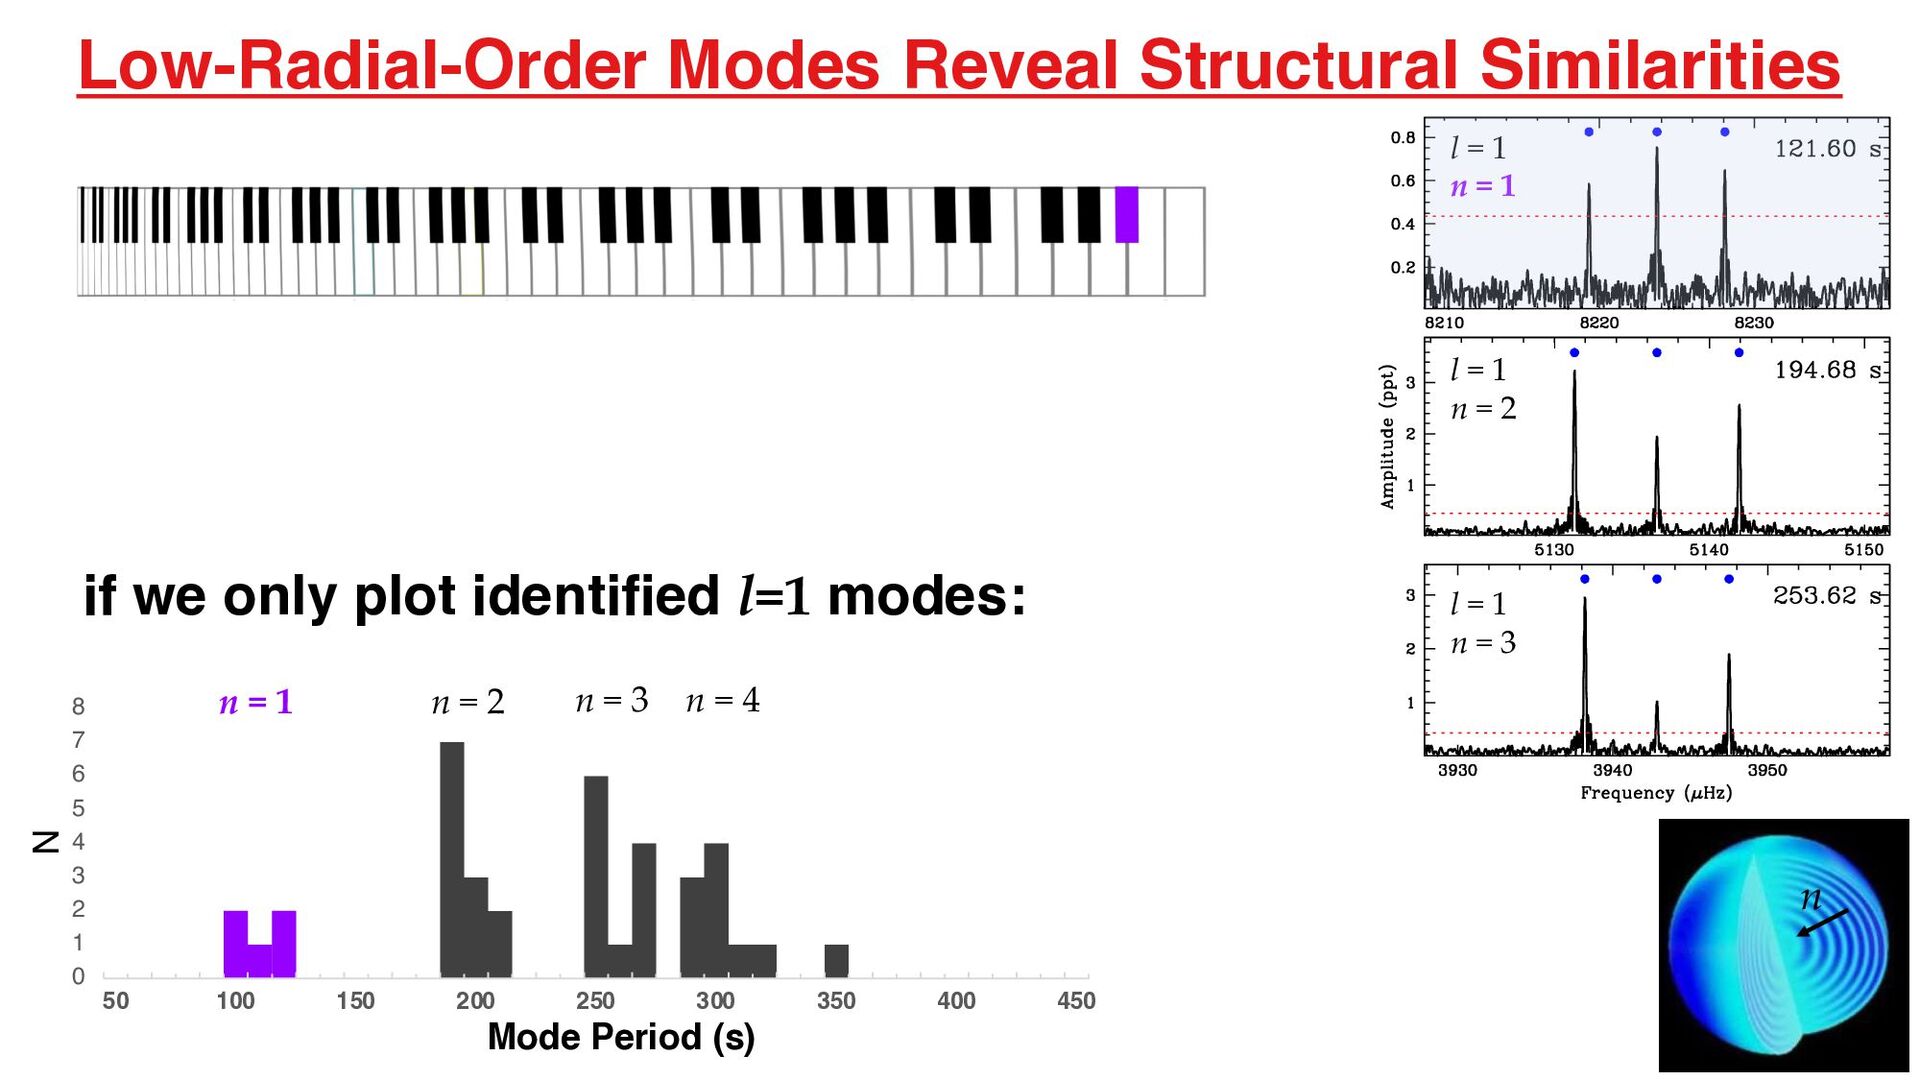
2 l = 1 n = 3 if we only plot identified l=1 modes: 0 1 2 3 4 5 6 7 8 50 100 150 200 250 300 350 400 450 Mode Period (s) N n = 1 n = 2 n = 3 n = 4 n l = 1 n = 1
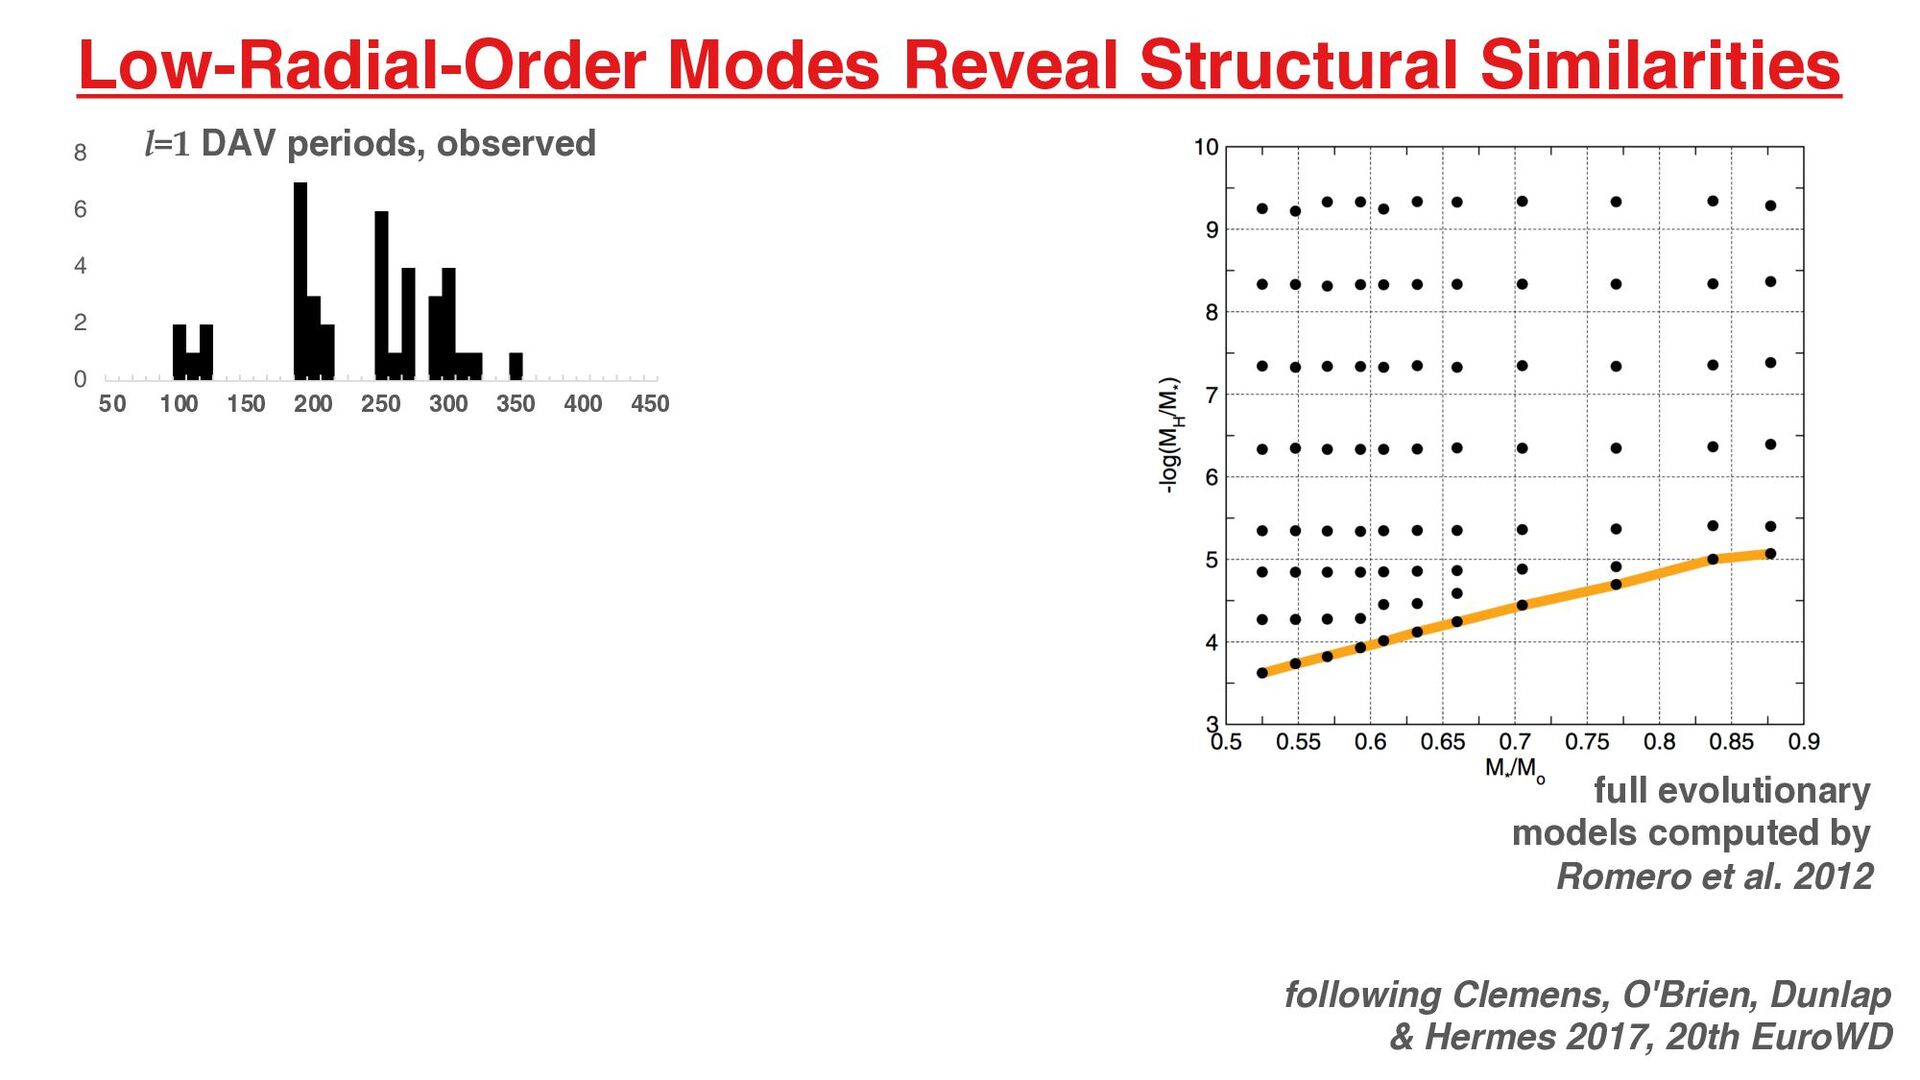
Hermes 2017, 20th EuroWD if we only plot identified l=1 modes: 0 1 2 3 4 5 6 7 8 50 100 150 200 250 300 350 400 450 Mode Period (s) N n = 1 n = 2 n = 3 n = 4 l = 1 n = 2 l = 1 n = 3 l = 1 n = 1
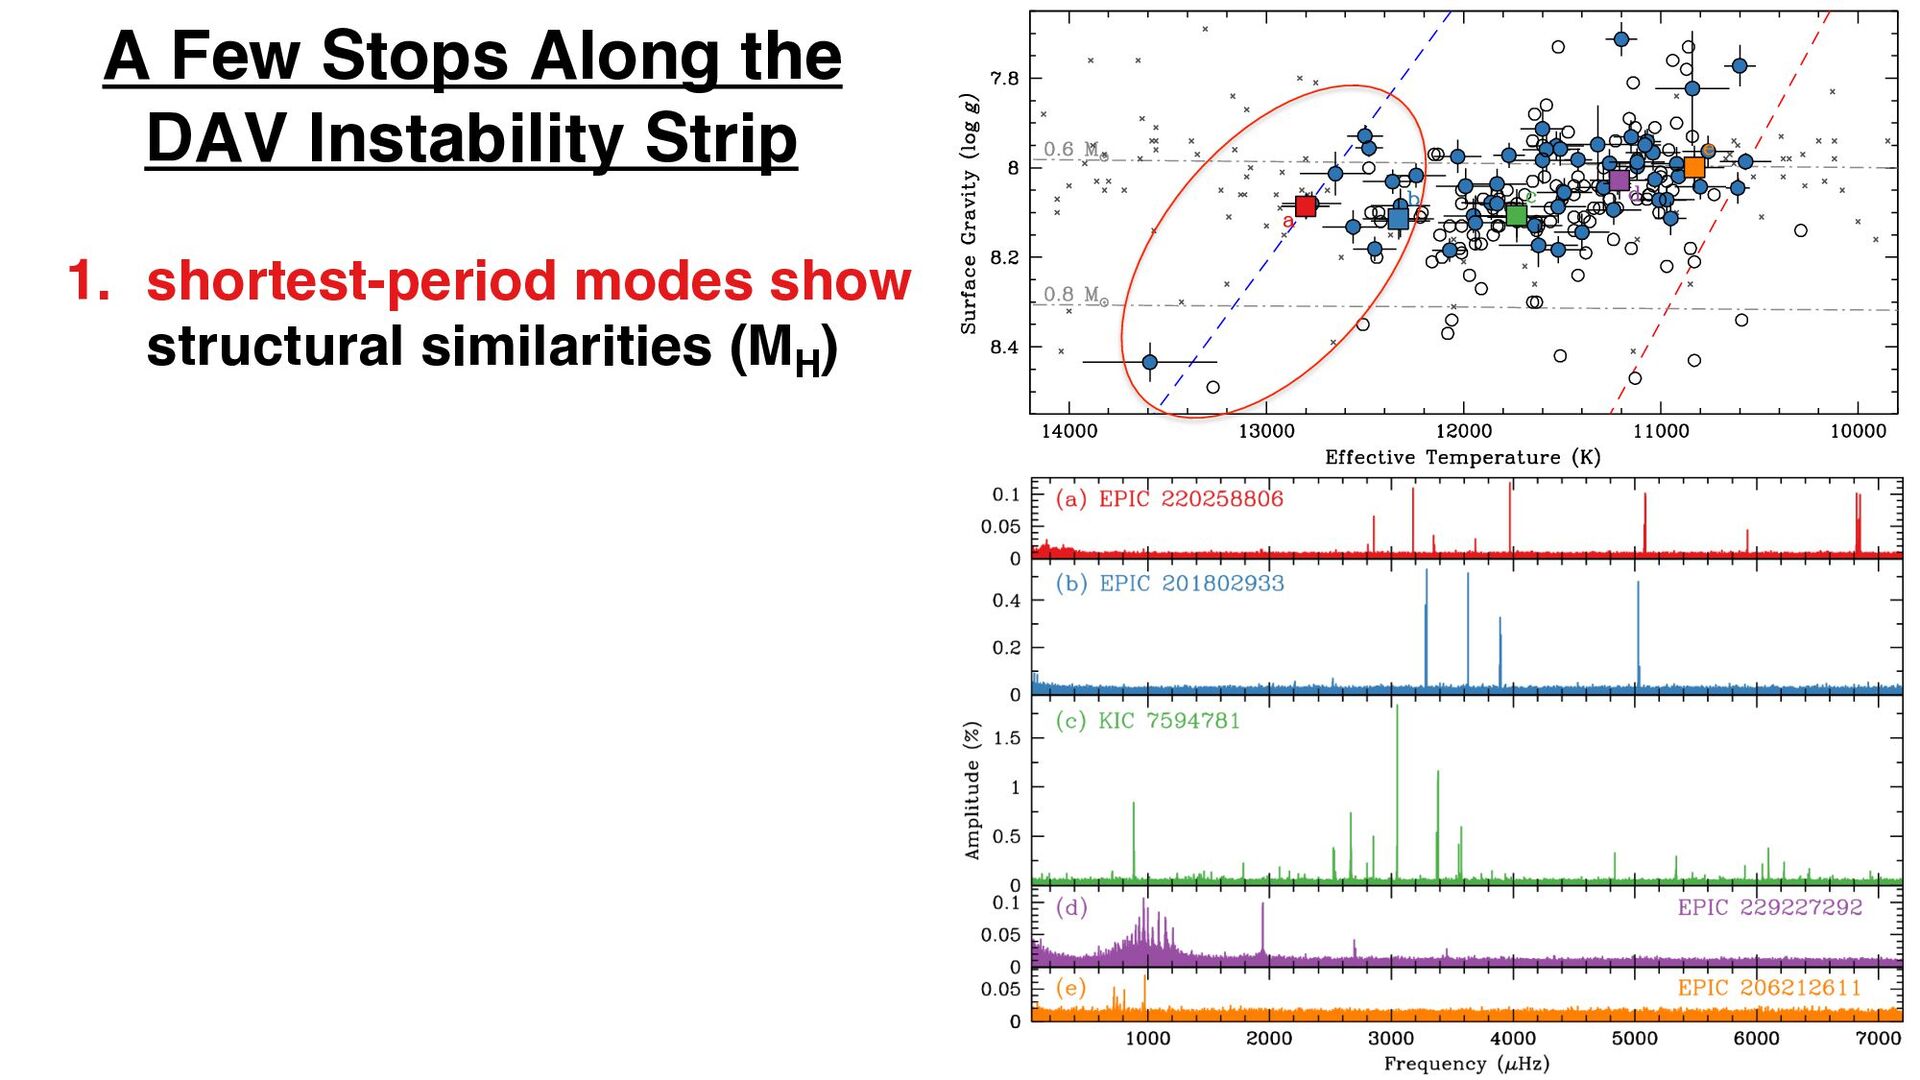
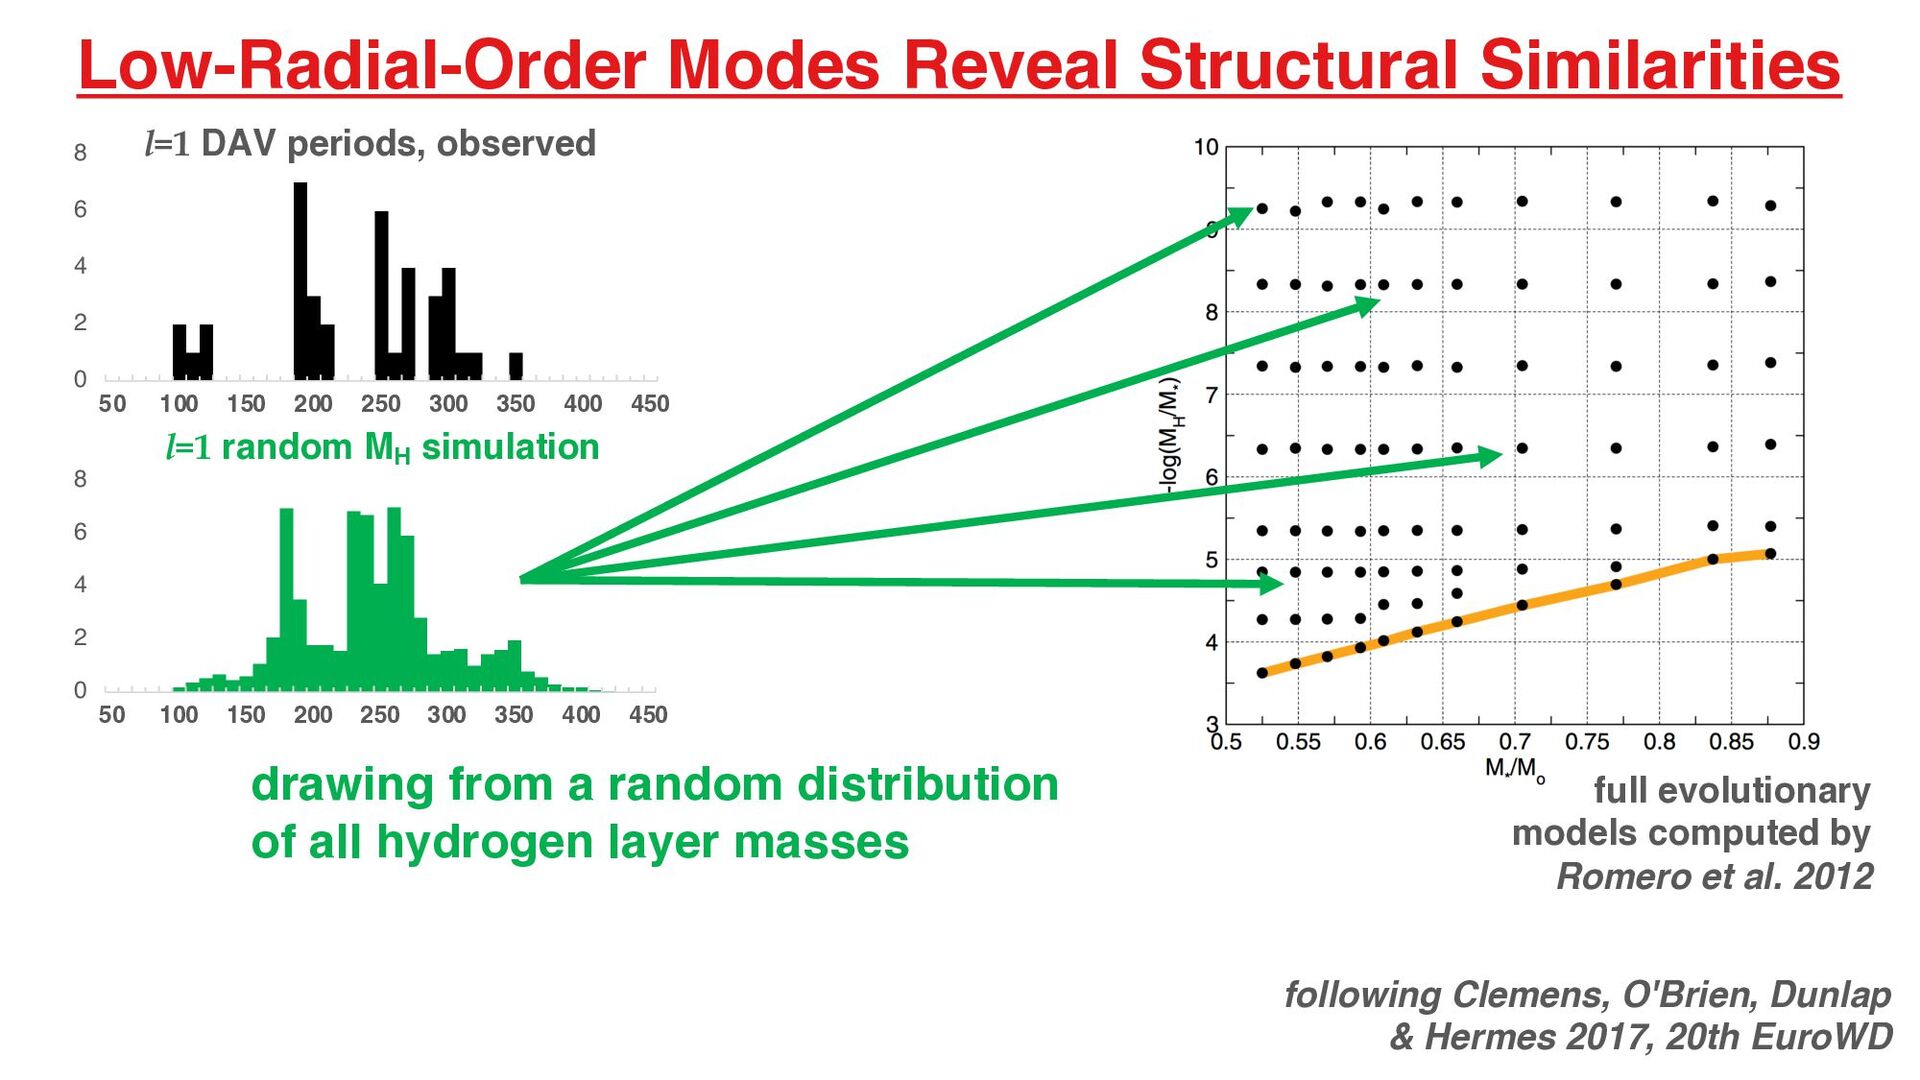
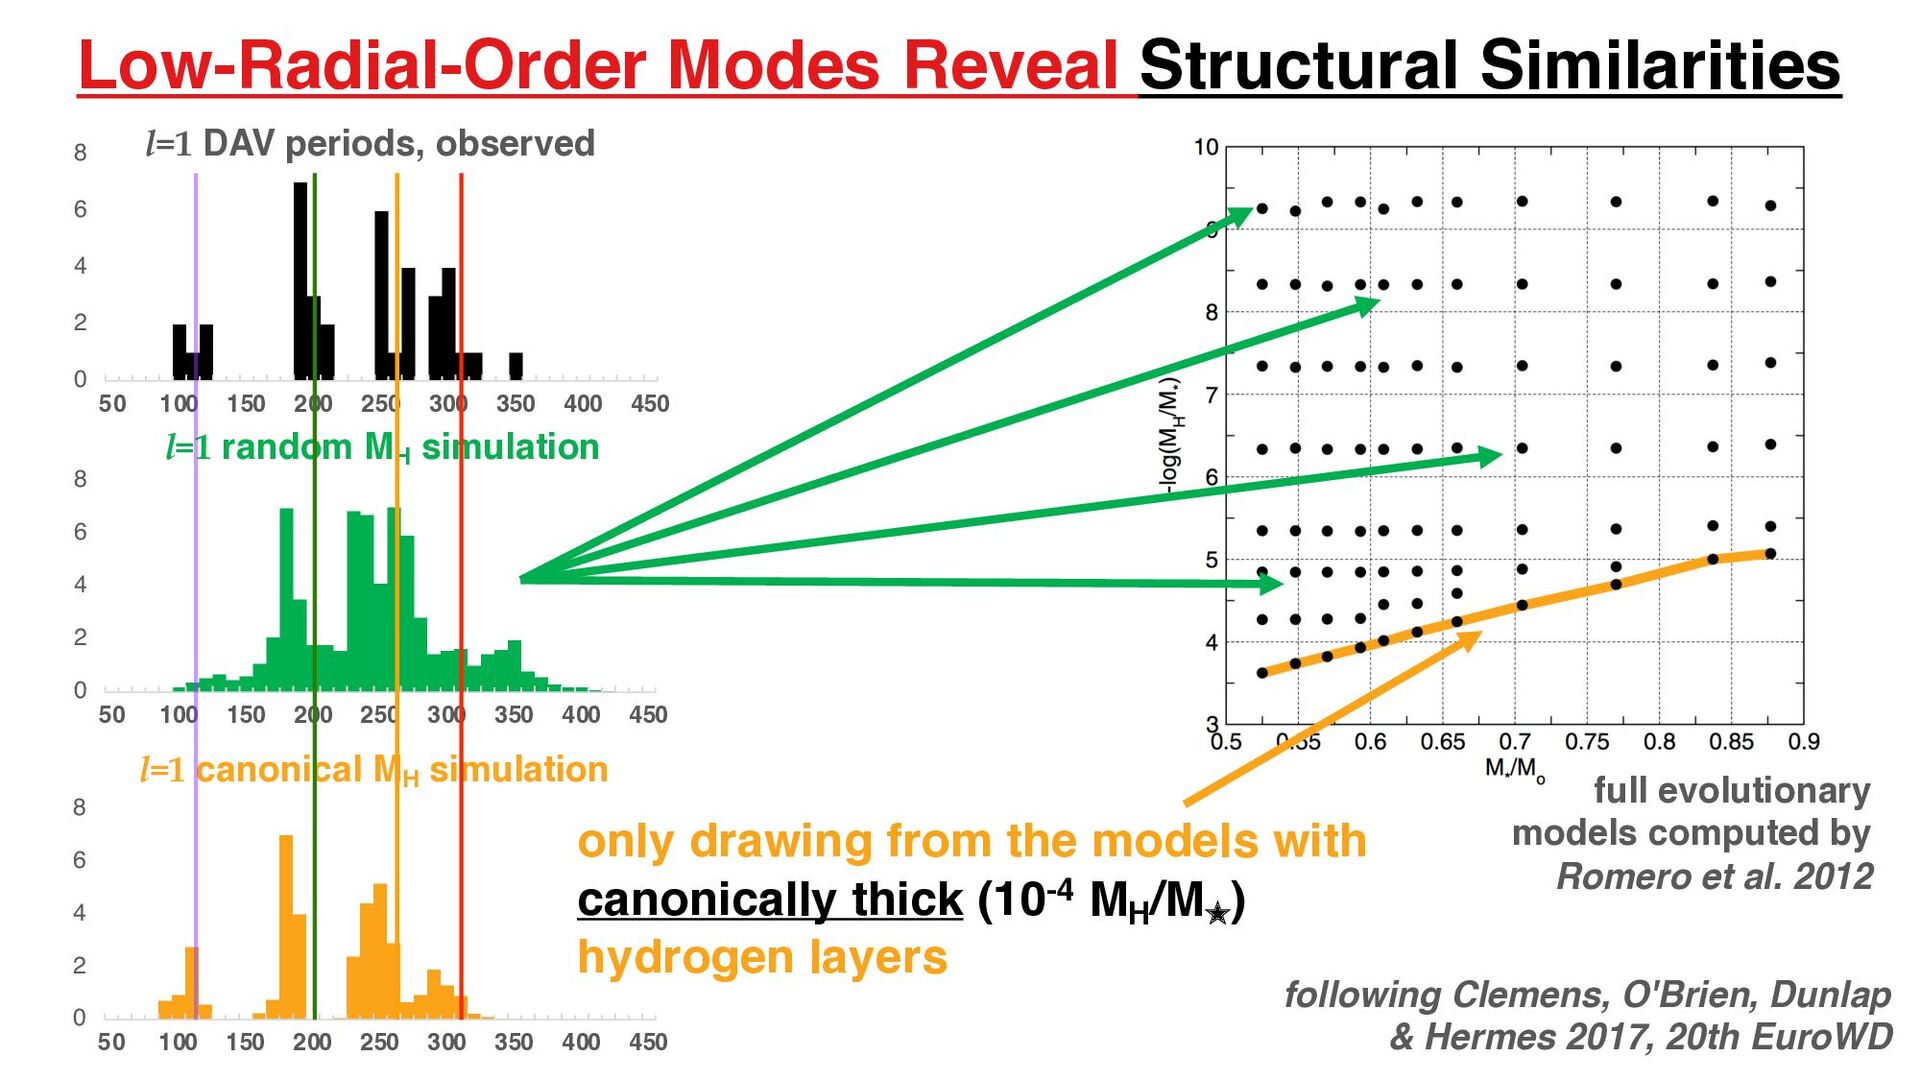
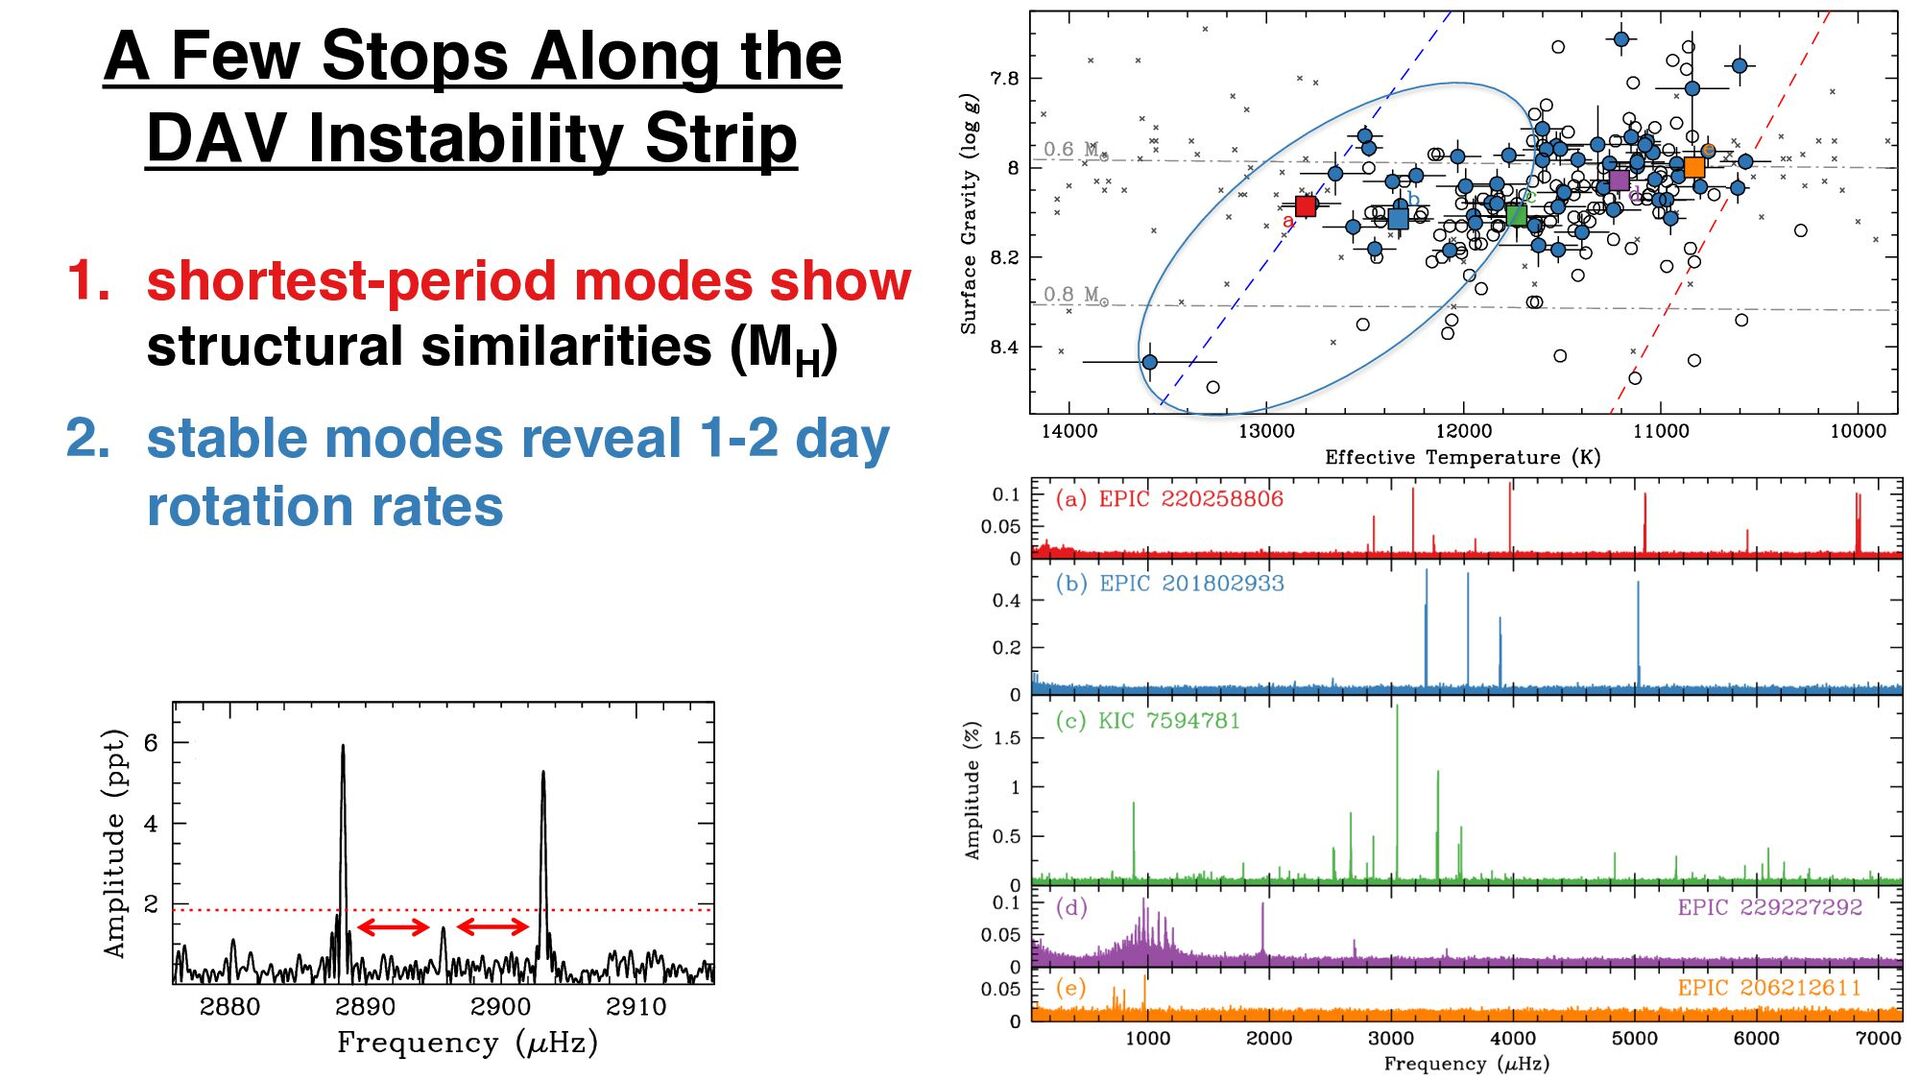
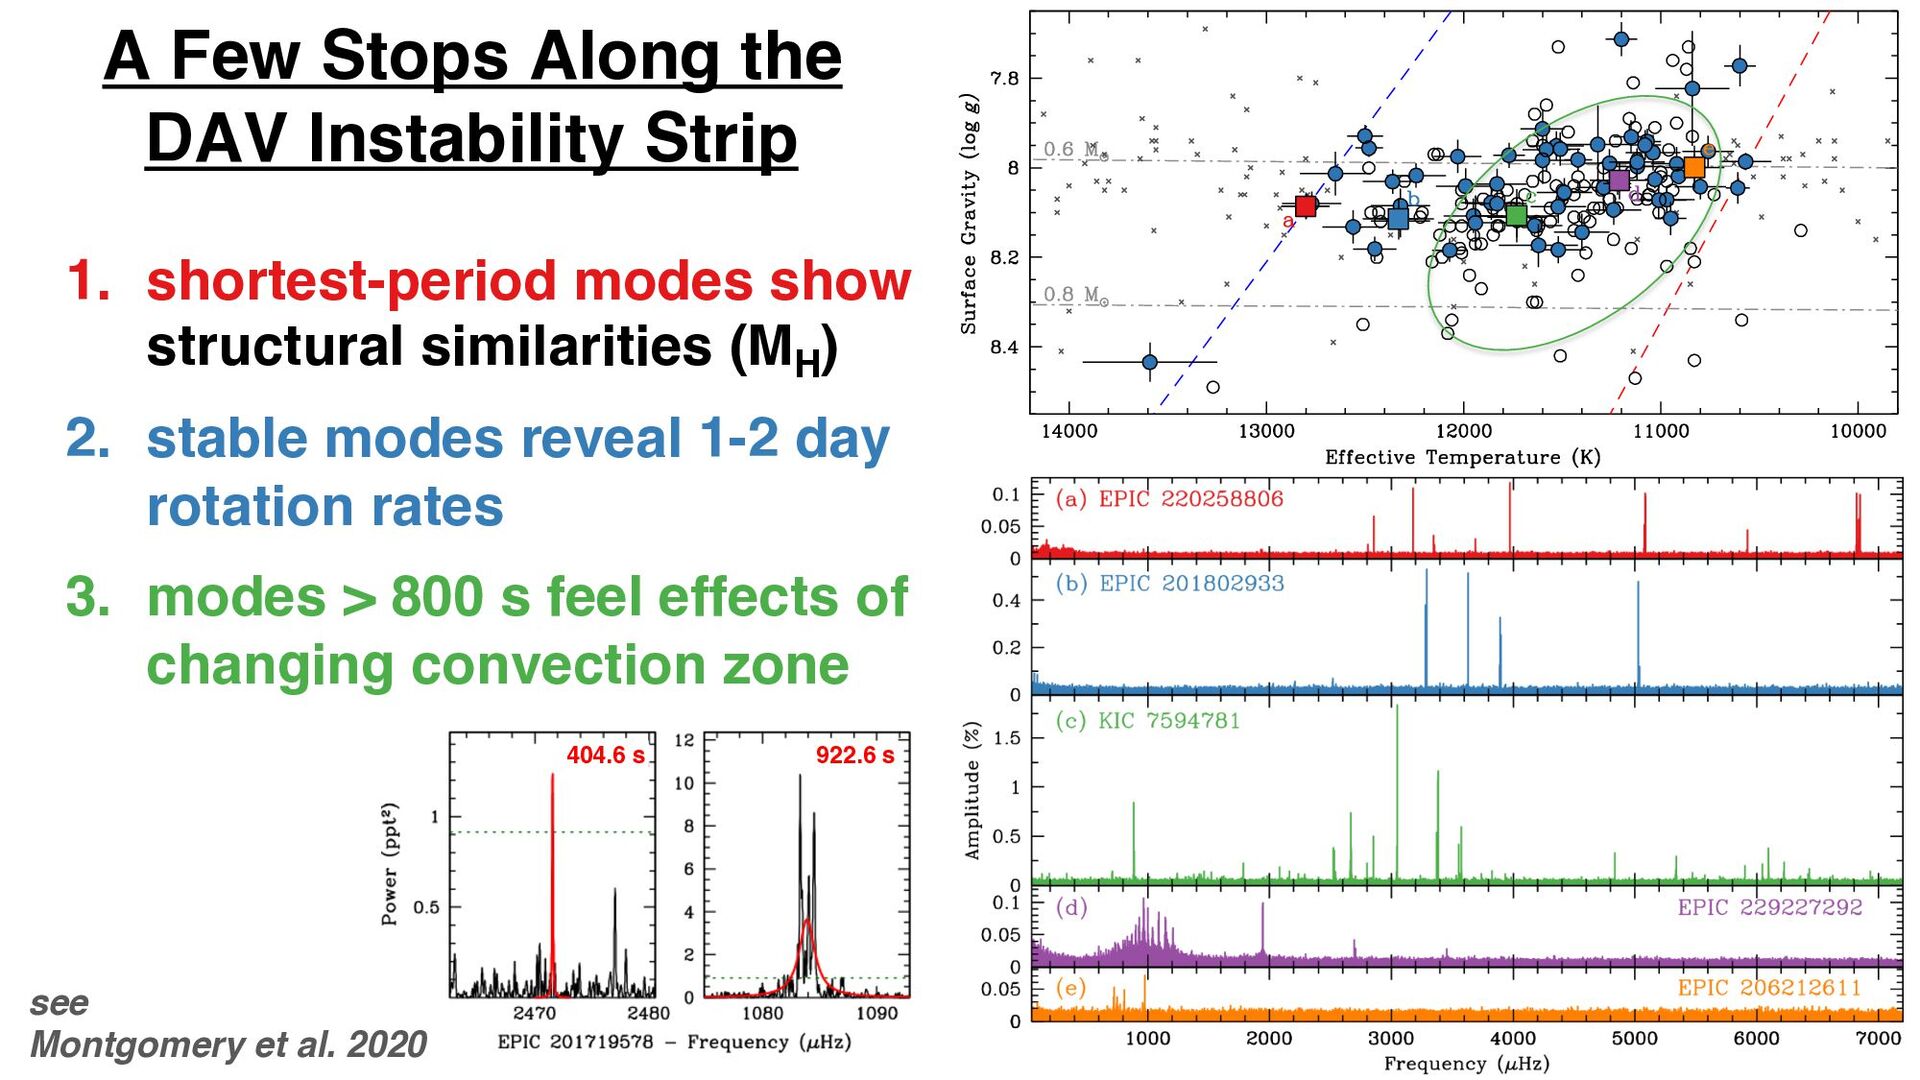
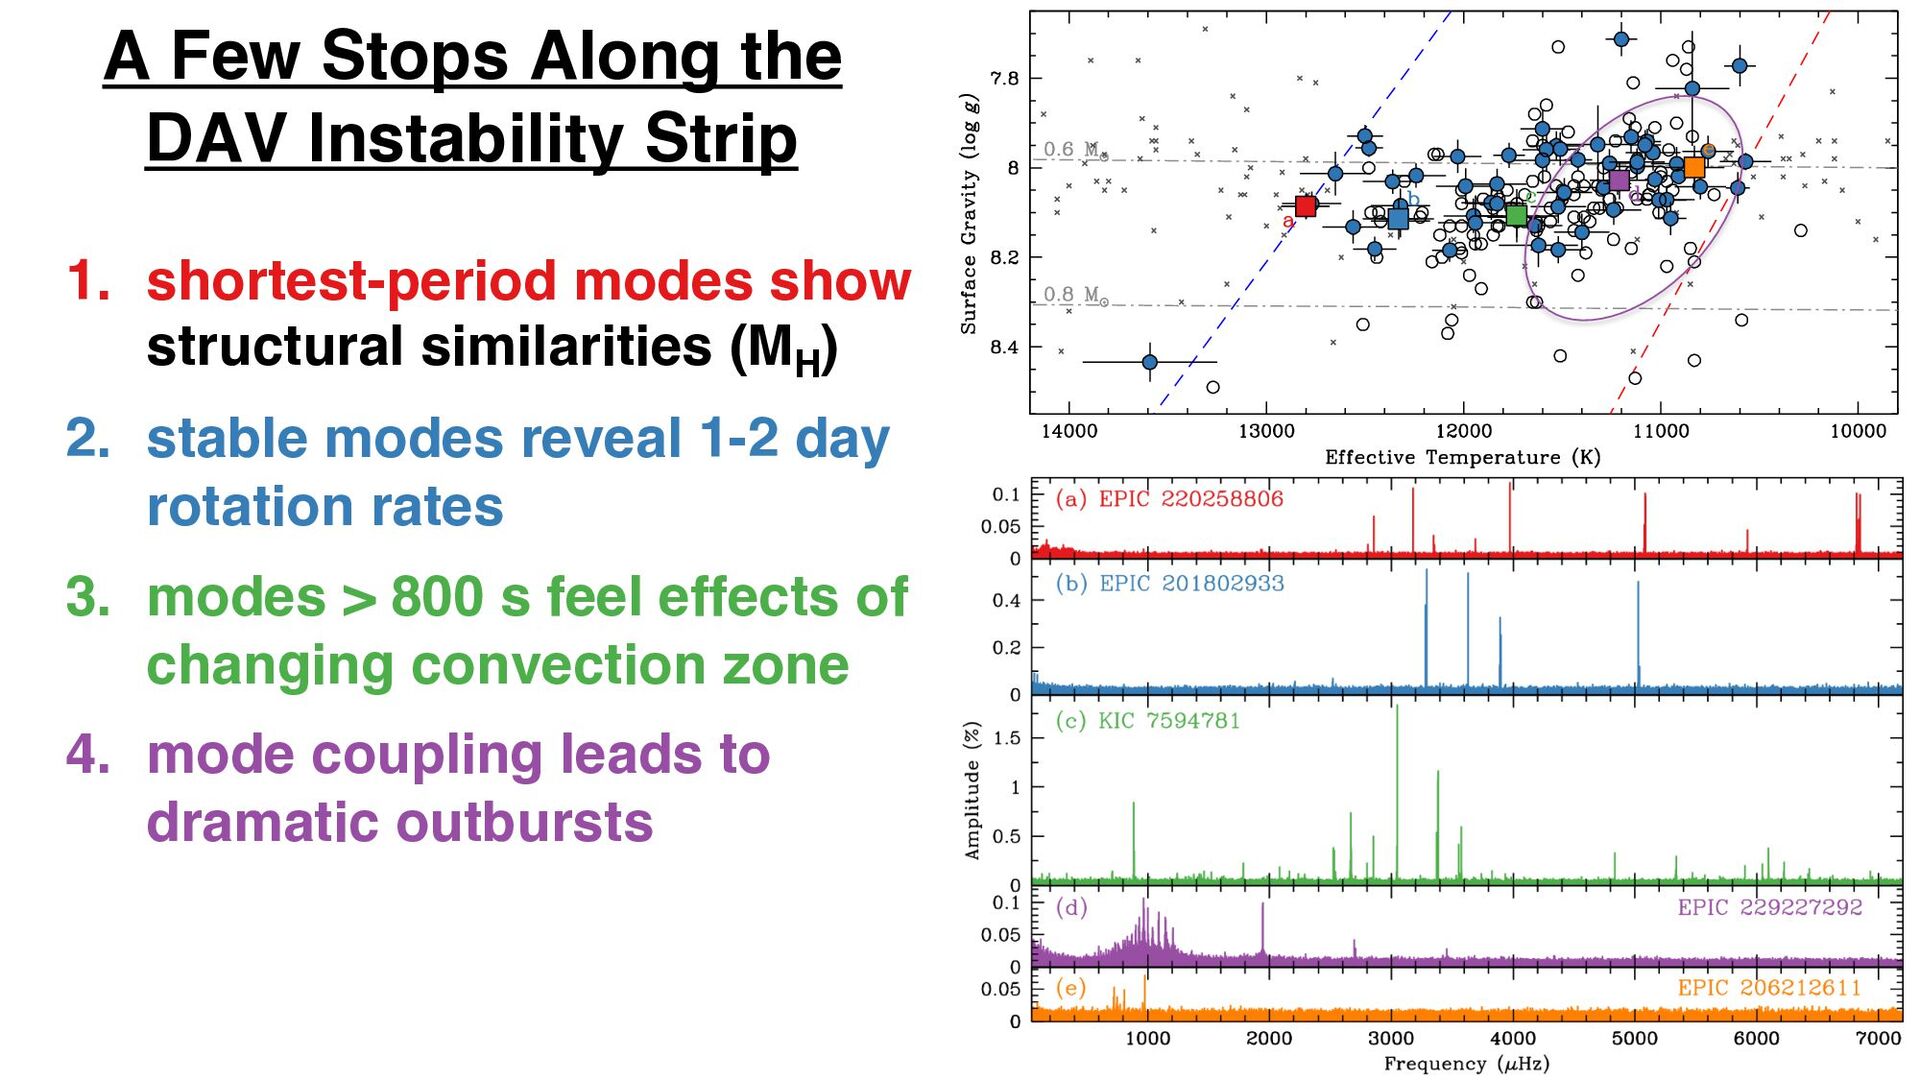
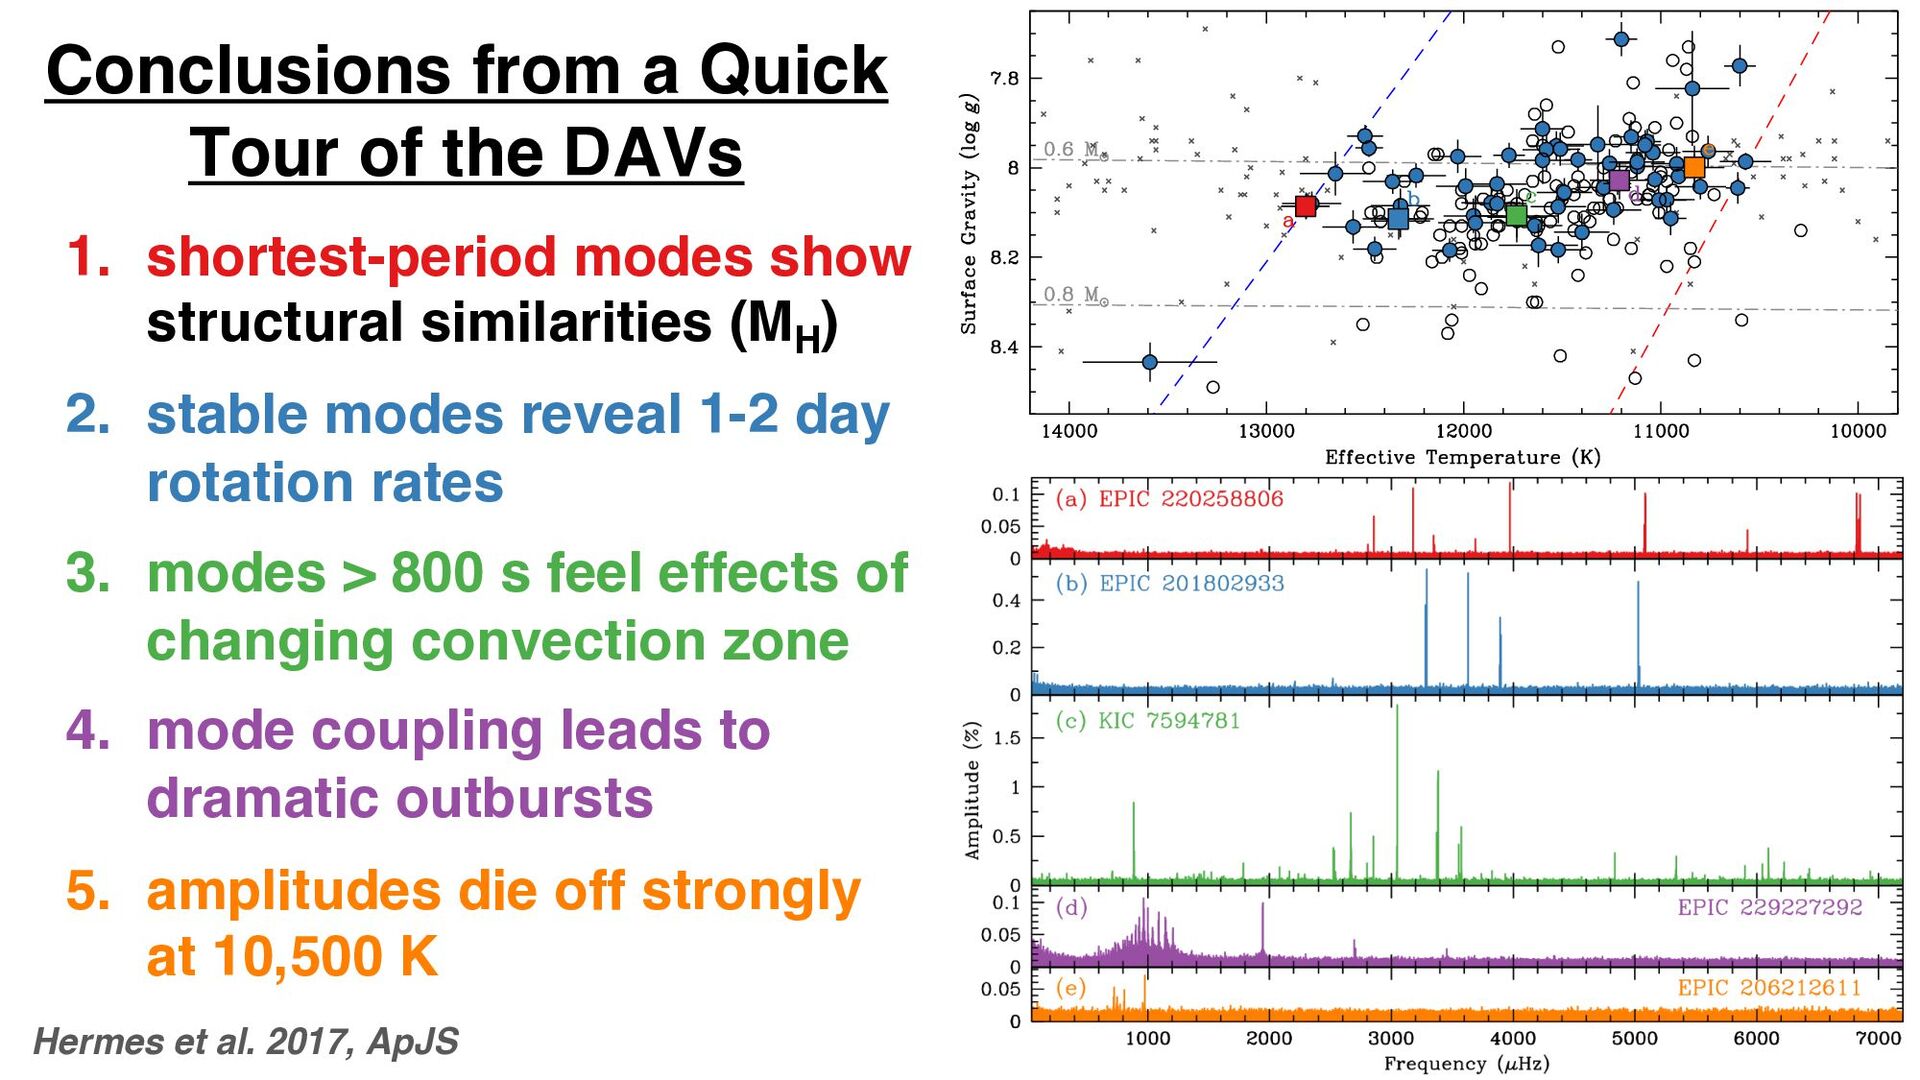
modes show structural similarities (MH ) 2. stable modes reveal 1-2 day rotation rates 3. modes > 800 s feel effects of changing convection zone see Montgomery et al. 2020 404.6 s 922.6 s
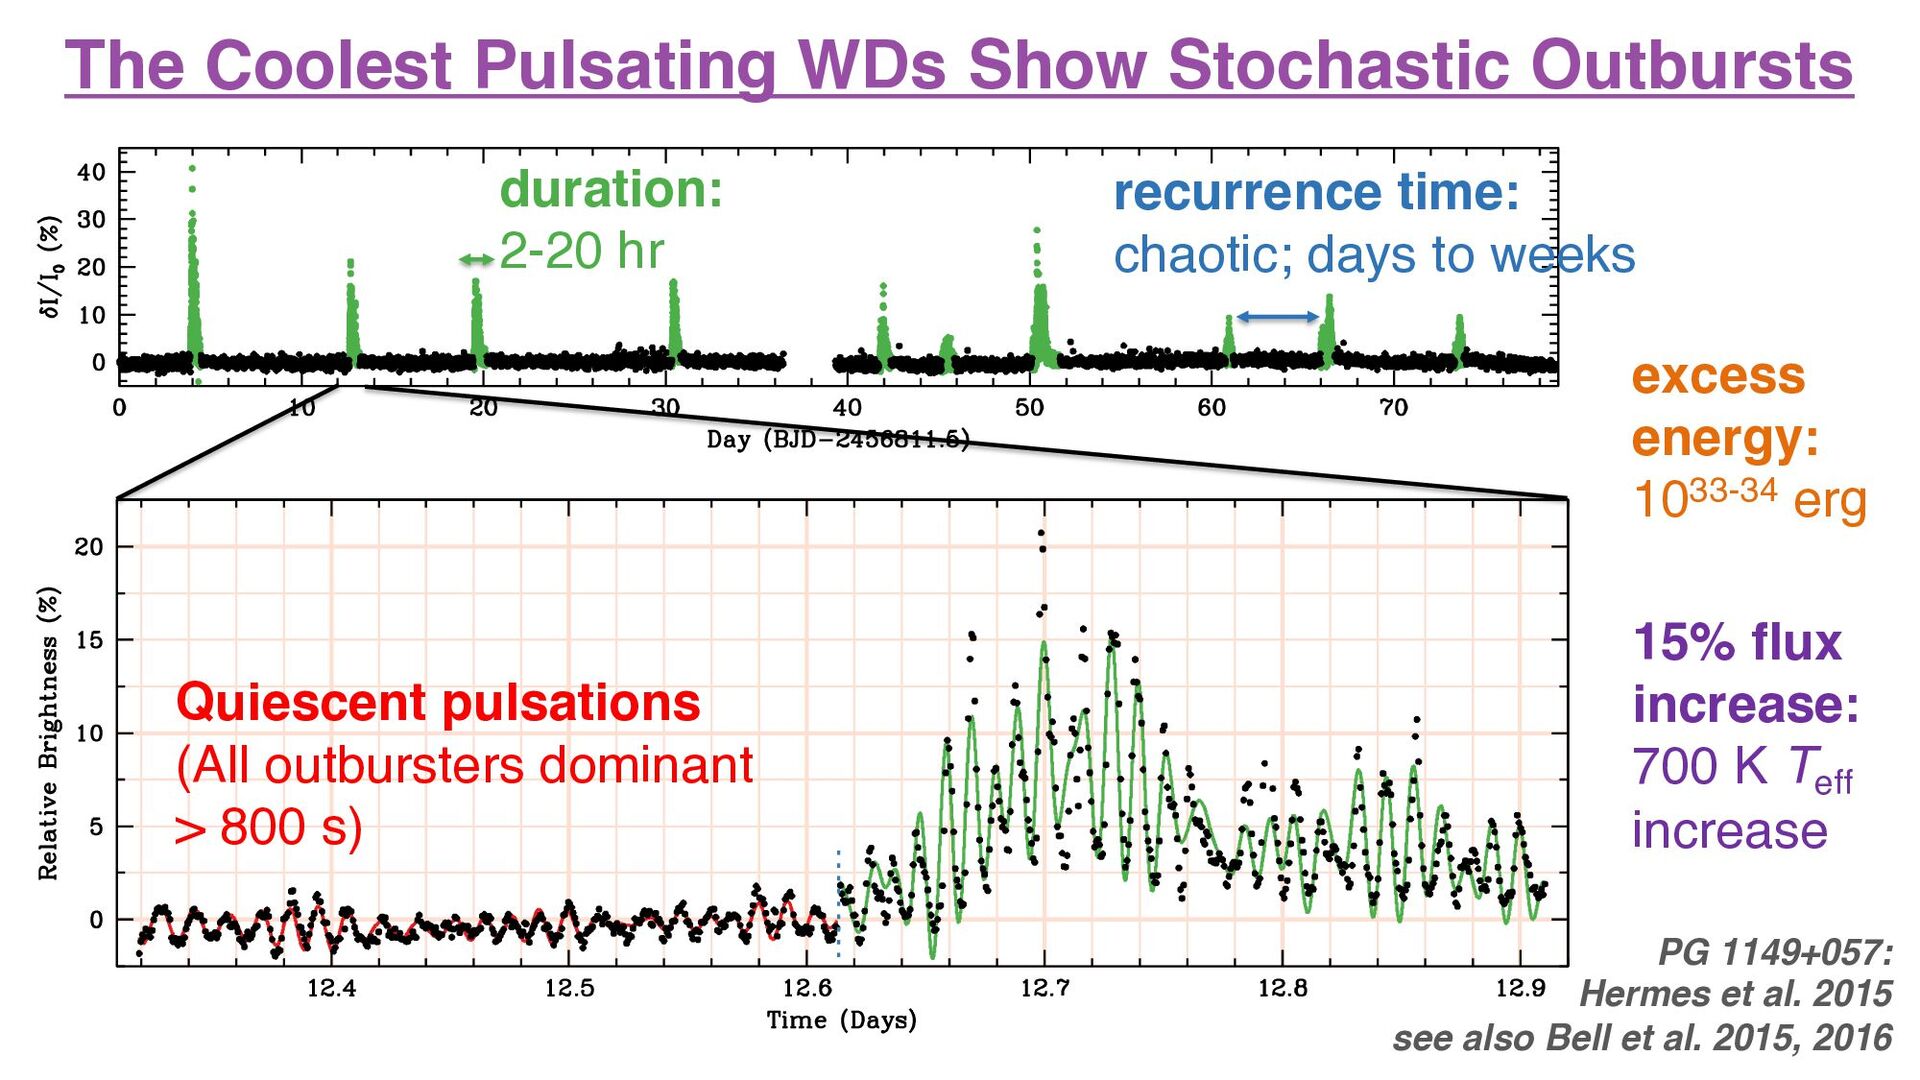
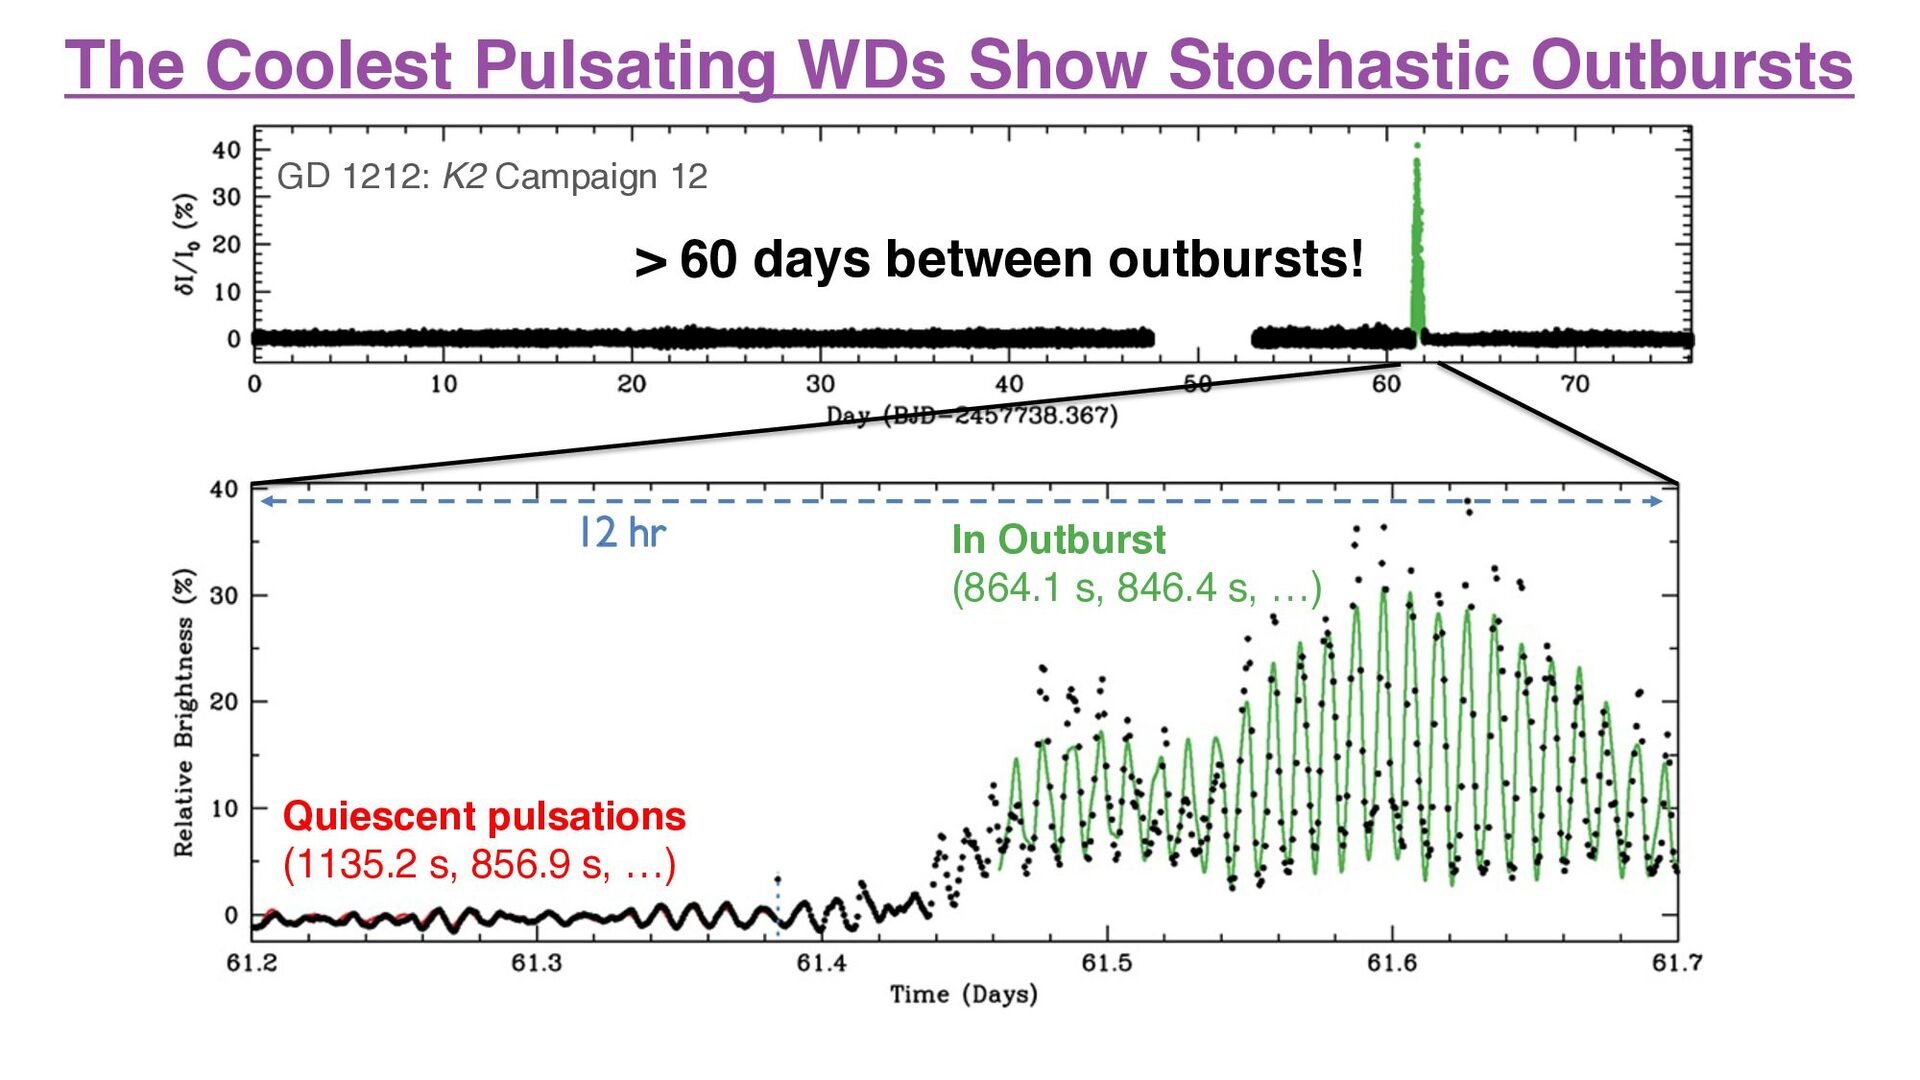
et al. 2015 see also Bell et al. 2015, 2016 Quiescent pulsations (All outbursters dominant > 800 s) recurrence time: chaotic; days to weeks duration: 2-20 hr excess energy: 1033-34 erg 15% flux increase: 700 K Teff increase
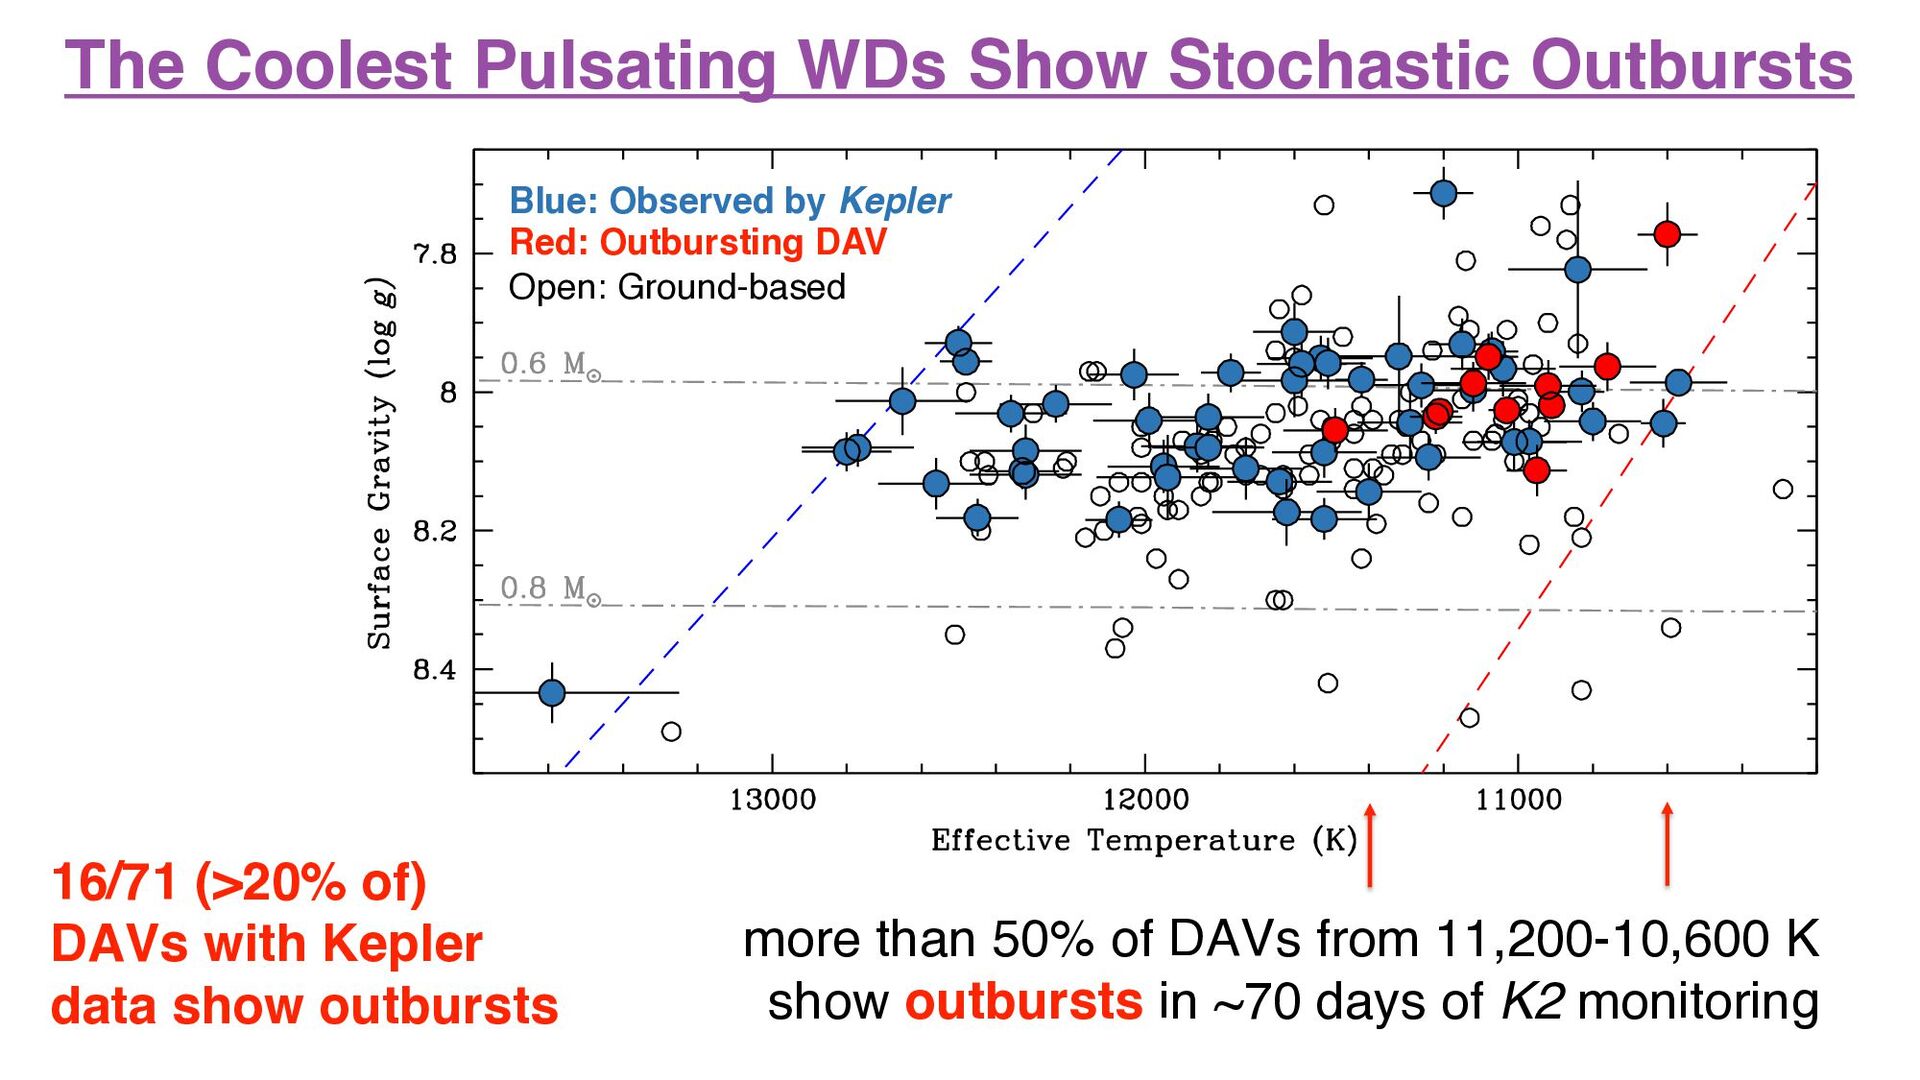
of DAVs from 11,200-10,600 K show outbursts in ~70 days of K2 monitoring 16/71 (>20% of) DAVs with Kepler data show outbursts Blue: Observed by Kepler Red: Outbursting DAV Open: Ground-based
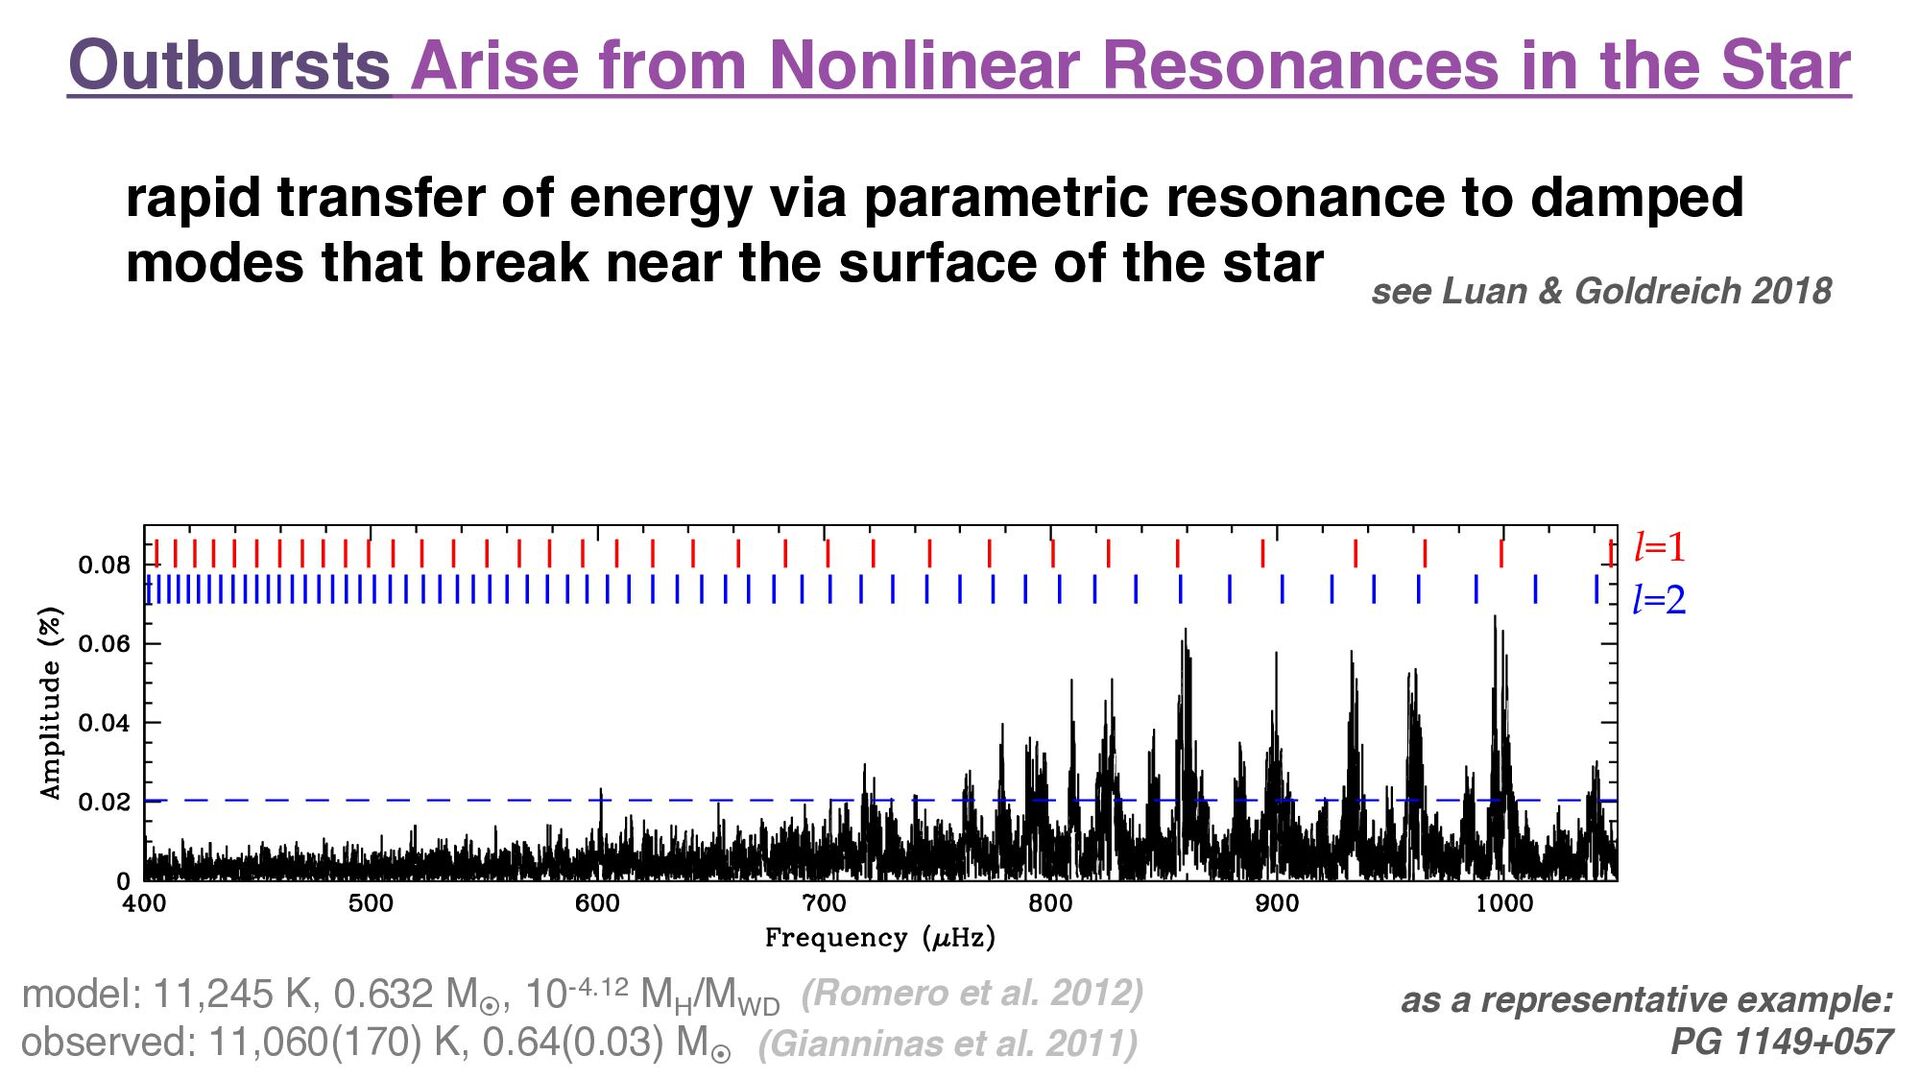
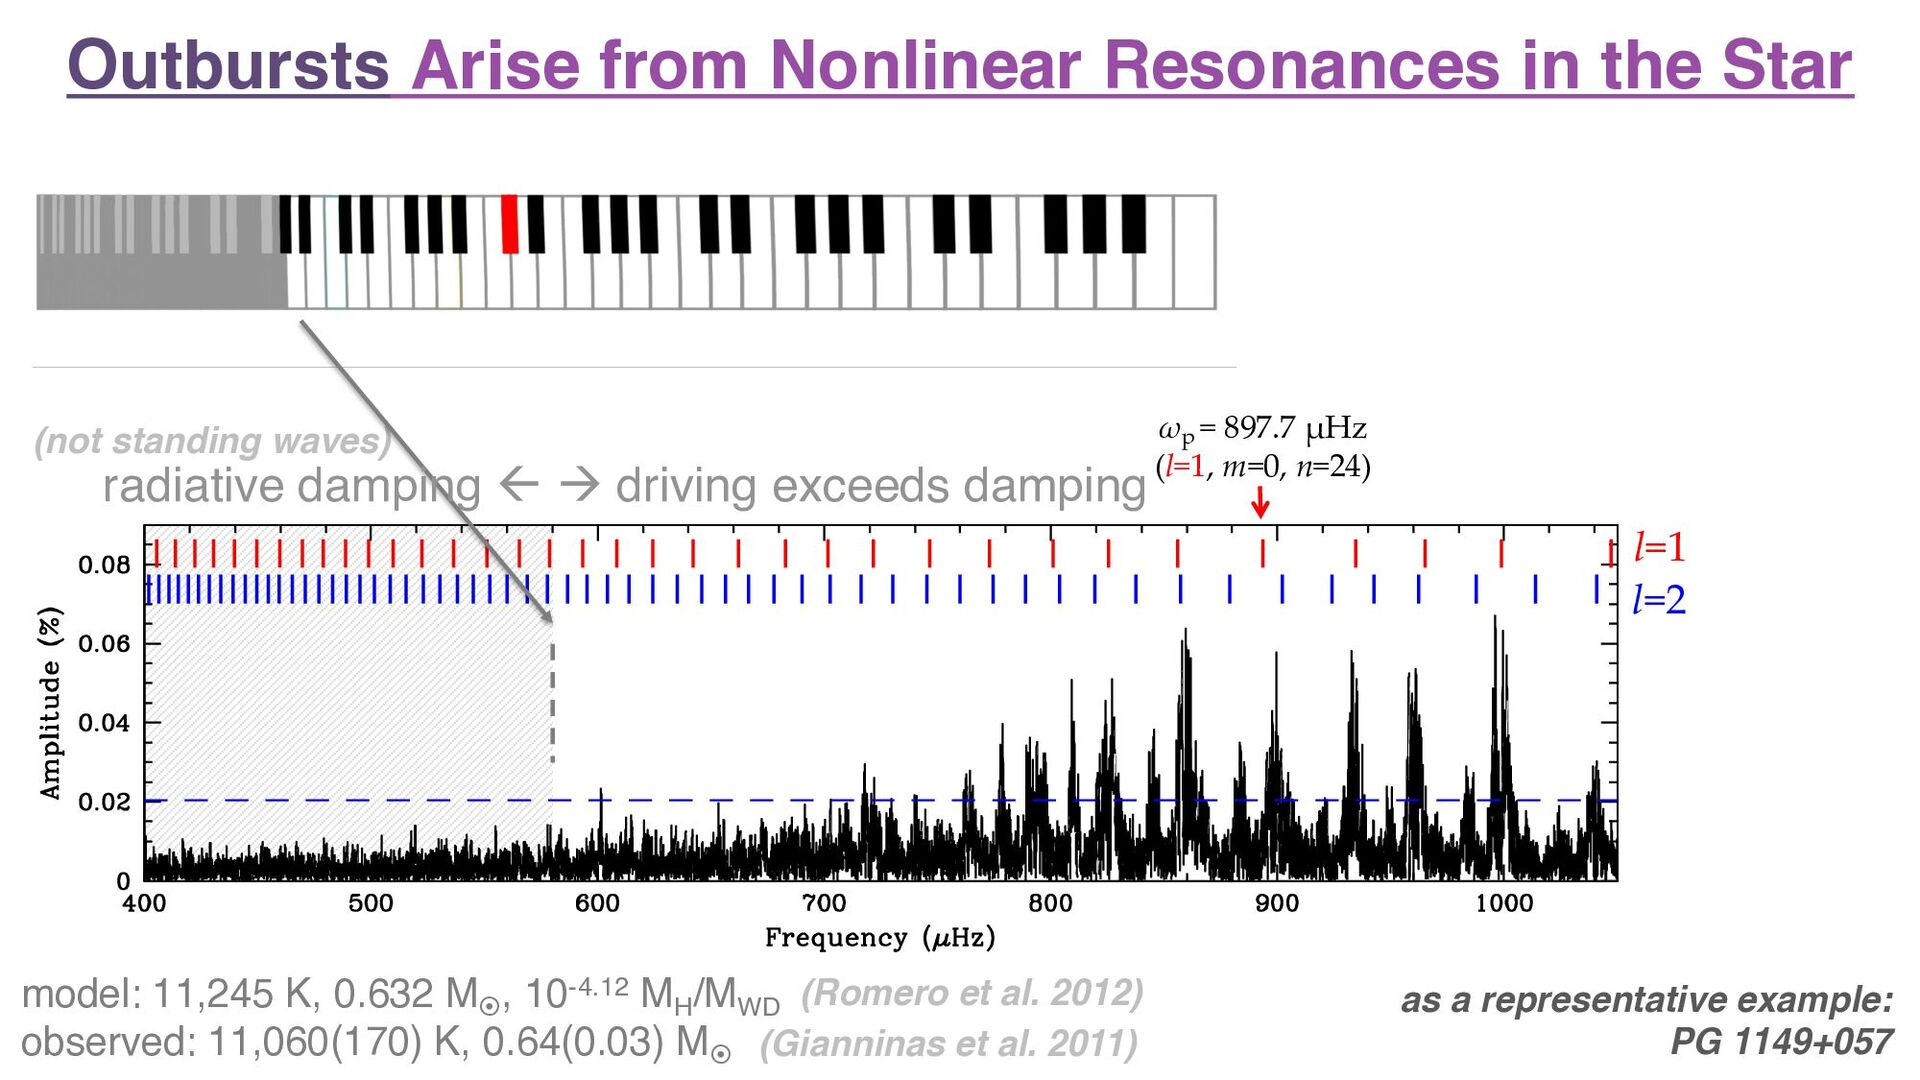
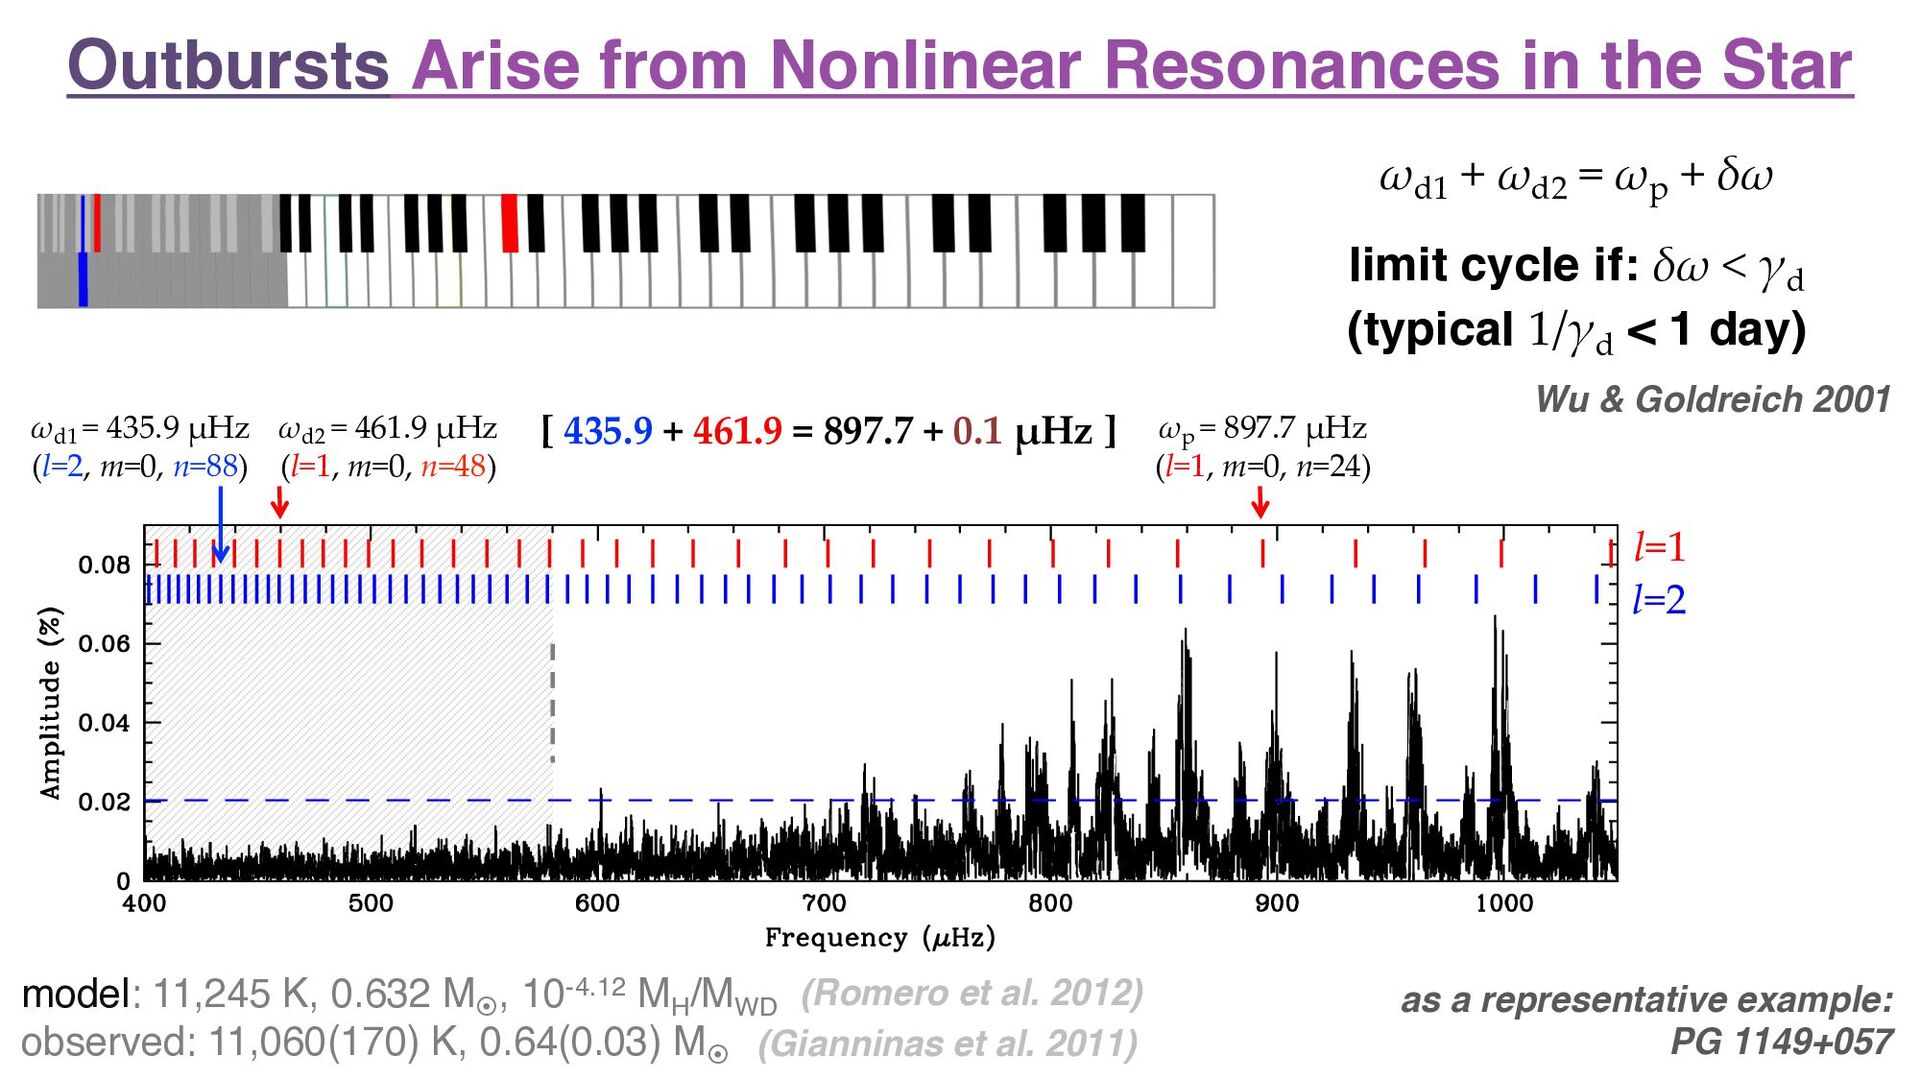
as a representative example: PG 1149+057 model: 11,245 K, 0.632 M¤ , 10-4.12 MH /MWD observed: 11,060(170) K, 0.64(0.03) M¤ (Romero et al. 2012) (Gianninas et al. 2011) rapid transfer of energy via parametric resonance to damped modes that break near the surface of the star see Luan & Goldreich 2018
modes show structural similarities (MH ) 2. stable modes reveal 1-2 day rotation rates 3. modes > 800 s feel effects of changing convection zone 4. mode coupling leads to dramatic outbursts 5. amplitudes die off strongly at 10,500 K Hermes et al. 2017, ApJS