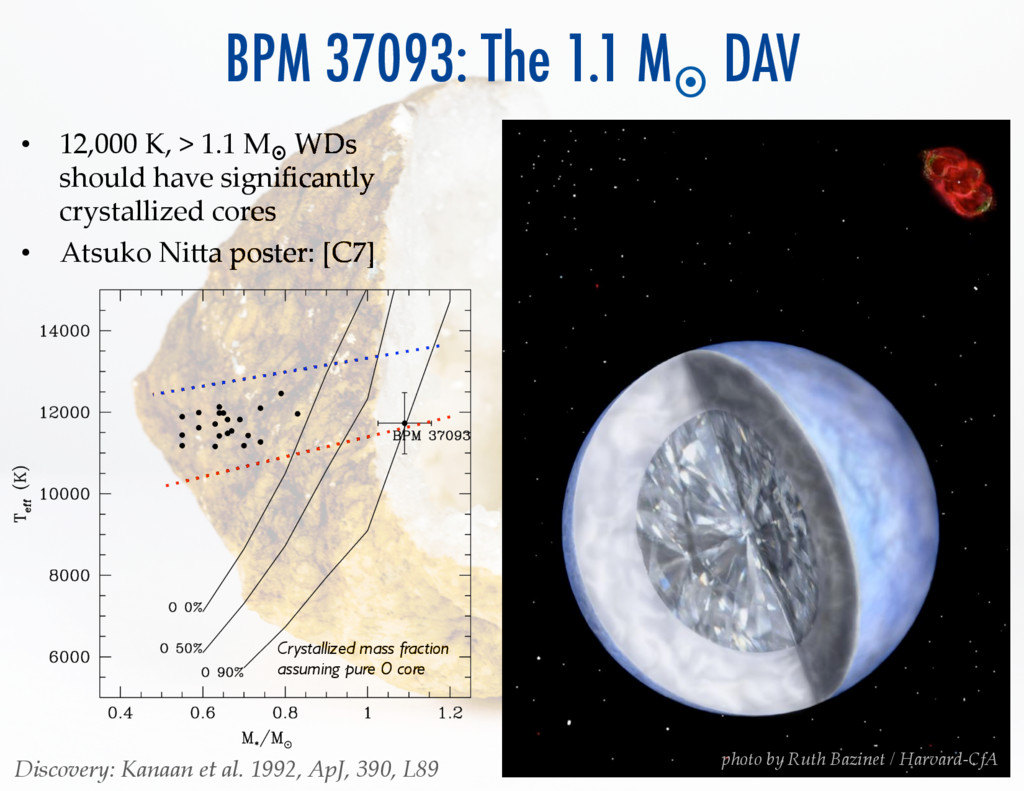
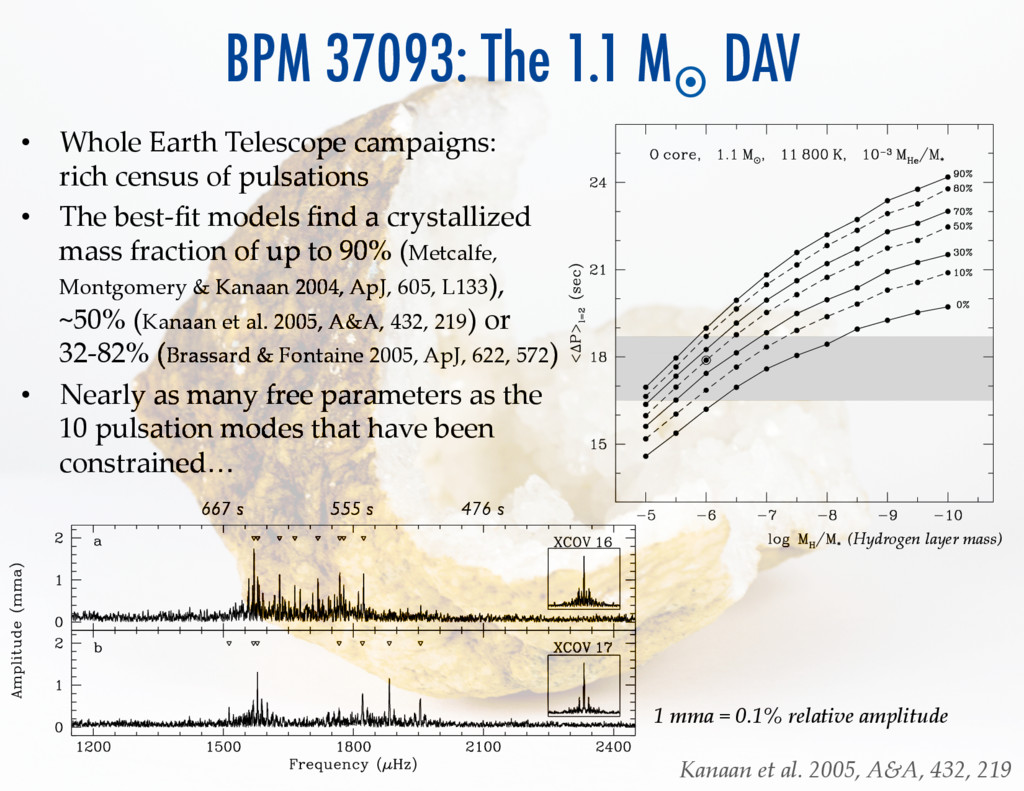
campaigns: rich census of pulsations • The best-‐‑fit models find a crystallized mass fraction of up to 90% (Metcalfe, Montgomery & Kanaan 2004, ApJ, 605, L133), ~50% (Kanaan et al. 2005, A&A, 432, 219) or 32-‐‑82% (Brassard & Fontaine 2005, ApJ, 622, 572) • Nearly as many free parameters as the 10 pulsation modes that have been constrained… Kanaan et al. 2005, A&A, 432, 219 A. Kanaan et al.: WET observations of BPM 37093 223 Fig. 2. Fourier Transforms and window functions at the same scale for the Whole Earth Telescope observations of the ZZ Ceti star BPM 37093 obtained during a) the XCOV 16 campaign in 1998, and b) the XCOV 17 campaign in 1999. hydrogen profiles that were derived assuming diffusive equilib- rium in the trace element approximation. This produced unre- alistically sharp chemical gradients at the base of the hydro- gen layer, leading to stronger mode trapping in their models. This was demonstrated by Córsico et al. (2002), who compared models that assumed diffusive equilibrium in the trace element approximation with models that computed the abundance pro- files based on time-dependent diffusion calculations. In a recent extension of this work to massive ZZ Ceti stars, Althaus et al. (2003) described an improved method of calculating diffusive equilibrium profiles that compare favorably with the fully time- dependent results (see their Fig. 18). We have incorporated this method of computing the hydrogen abundance profiles into the code used by Montgomery & Winget (1999). However, since the sharpness of the hydrogen transition zone should mainly affect the mode trapping properties of the models, we expect that our new average period spacings will differ only slightly from those computed by Montgomery & Winget (1999). As a simple illustration of the potential of our observations, we calculated ∆P for a small grid with various combinations of MH and Mcr . We fixed the mass, temperature, and helium layer thickness to the values used for Fig. 10b of Montgomery & Winget (1999), but we assumed a uniform O core. We show this grid of models in Fig. 3 with the shaded 1σ range of the average period spacing from the WET observations of BPM 37093. As expected, the average period spacing of the 0% crystallized model is virtually identical to that found by Montgomery & Winget (1999). However, due to the different assumed C/O profiles, the crystallized curves have shifted with respect to the results of Montgomery & Winget (1999). Unfortunately, the degeneracy between MH and Mcr is still present, but we have not yet used the hidden third dimension of Fig. 3. The average period spacing of a small grid of models with var- ious combinations of MH and Mcr . The 1σ range of the observed av- erage period spacing for BPM 37093 is shown as a shaded area, and the circled point indicates the model with the smallest rms difference between the observed and calculated periods (see text for details). log(MH/M∗ ) = −6 and Mcr = 50% has σP = 1.08 s, which is substantially better than anything else in this small grid (the next best model has σP = 1.70 s). A theoretical model with (Hydrogen layer mass) 667 s 555 s 476 s 1 mma = 0.1% relative amplitude