of Chemistry, University of Manchester ([email protected]) Temperature and pressure effects on phase stability from theoretical modelling: application to the tin-sulphide phase space
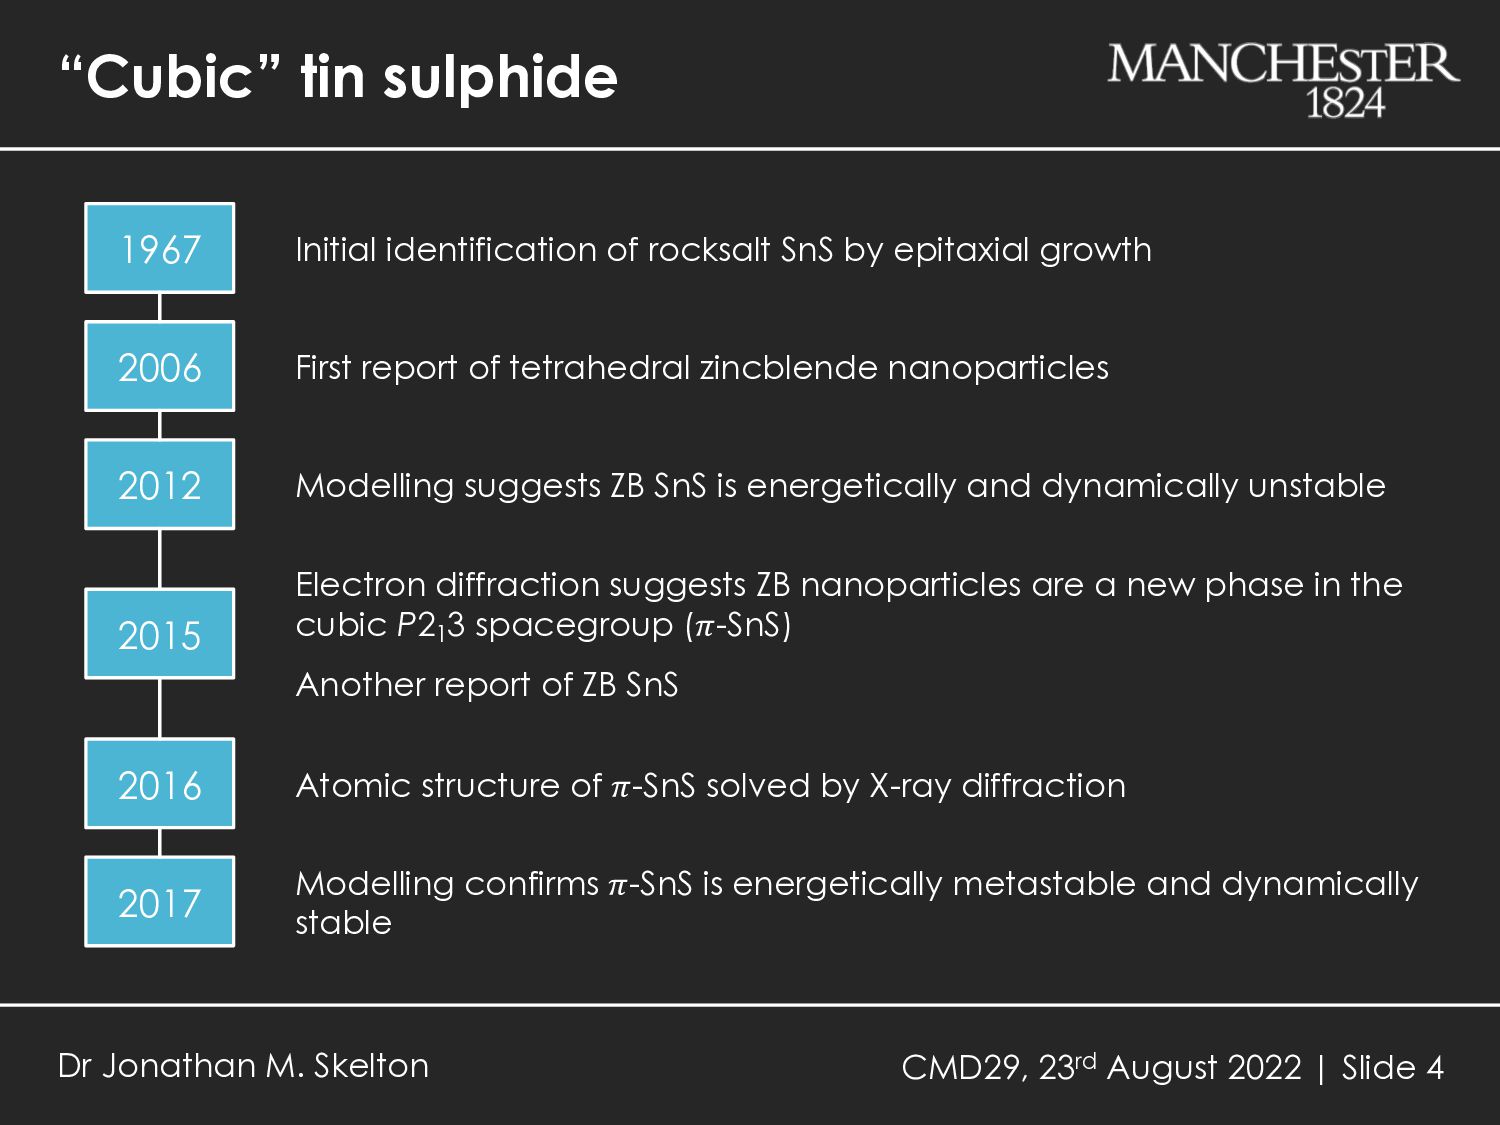
Dr Jonathan M. Skelton 1967 2006 2012 2015 2016 2017 Initial identification of rocksalt SnS by epitaxial growth First report of tetrahedral zincblende nanoparticles Modelling suggests ZB SnS is energetically and dynamically unstable Electron diffraction suggests ZB nanoparticles are a new phase in the cubic P21 3 spacegroup (𝜋-SnS) Another report of ZB SnS Atomic structure of 𝜋-SnS solved by X-ray diffraction Modelling confirms 𝜋-SnS is energetically metastable and dynamically stable
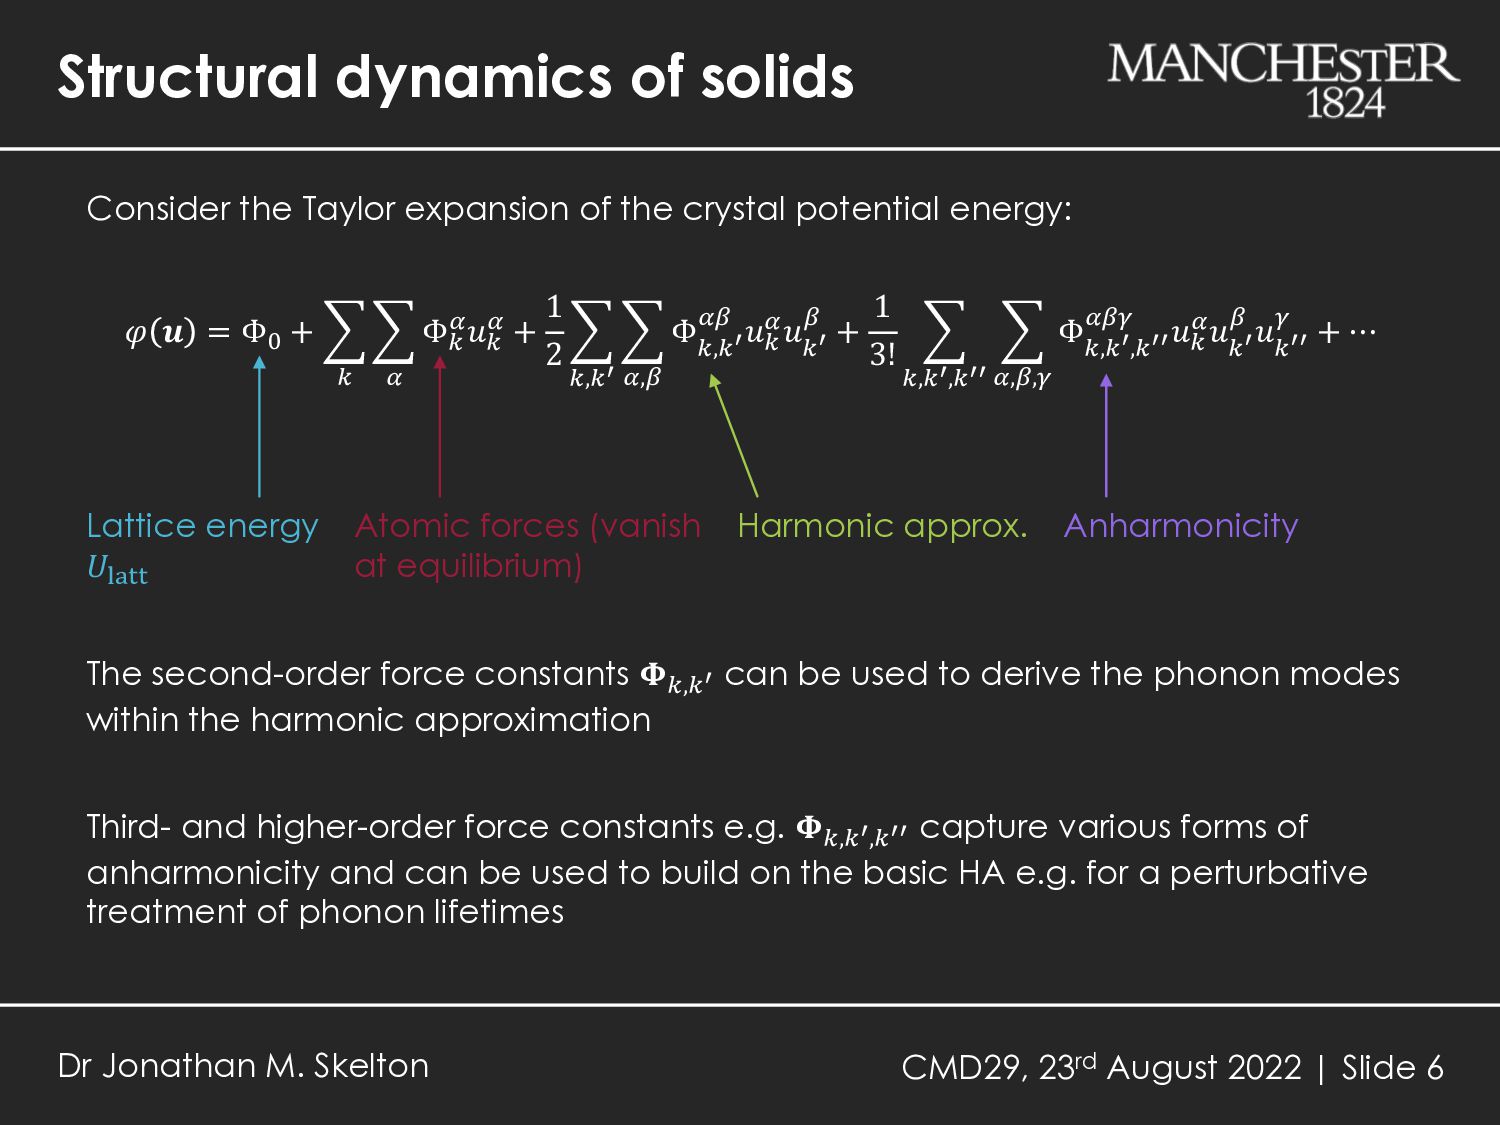
6 Dr Jonathan M. Skelton Consider the Taylor expansion of the crystal potential energy: The second-order force constants 𝚽!,!! can be used to derive the phonon modes within the harmonic approximation 𝜑 𝒖 = Φ# + ( ! ( $ Φ! $𝑢! $ + 1 2 ( !,!! ( $,% Φ !,!! $% 𝑢! $𝑢 !! % + 1 3! ( !,!!,!!! ( $,%,& Φ !,!!,!!! $%& 𝑢! $𝑢 !! % 𝑢 !!! & + ⋯ Third- and higher-order force constants e.g. 𝚽!,!!,!!! capture various forms of anharmonicity and can be used to build on the basic HA e.g. for a perturbative treatment of phonon lifetimes Lattice energy 𝑈'()) Atomic forces (vanish at equilibrium) Harmonic approx. Anharmonicity
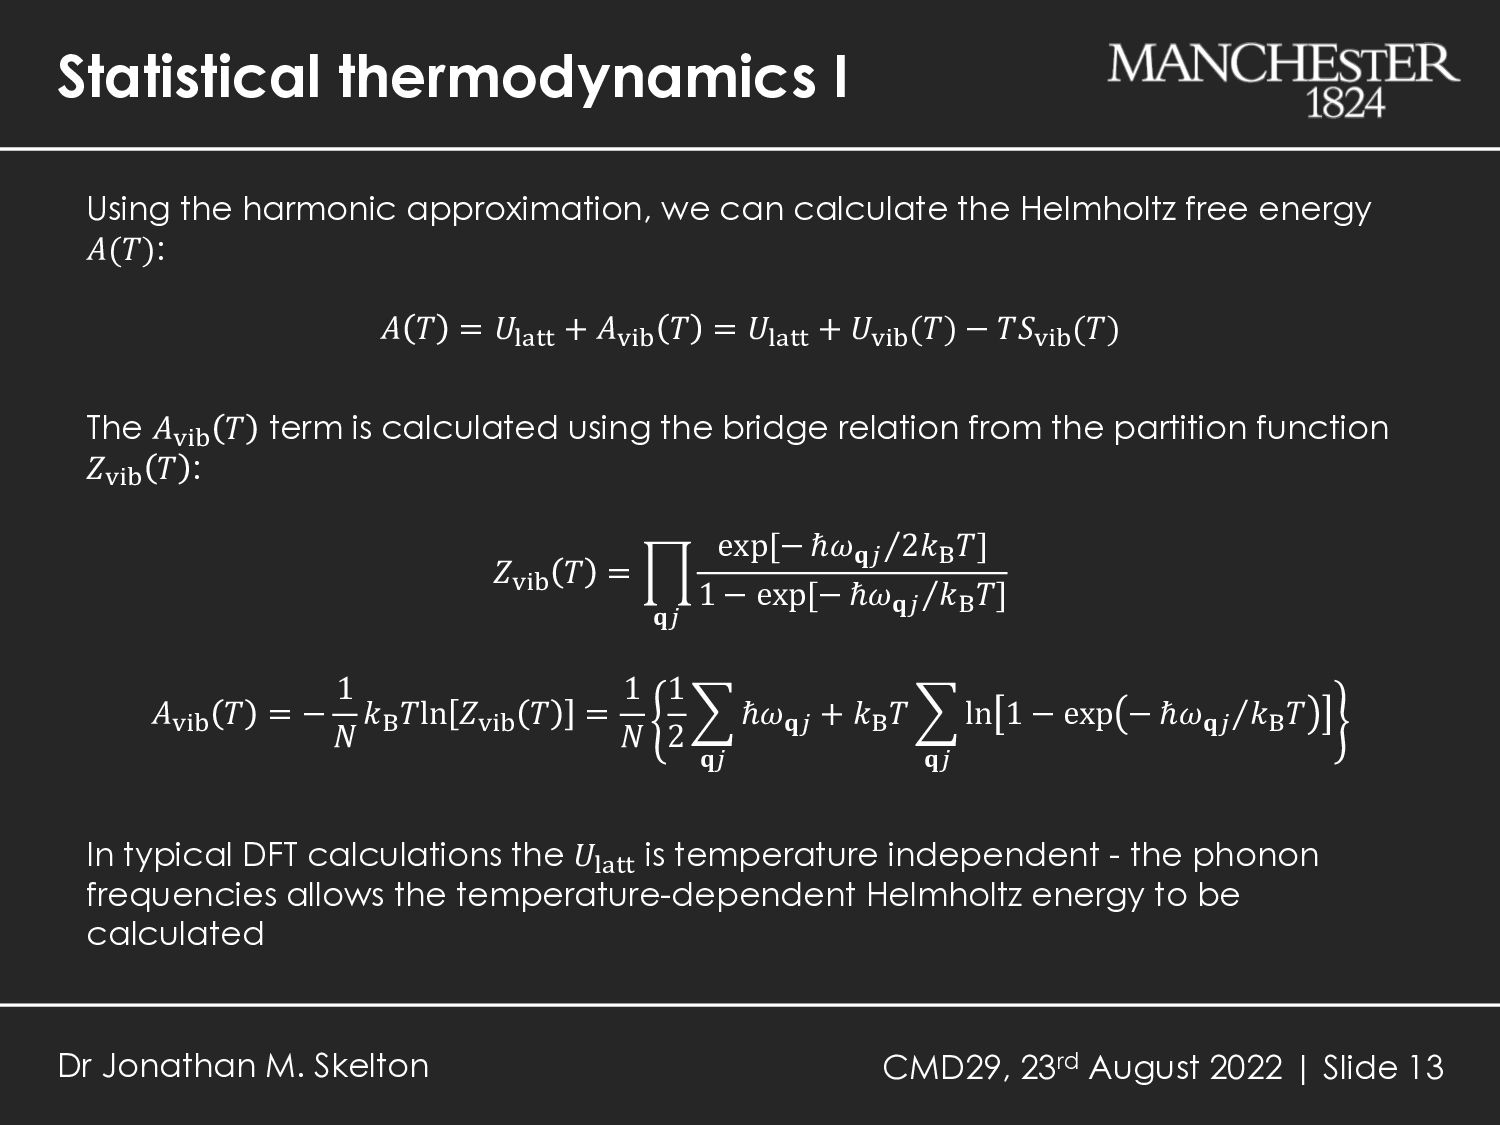
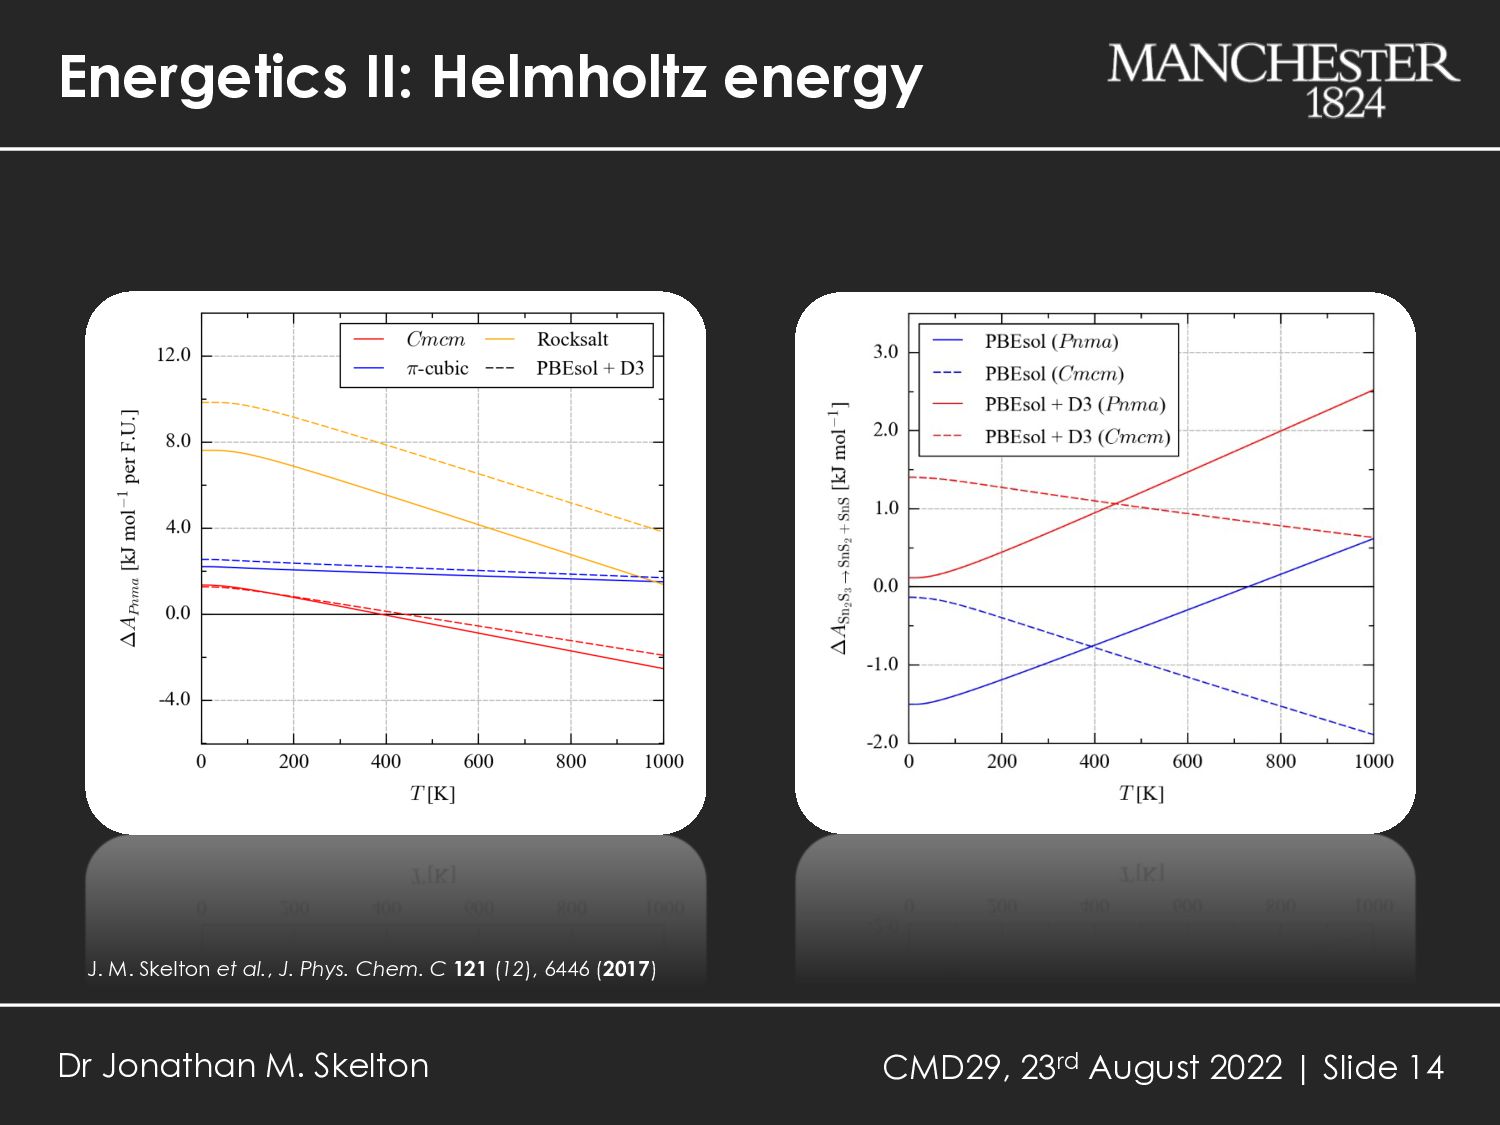
Dr Jonathan M. Skelton Using the harmonic approximation, we can calculate the Helmholtz free energy 𝐴(𝑇): 𝐴 𝑇 = 𝑈'()) + 𝐴+,- 𝑇 = 𝑈'()) + 𝑈+,-(𝑇) − 𝑇𝑆+,-(𝑇) The 𝐴+,- 𝑇 term is calculated using the bridge relation from the partition function 𝑍+,- 𝑇 : 𝑍+,- 𝑇 = : 𝐪/ exp[− ⁄ ℏ𝜔𝐪/ 2𝑘0𝑇] 1 − exp[− ⁄ ℏ𝜔𝐪/ 𝑘0𝑇] 𝐴+,- 𝑇 = − 1 𝑁 𝑘0 𝑇ln 𝑍+,- 𝑇 = 1 𝑁 1 2 ( 𝐪/ ℏ𝜔𝐪/ + 𝑘0 𝑇 ( 𝐪/ ln 1 − exp − ⁄ ℏ𝜔𝐪/ 𝑘0 𝑇 In typical DFT calculations the 𝑈'()) is temperature independent - the phonon frequencies allows the temperature-dependent Helmholtz energy to be calculated
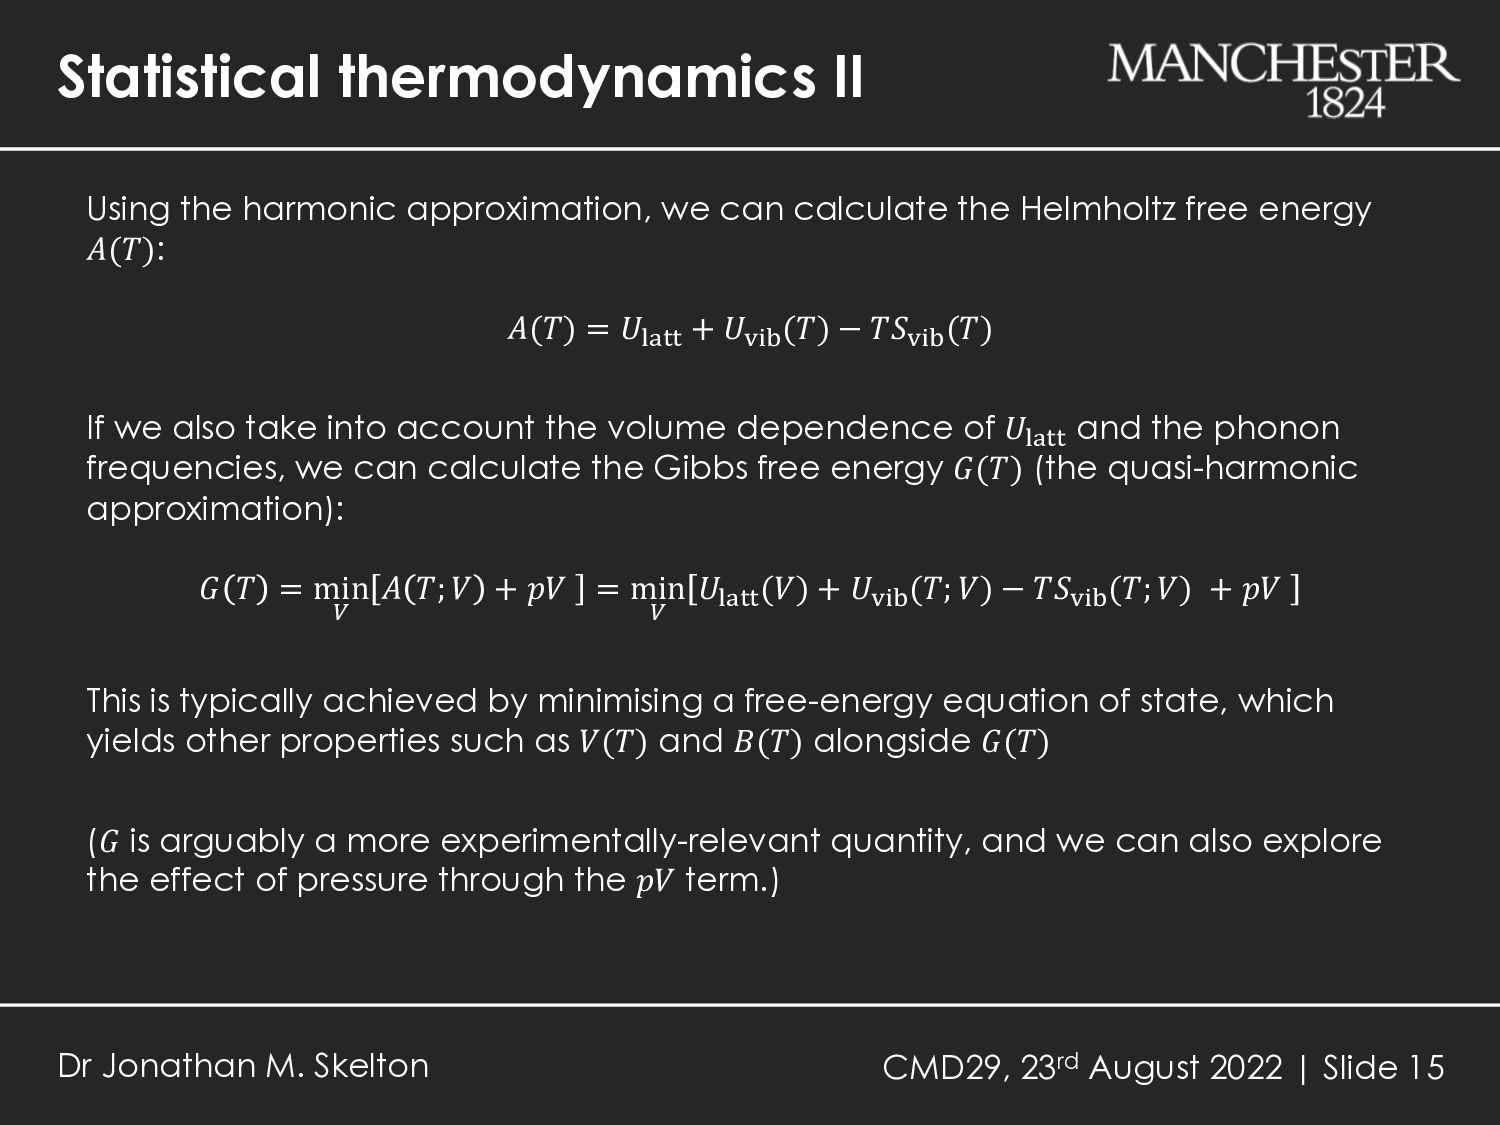
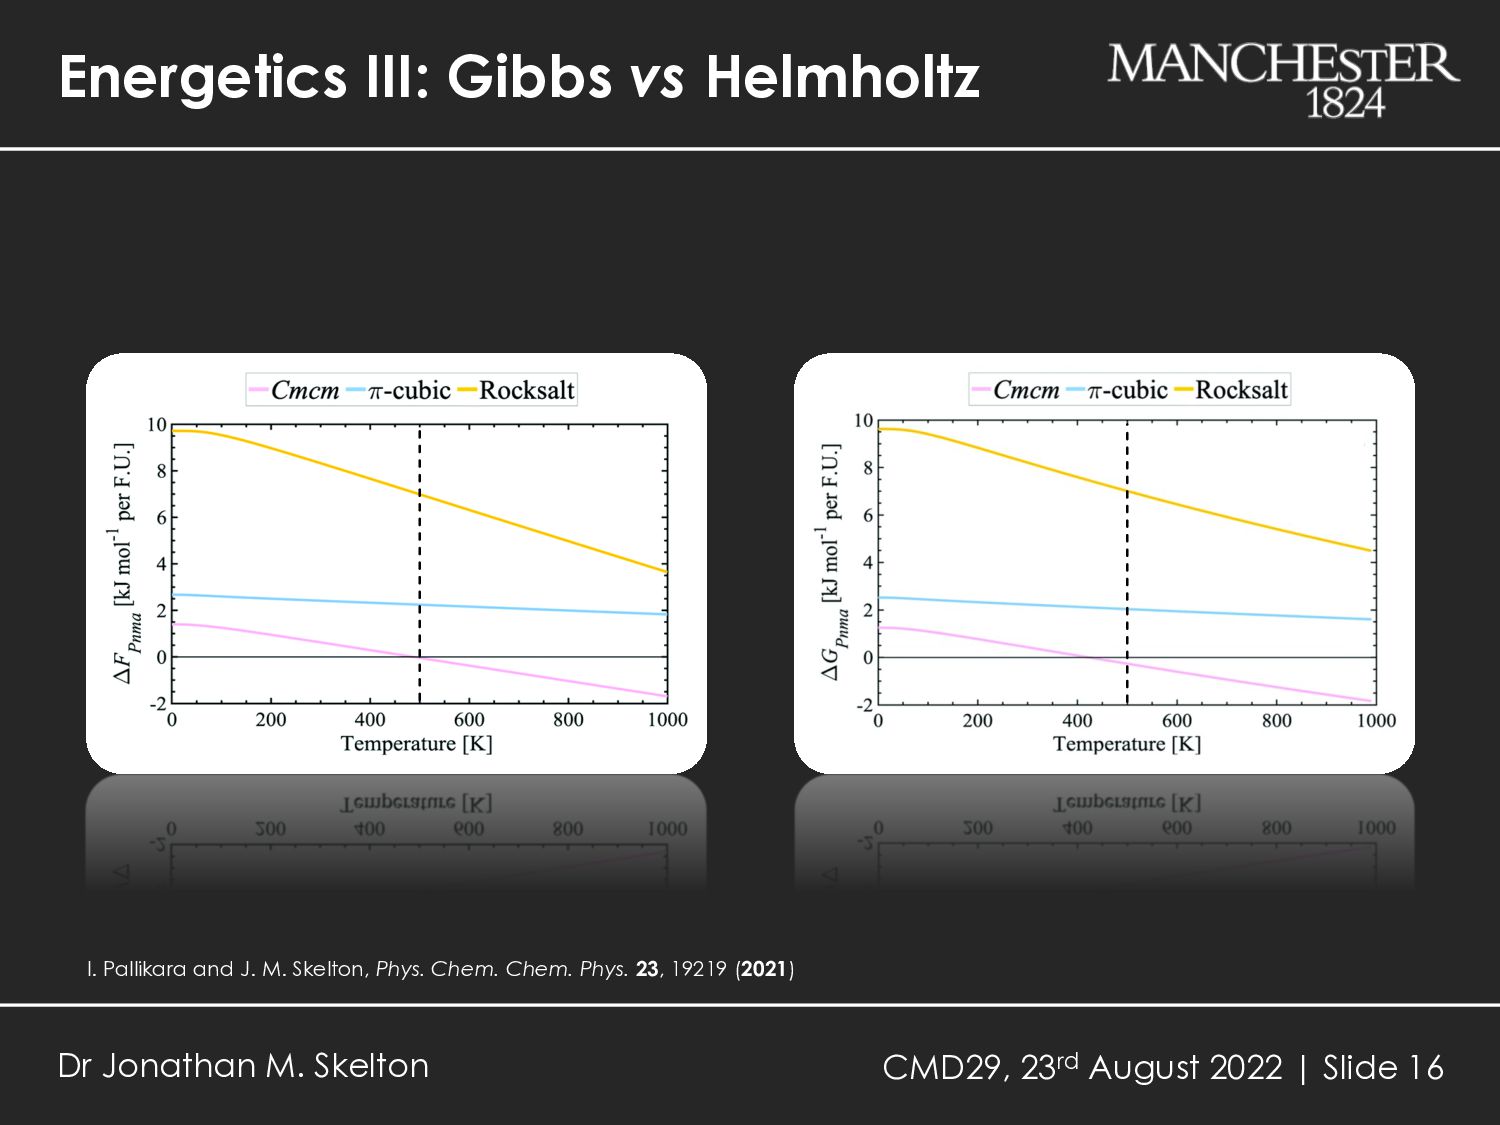
Dr Jonathan M. Skelton Using the harmonic approximation, we can calculate the Helmholtz free energy 𝐴(𝑇): 𝐴(𝑇) = 𝑈'()) + 𝑈+,-(𝑇) − 𝑇𝑆+,-(𝑇) If we also take into account the volume dependence of 𝑈'()) and the phonon frequencies, we can calculate the Gibbs free energy 𝐺(𝑇) (the quasi-harmonic approximation): 𝐺 𝑇 = min 1 𝐴 𝑇; 𝑉 + 𝑝𝑉 = min 1 𝑈'()) (𝑉) + 𝑈+,- (𝑇; 𝑉) − 𝑇𝑆+,- (𝑇; 𝑉) + 𝑝𝑉 This is typically achieved by minimising a free-energy equation of state, which yields other properties such as 𝑉(𝑇) and 𝐵(𝑇) alongside 𝐺(𝑇) (𝐺 is arguably a more experimentally-relevant quantity, and we can also explore the effect of pressure through the 𝑝𝑉 term.)
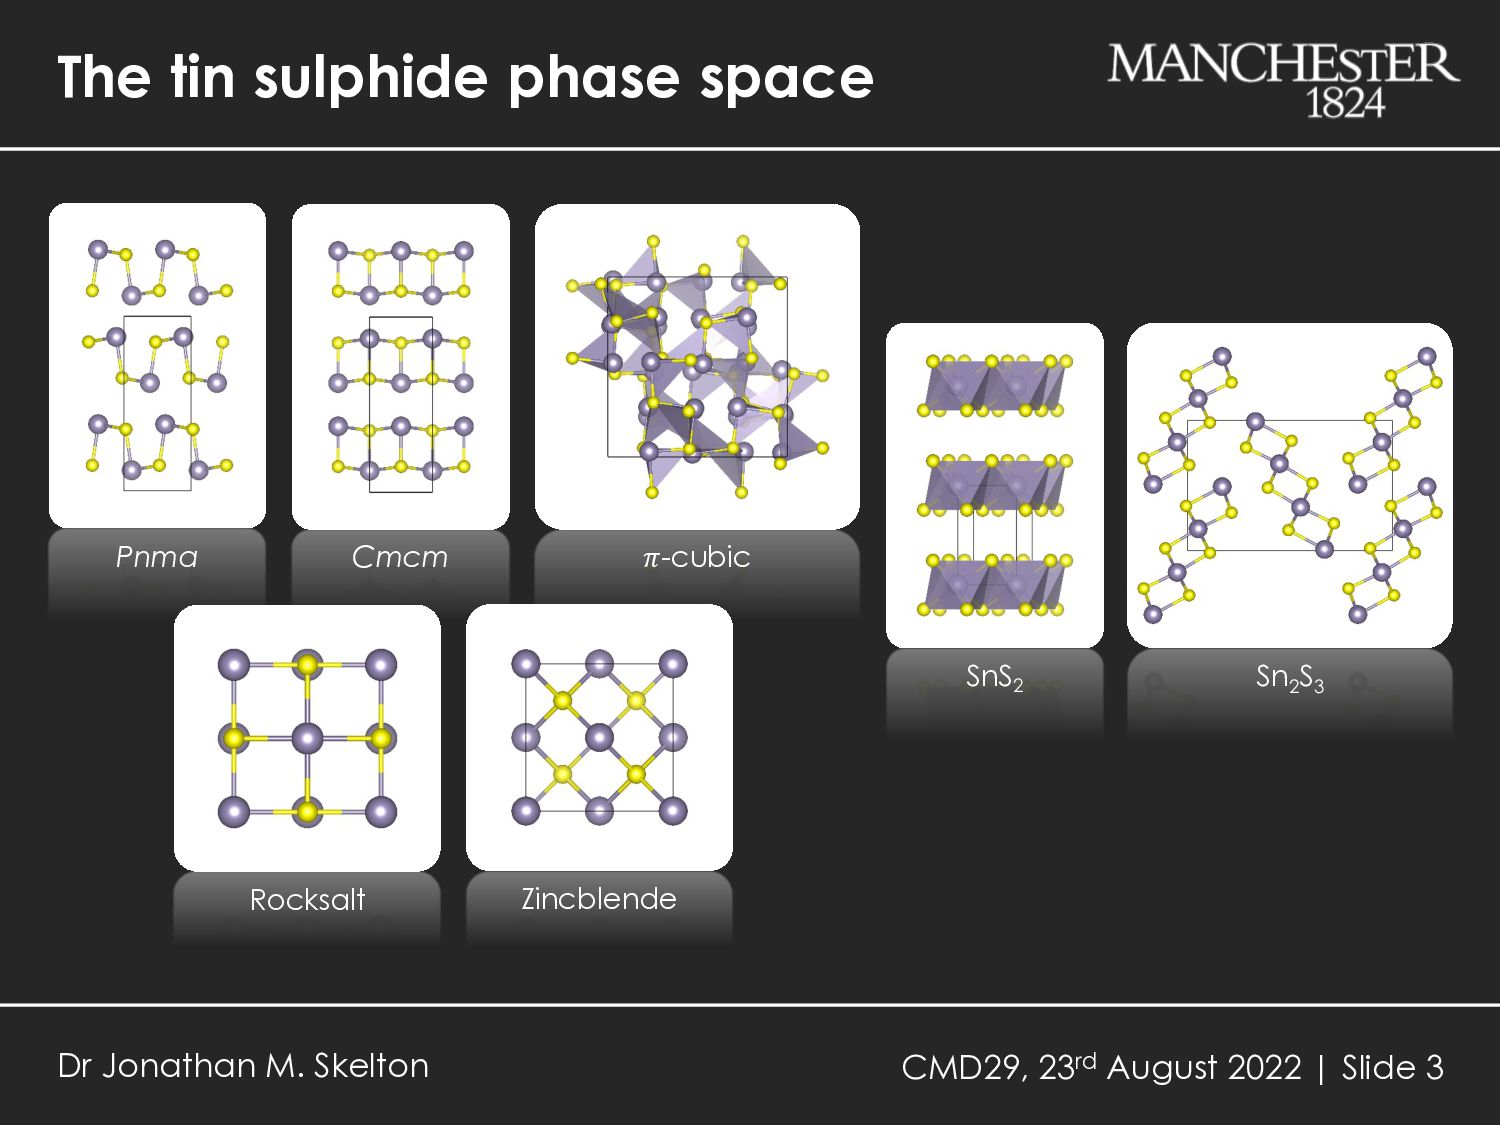
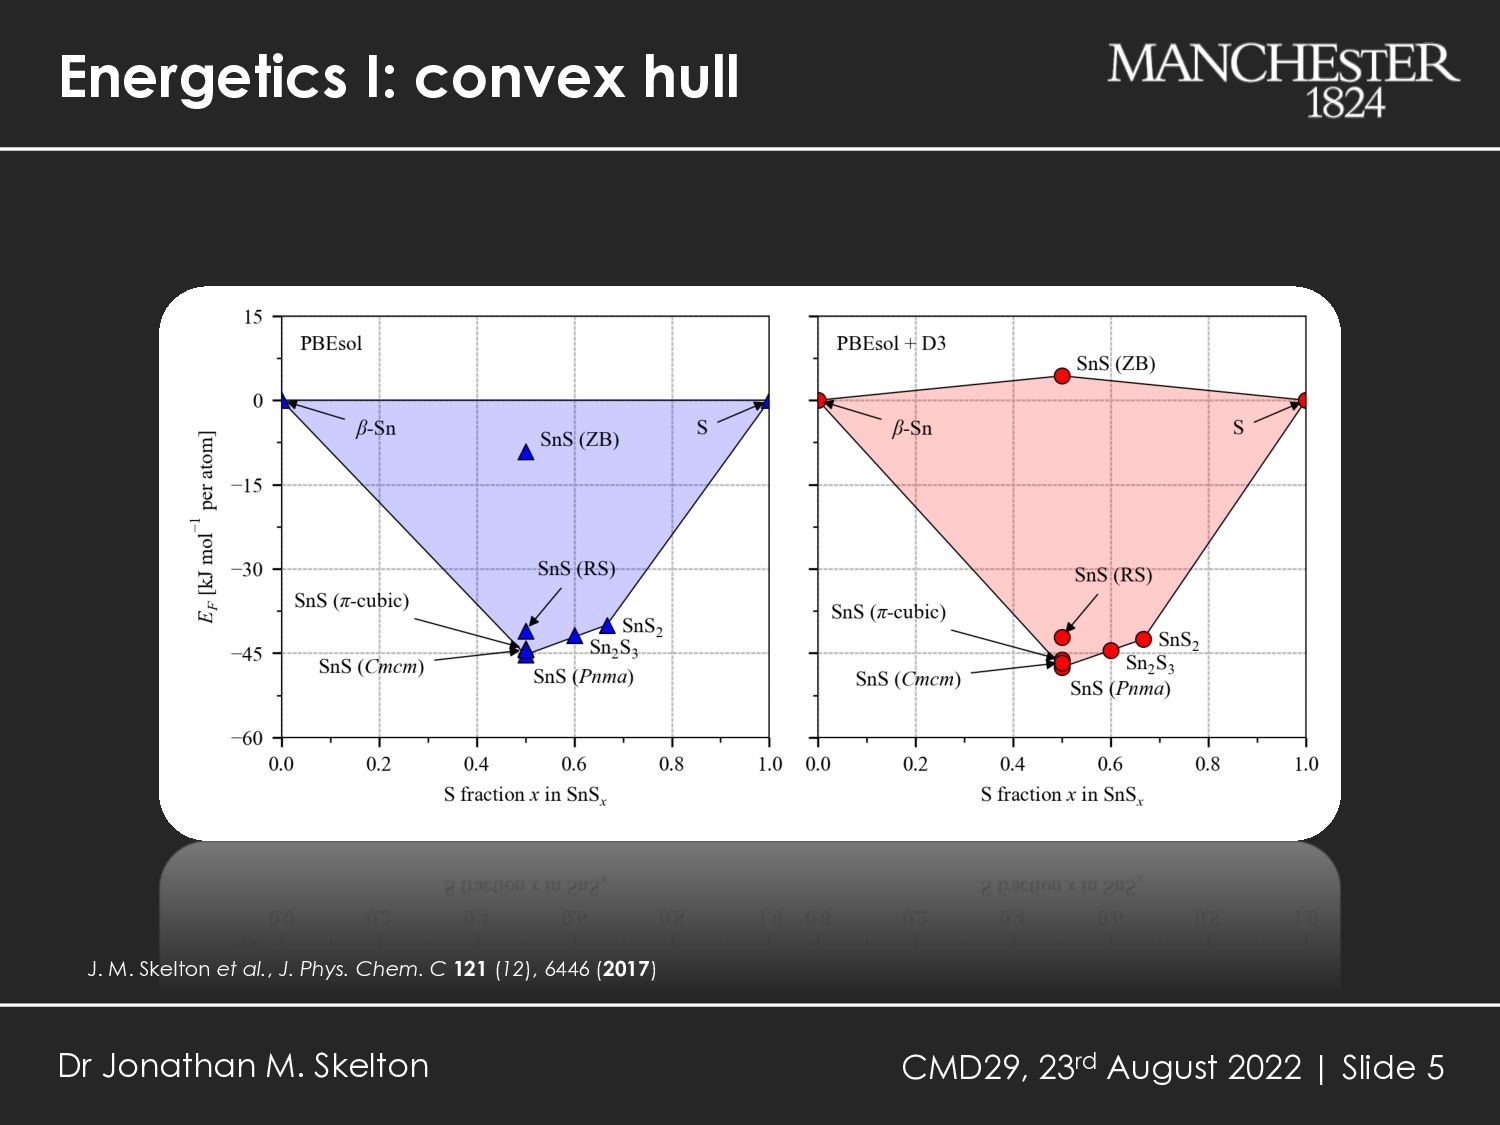
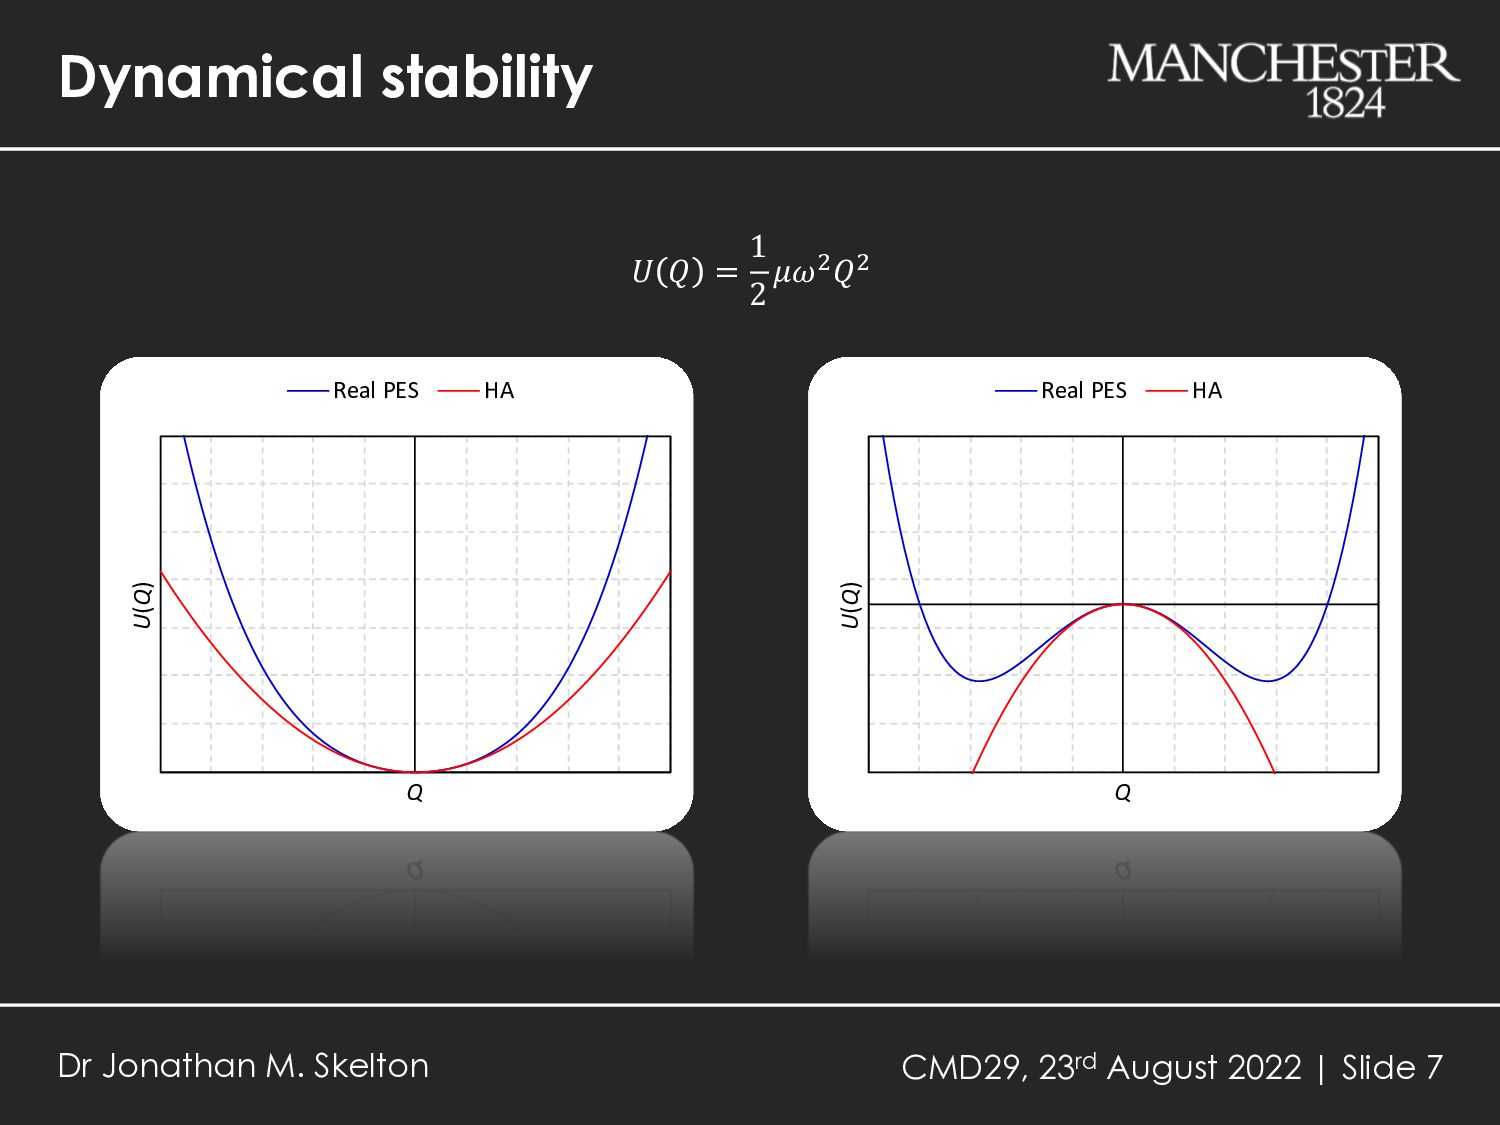
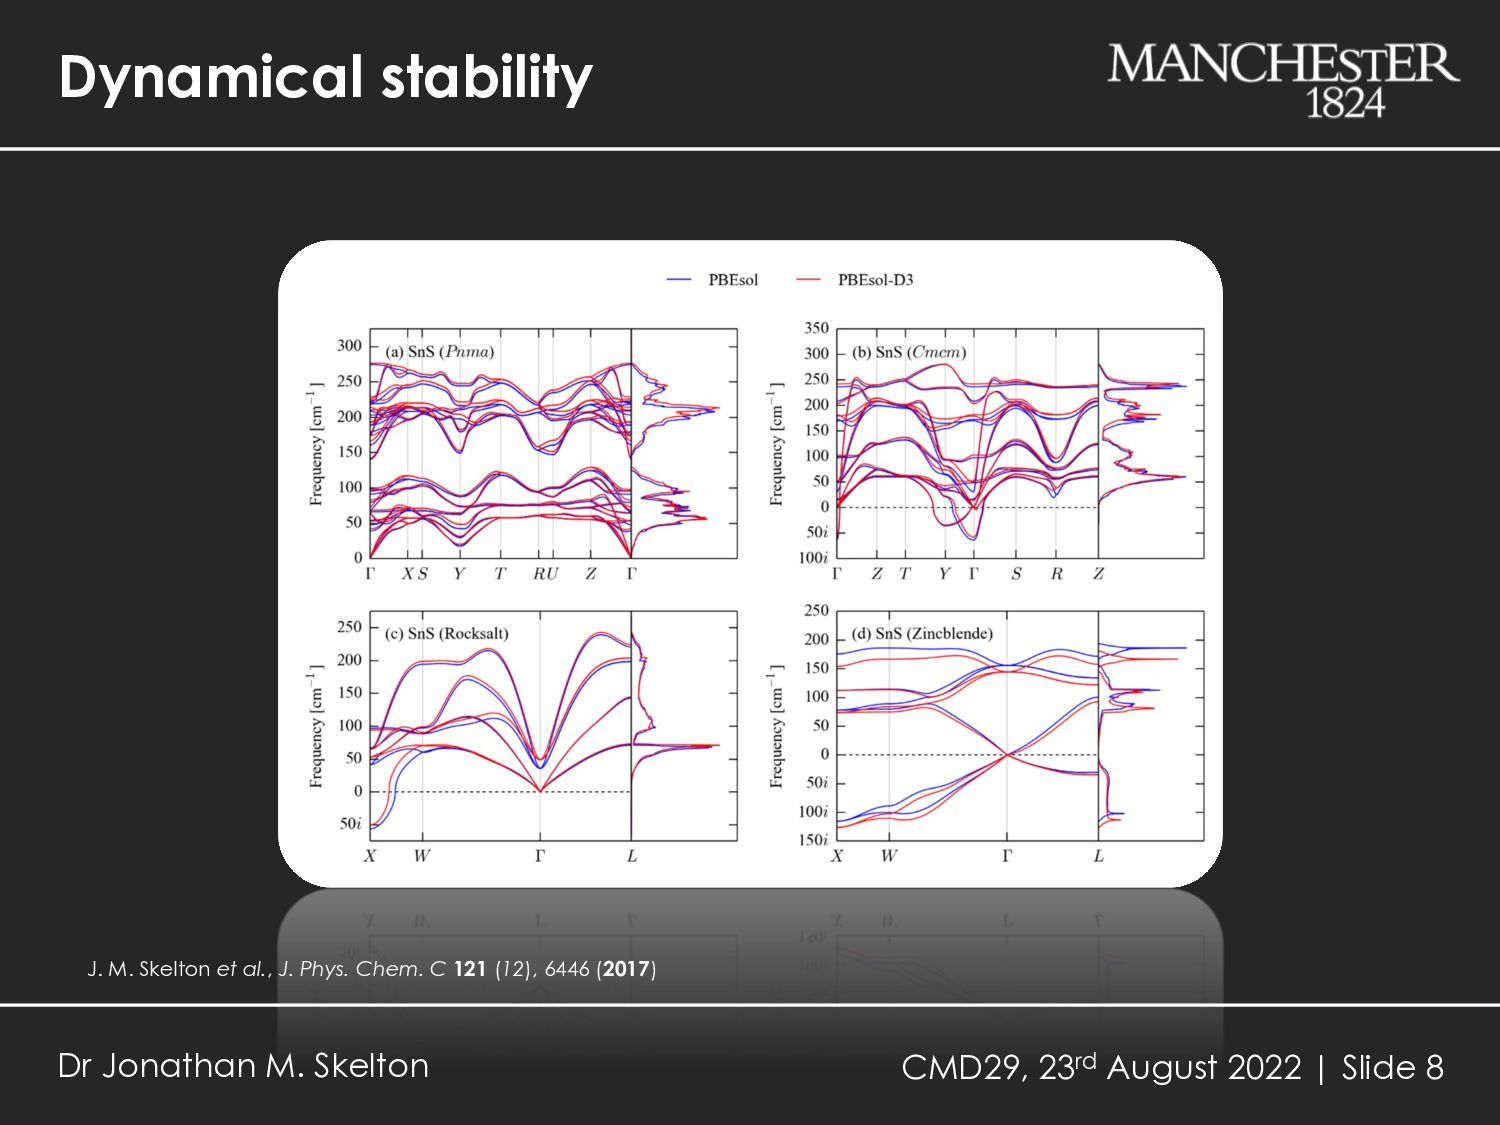
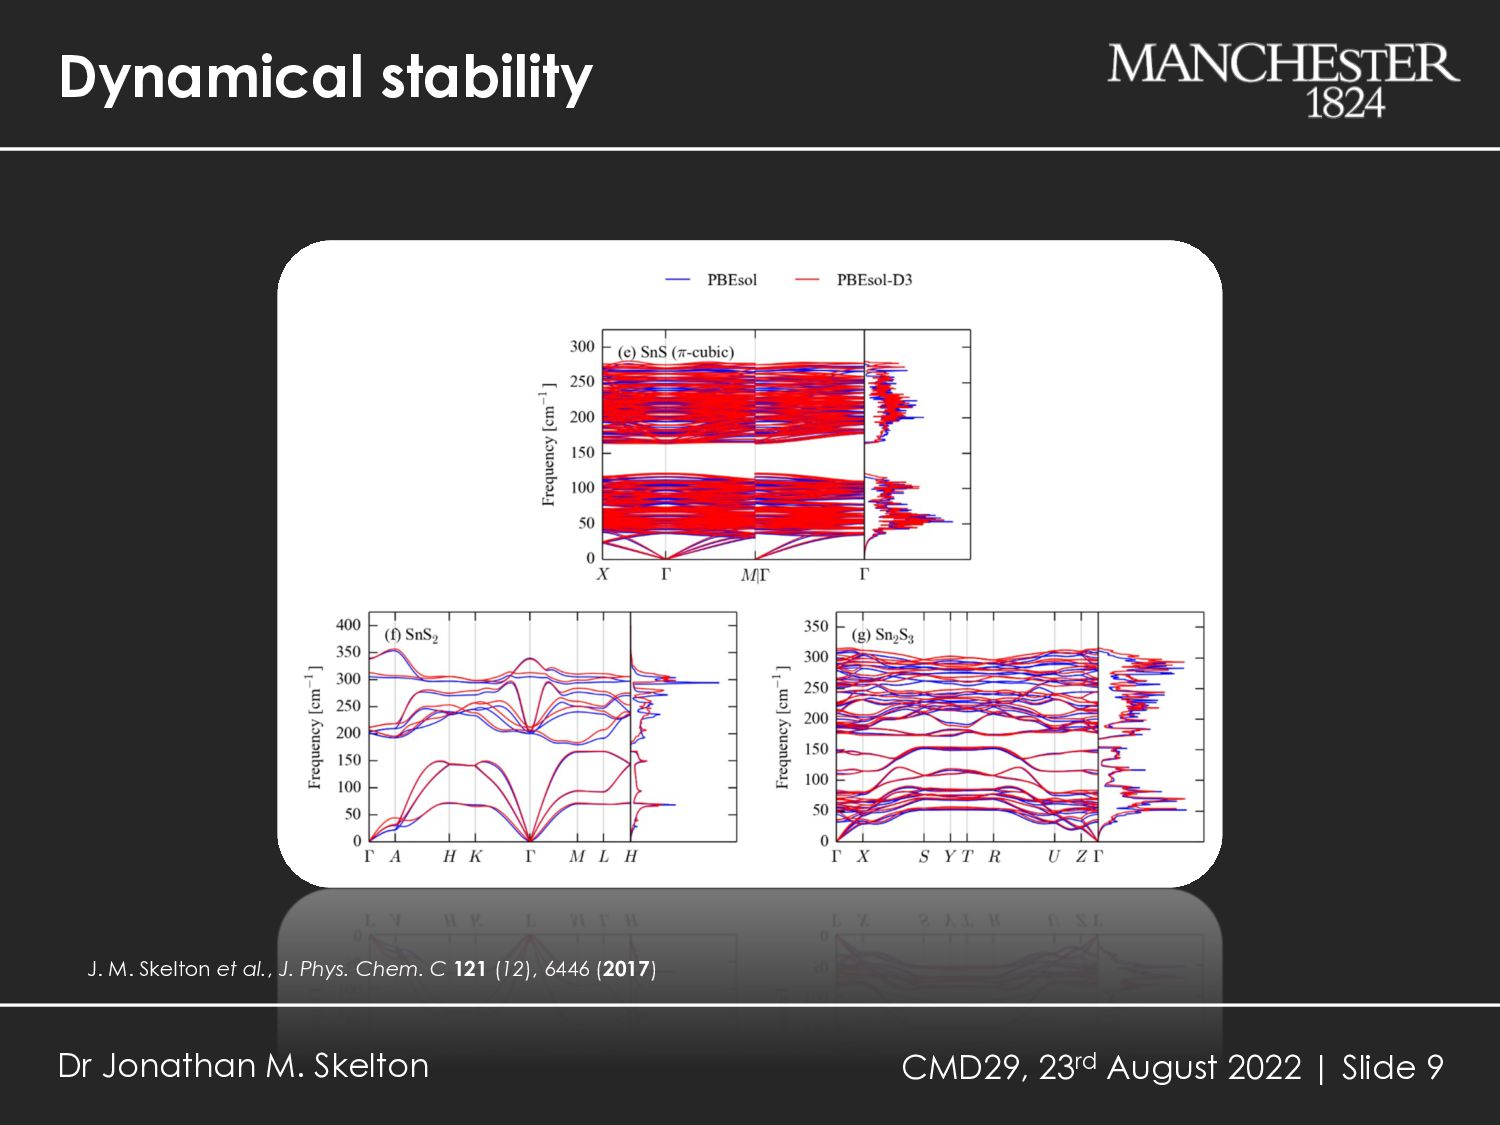
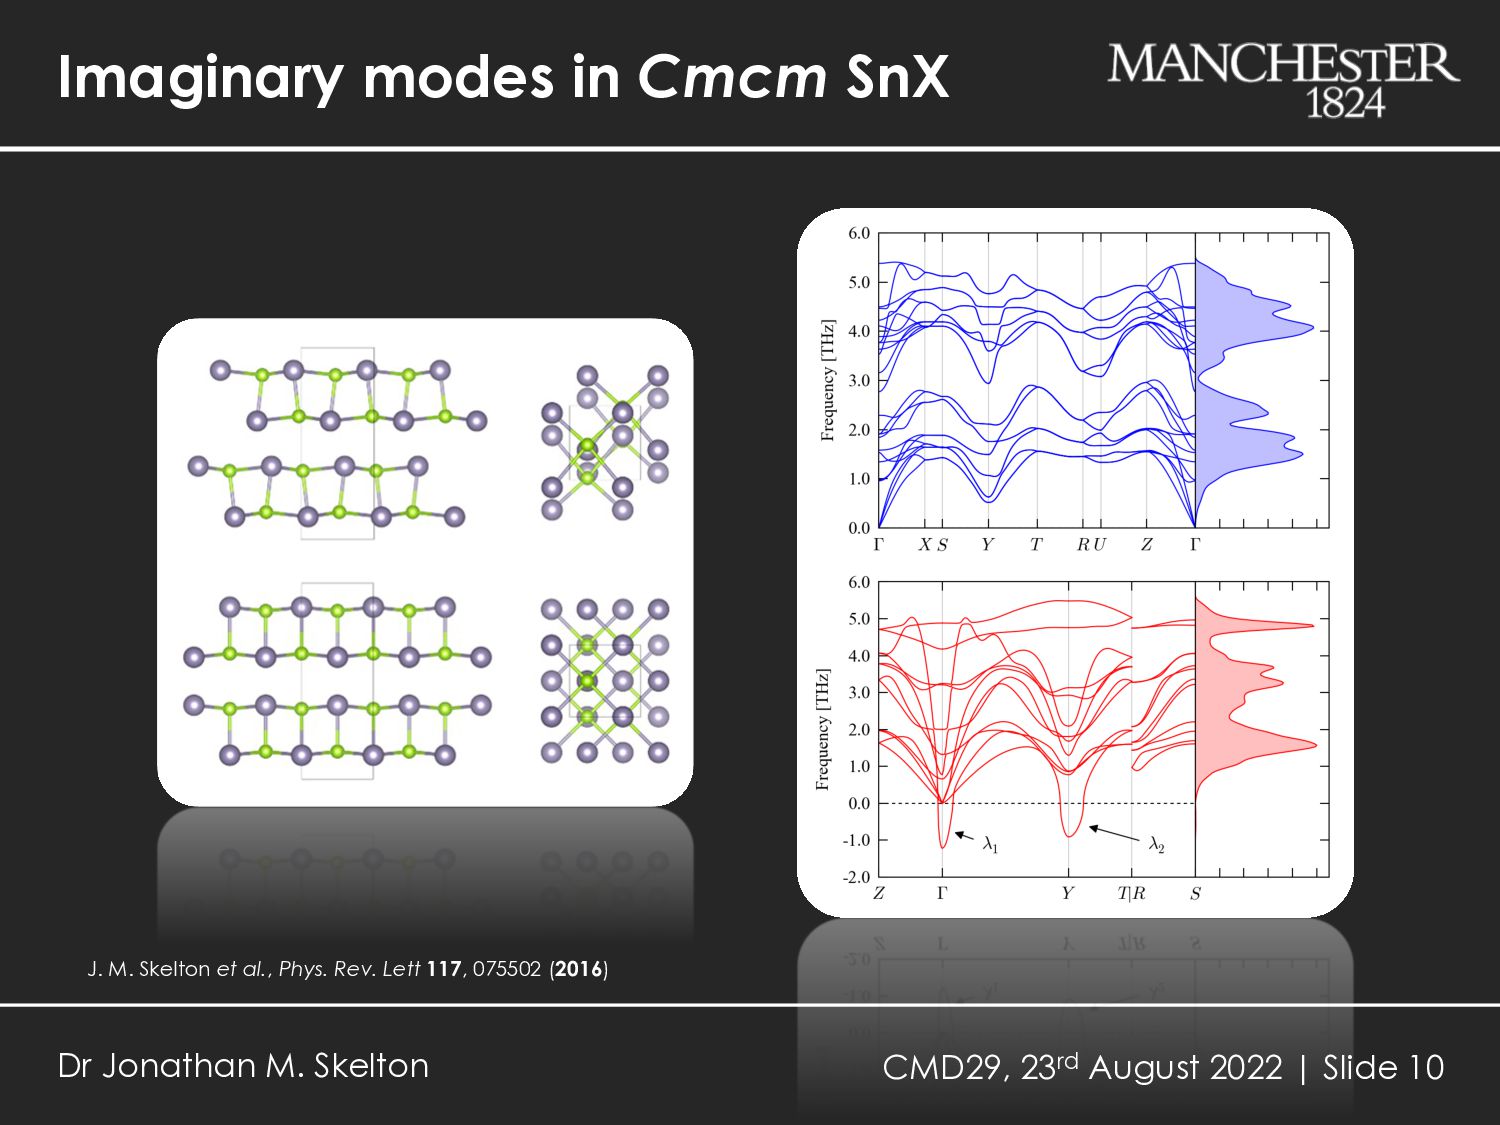
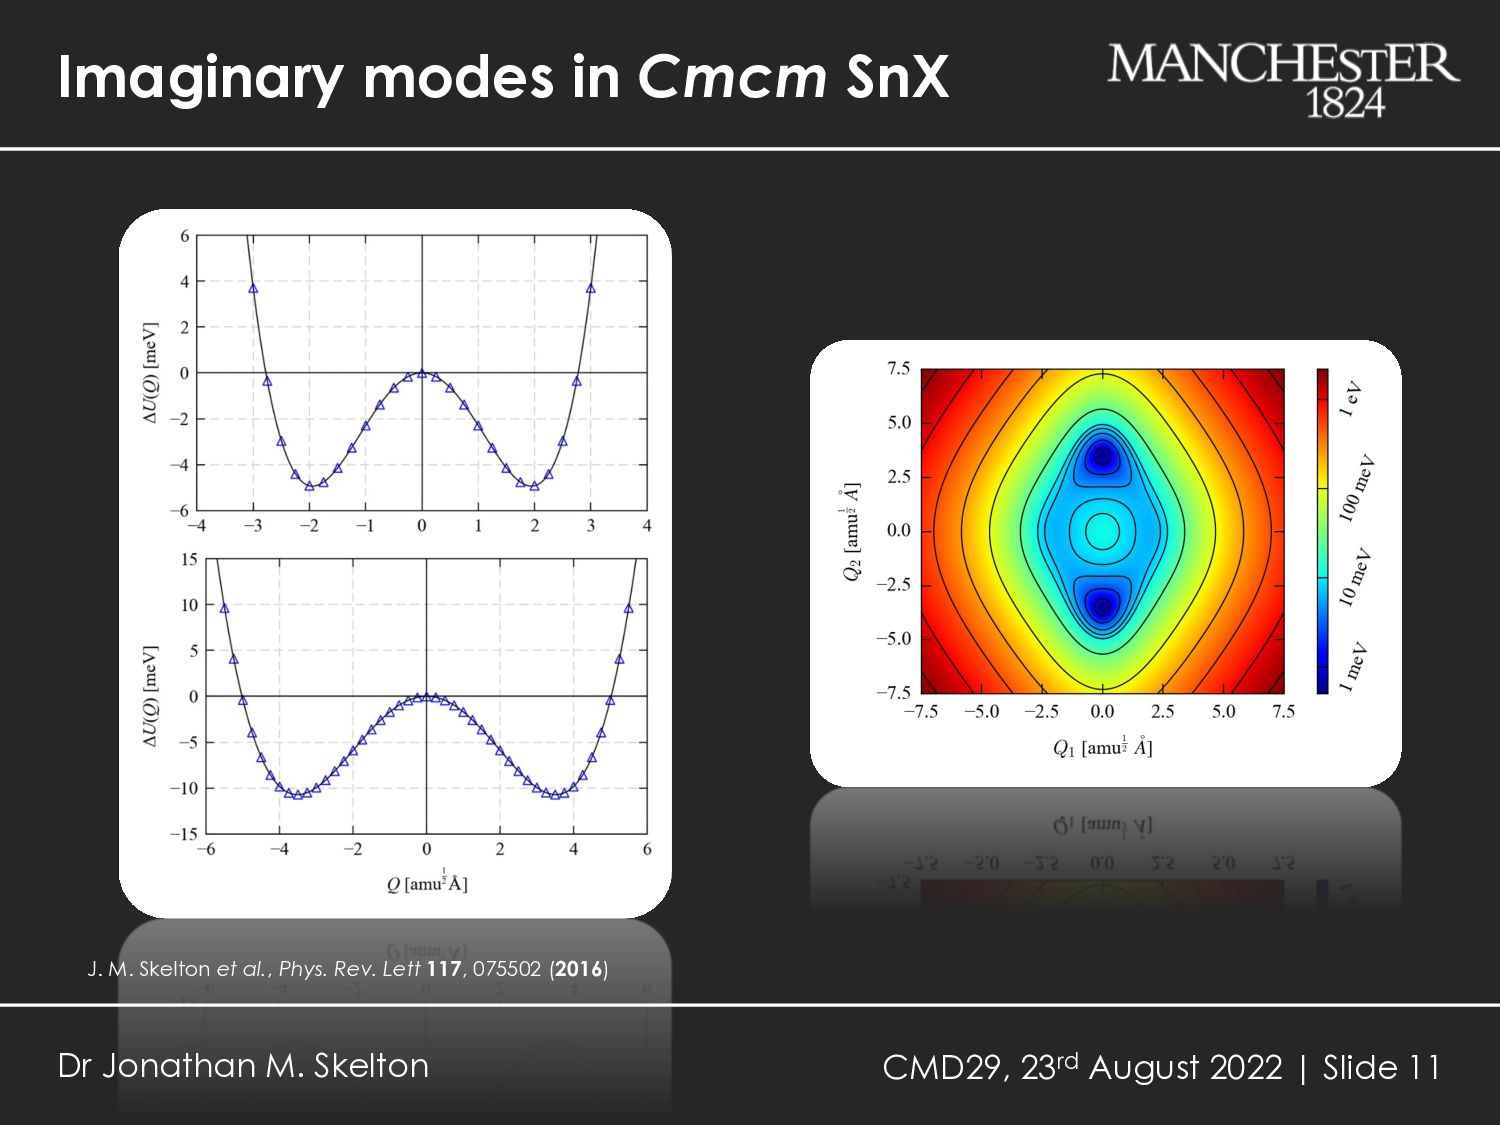
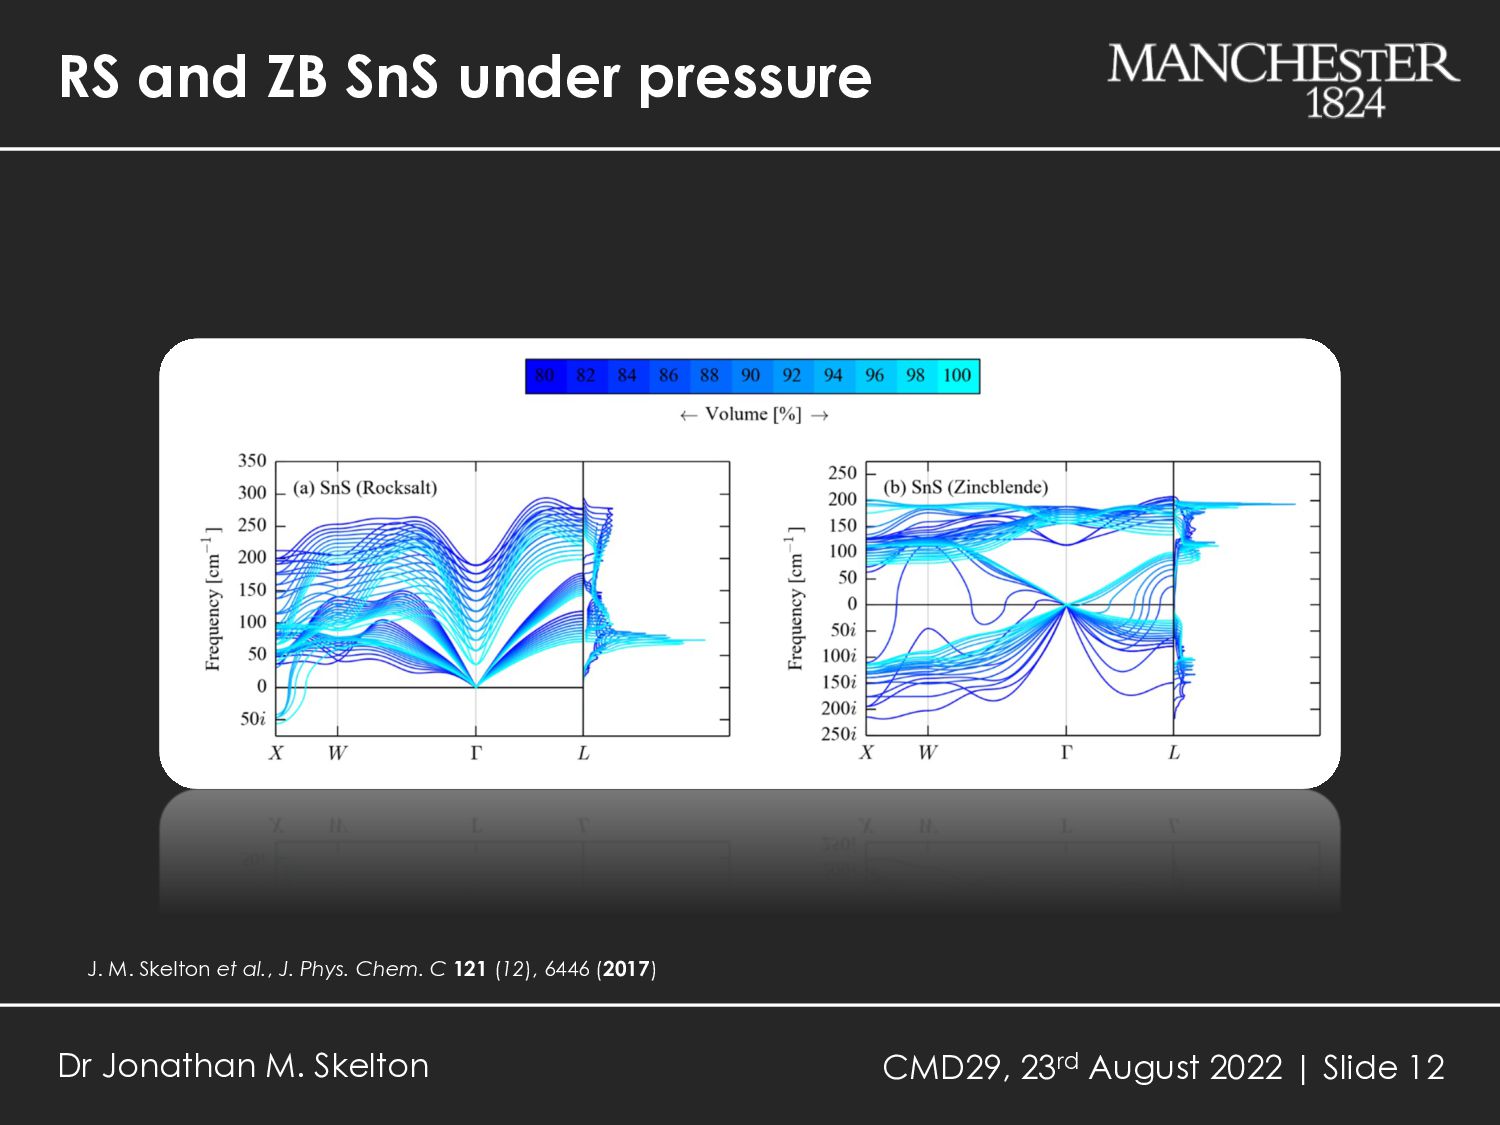
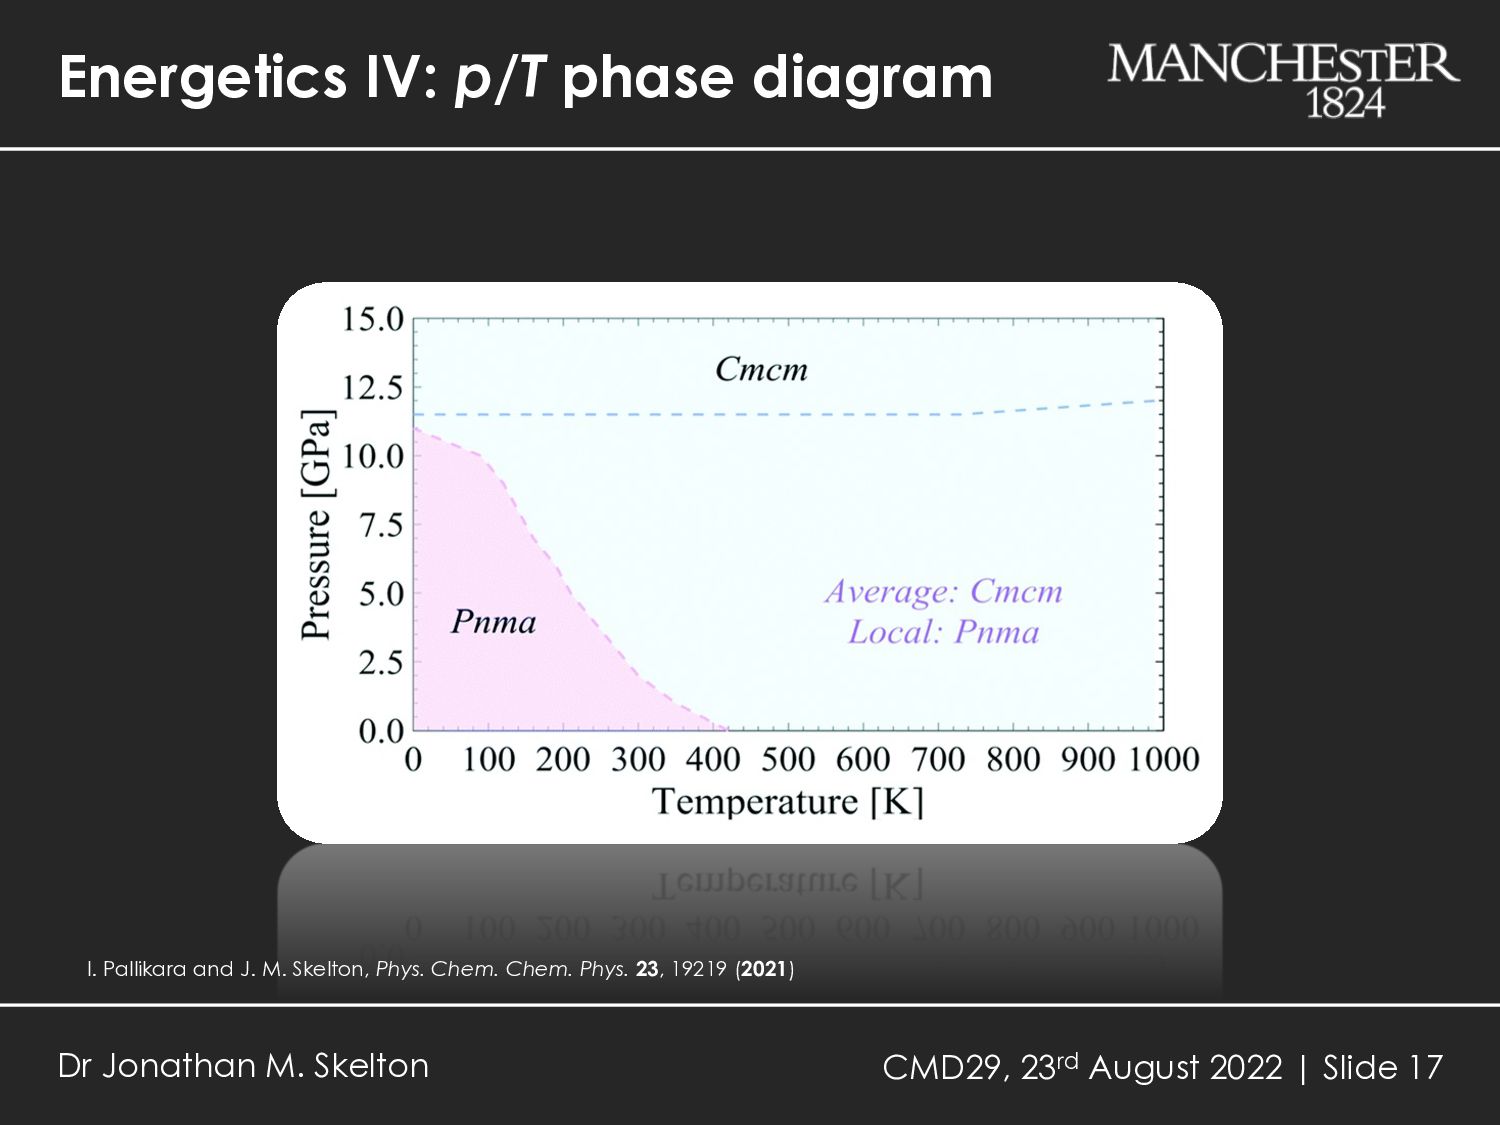
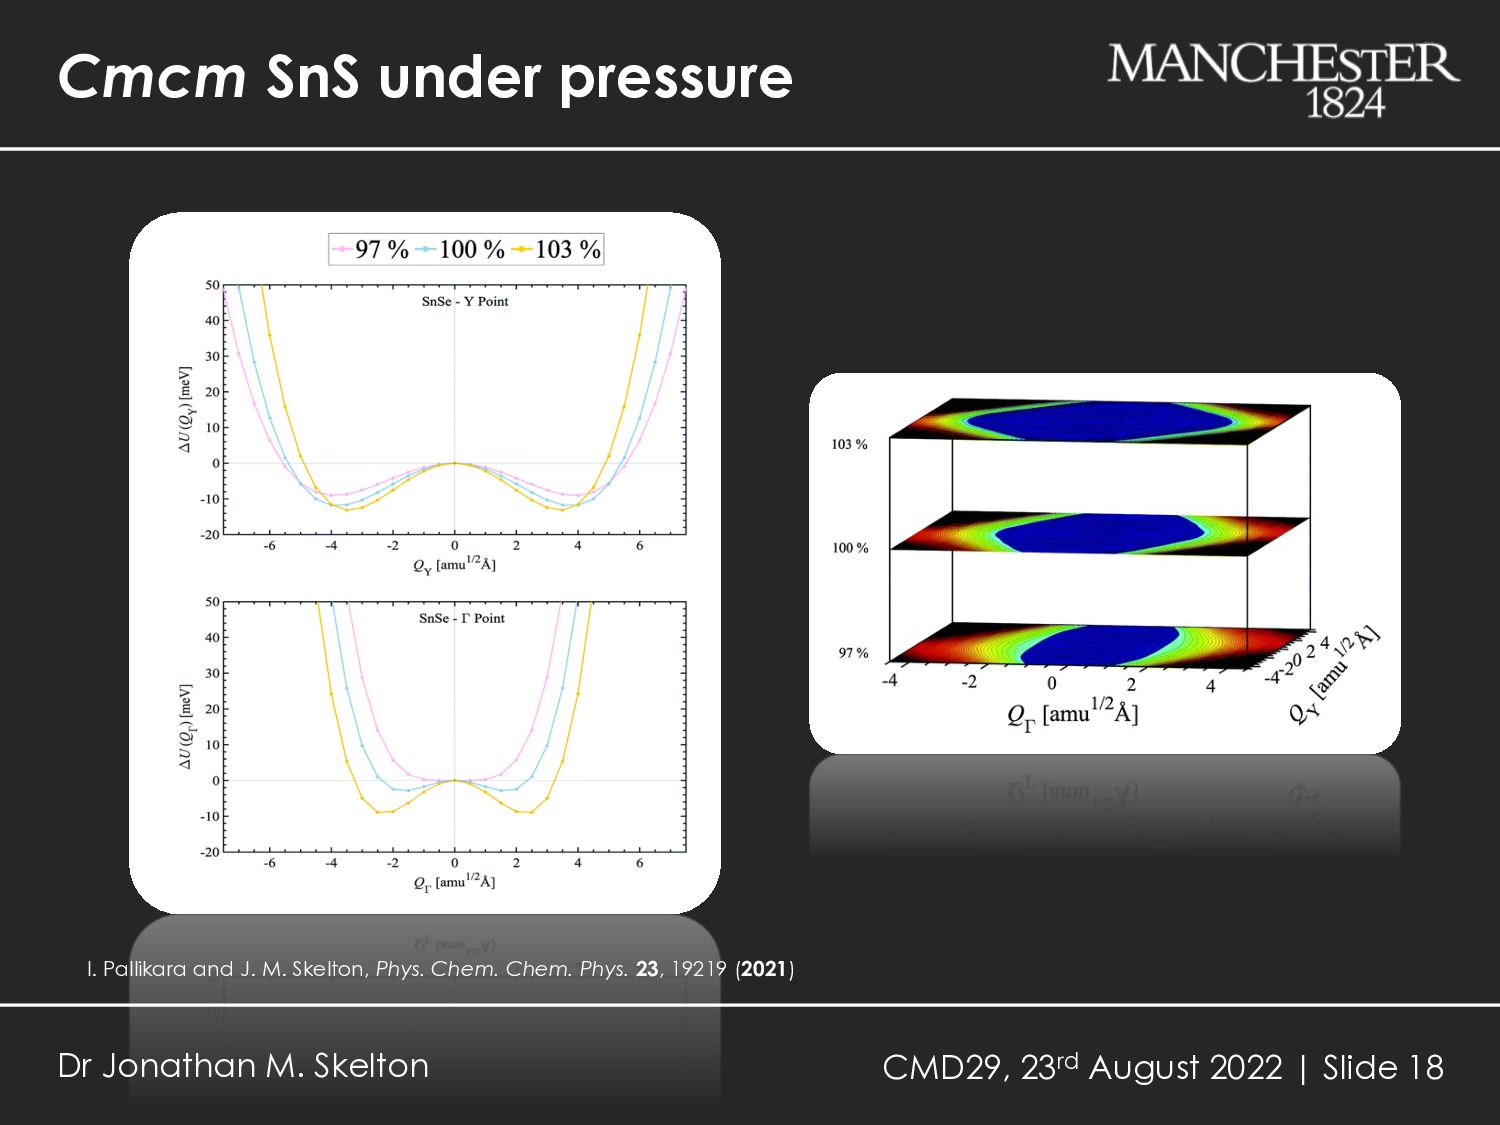
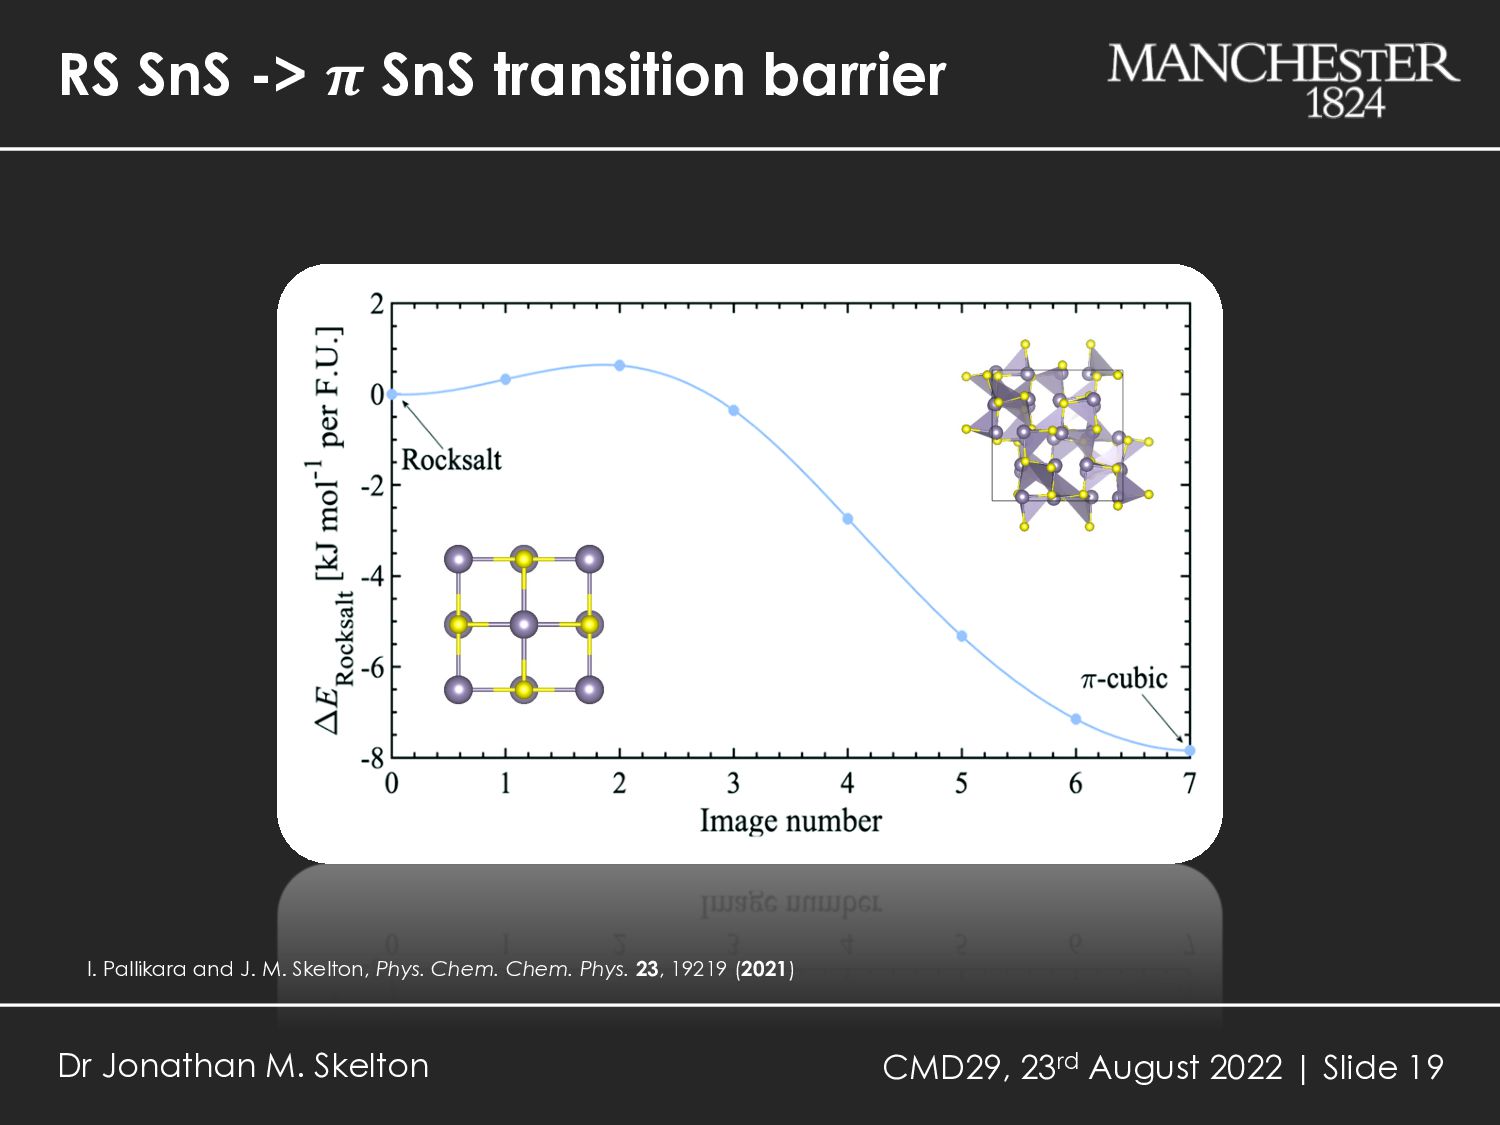
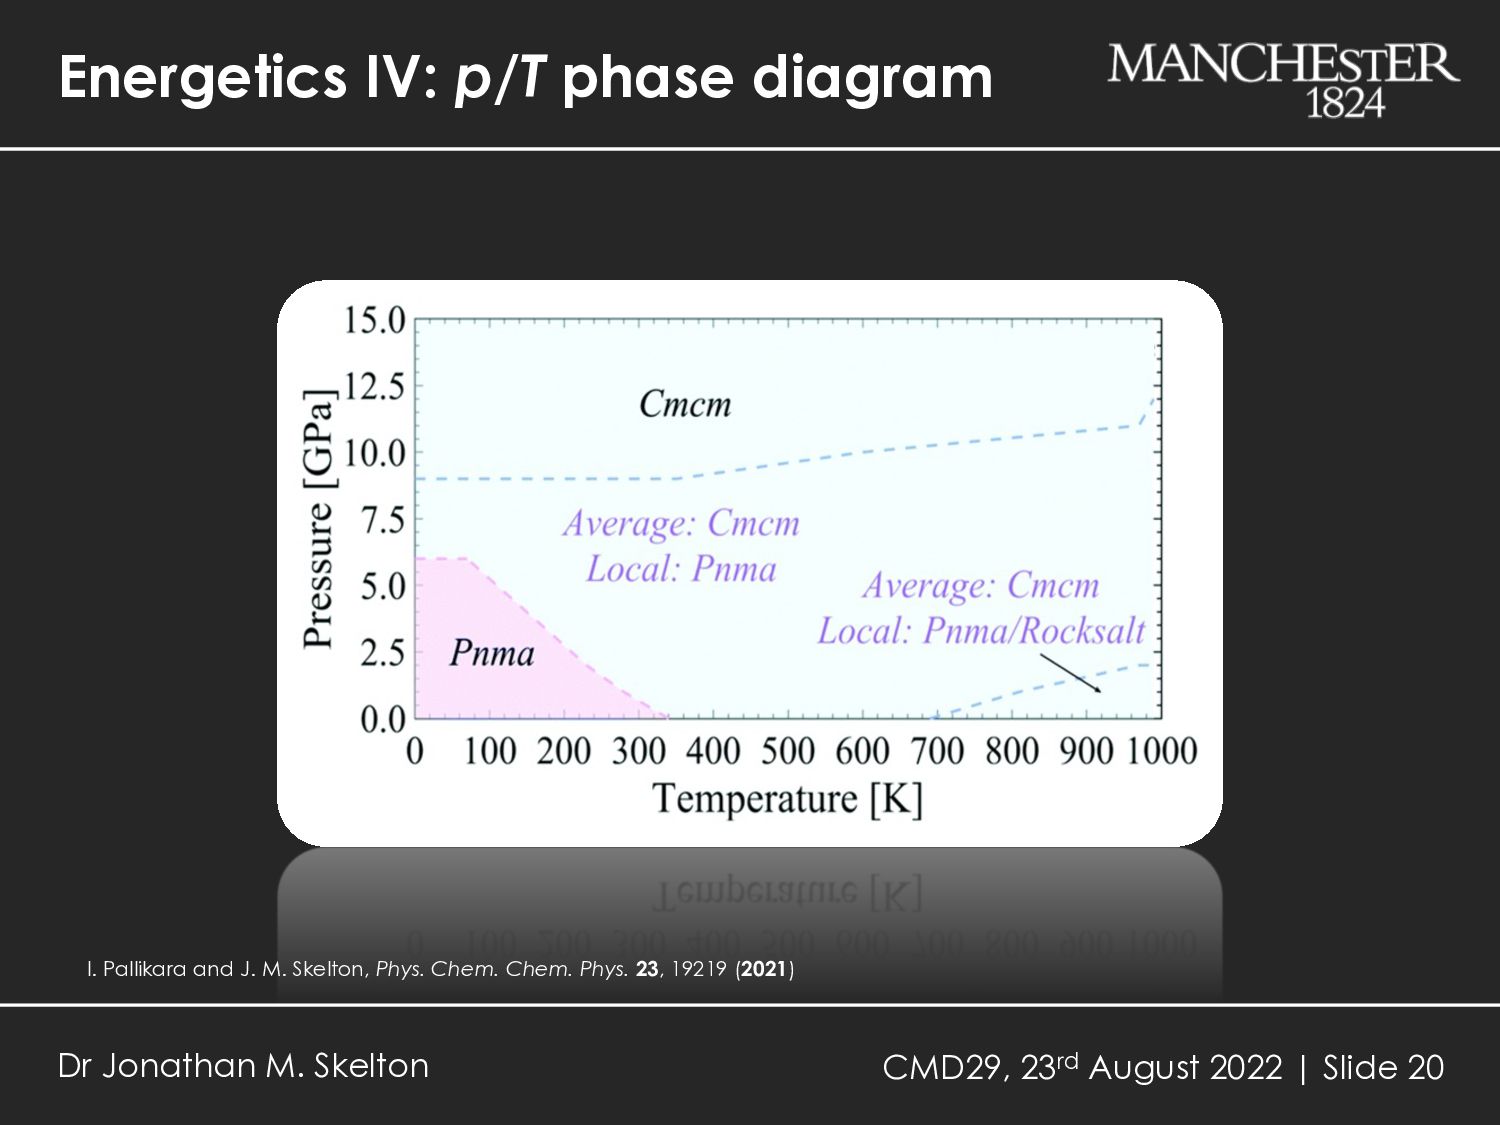
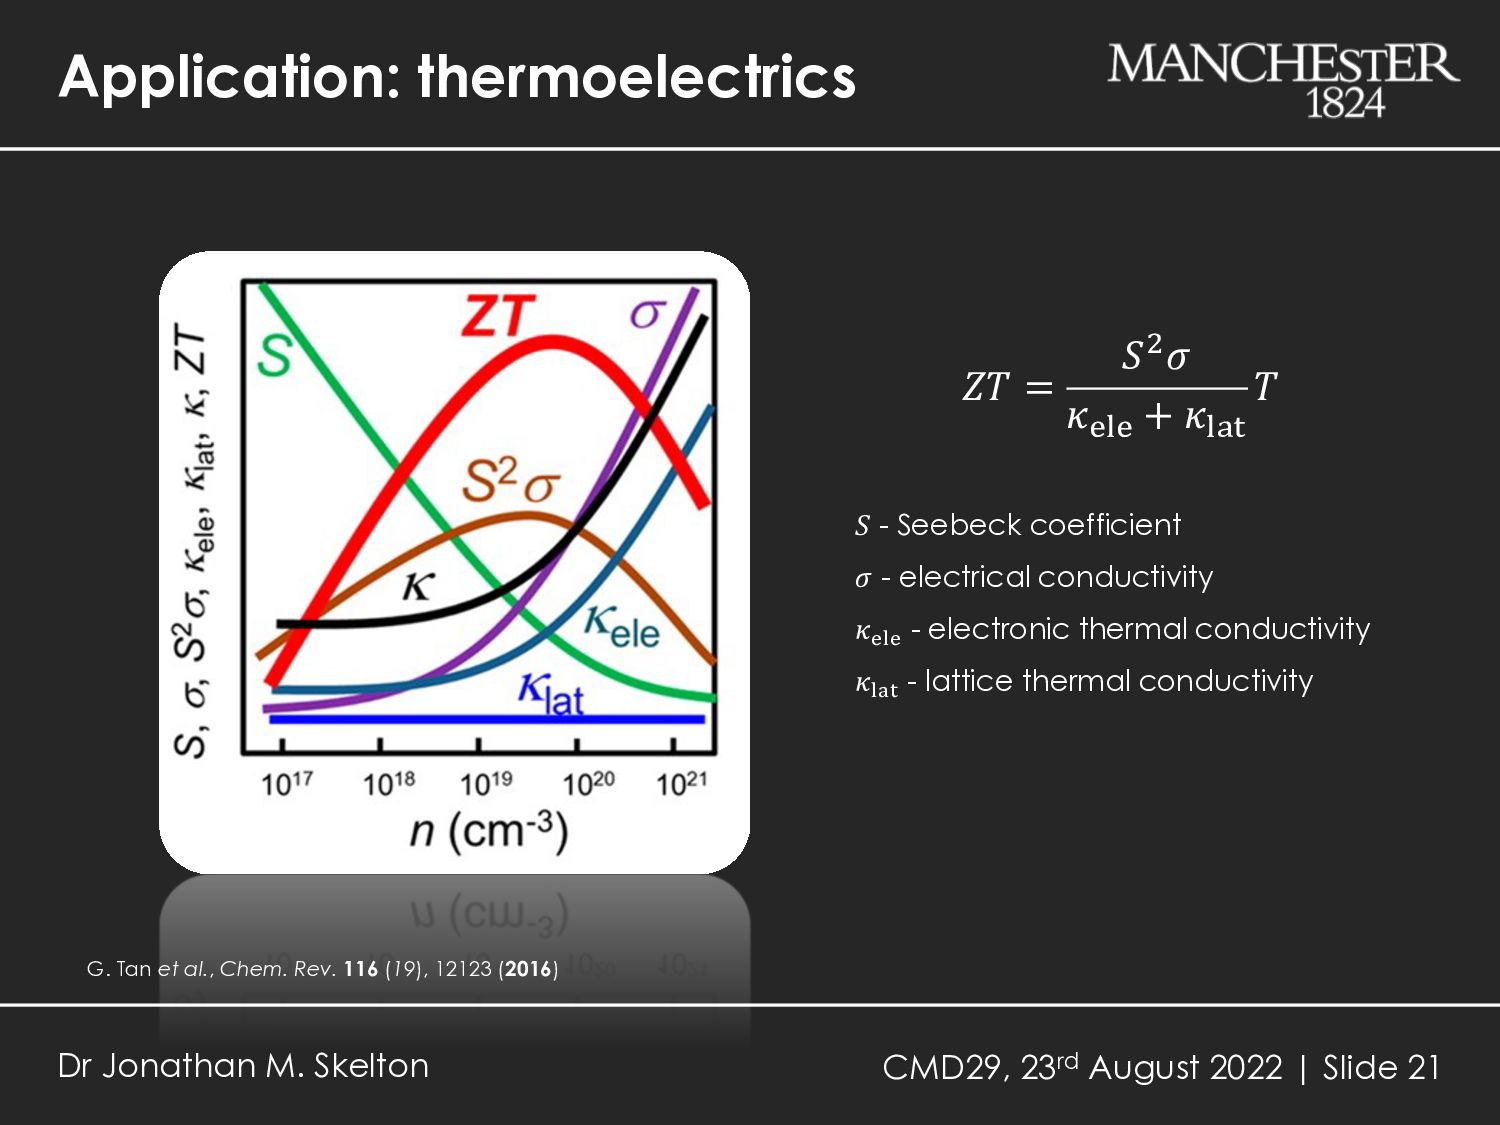
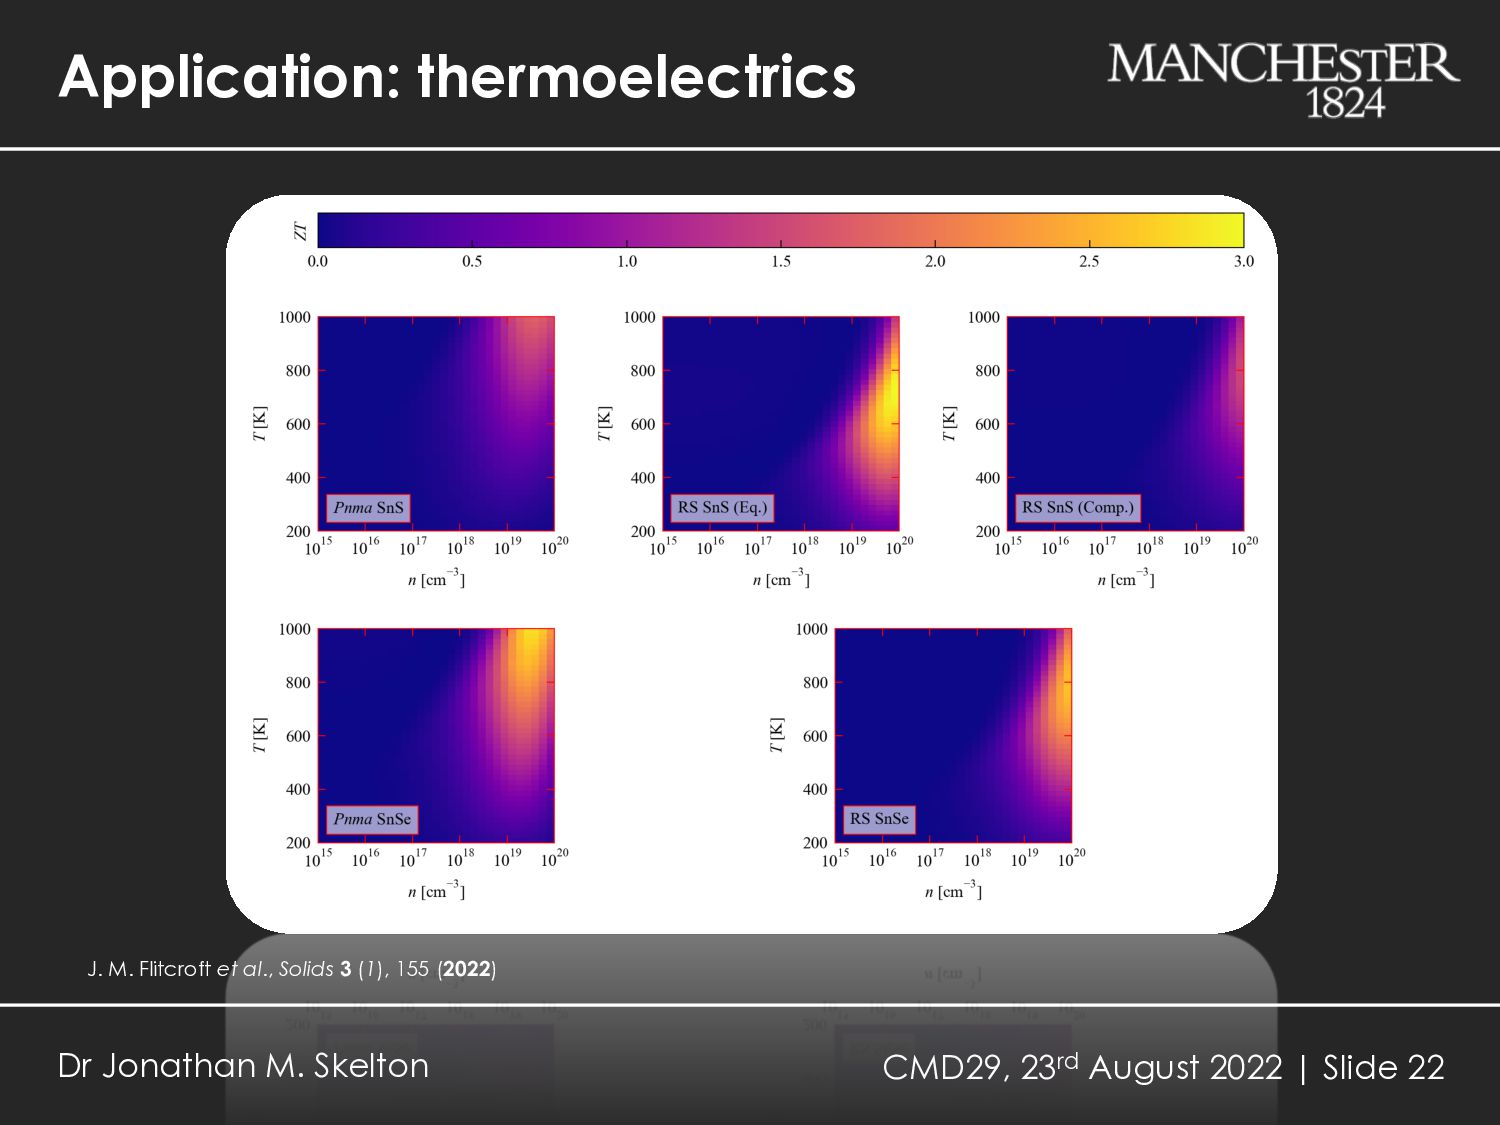
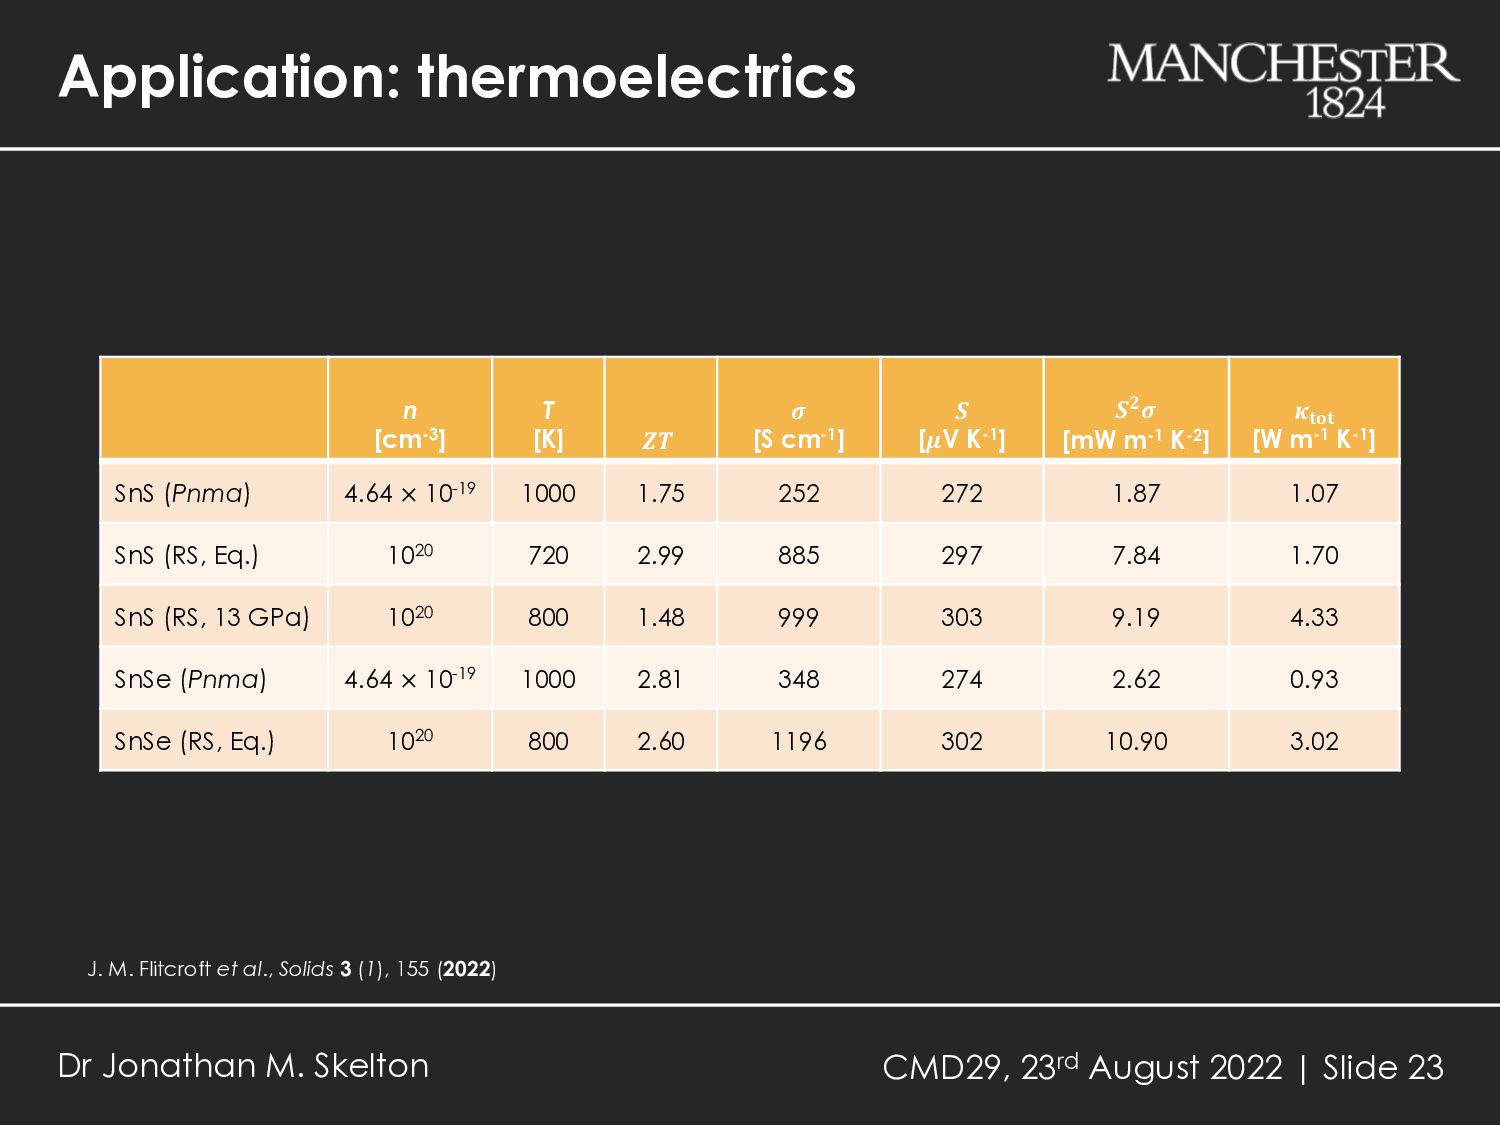
M. Skelton The tin sulphides Snx Sy have a rich phase space with five known or proposed SnS phases plus SnS2 and Sn2 S3 Helmholtz and Gibbs free energy calculations using the HA/QHA predict the observed soft-mode phase transition between the Pnma and Cmcm phases Both RS and ZB SnS are dynamically unstable, but RS SnS can be stabilised under compression e.g. by epitaxial growth Sn2 S3 is predicted to be unstable with respect to disproportionation based on its lattice energy, but is stabilised at finite temperature by vibrational entropy The QHA 𝑝/𝑇 phase diagram of SnS features only the Pnma and Cmcm phases; pressure shifts the Pnma ↔ Cmcm transition to lower 𝑇, and above ~11-12 GPa the Cmcm phase becomes both energetically and dynamically stable If synthetically accessible, the RS phase of SnS has the potential to show superior thermoelectric properties to the Pnma phase