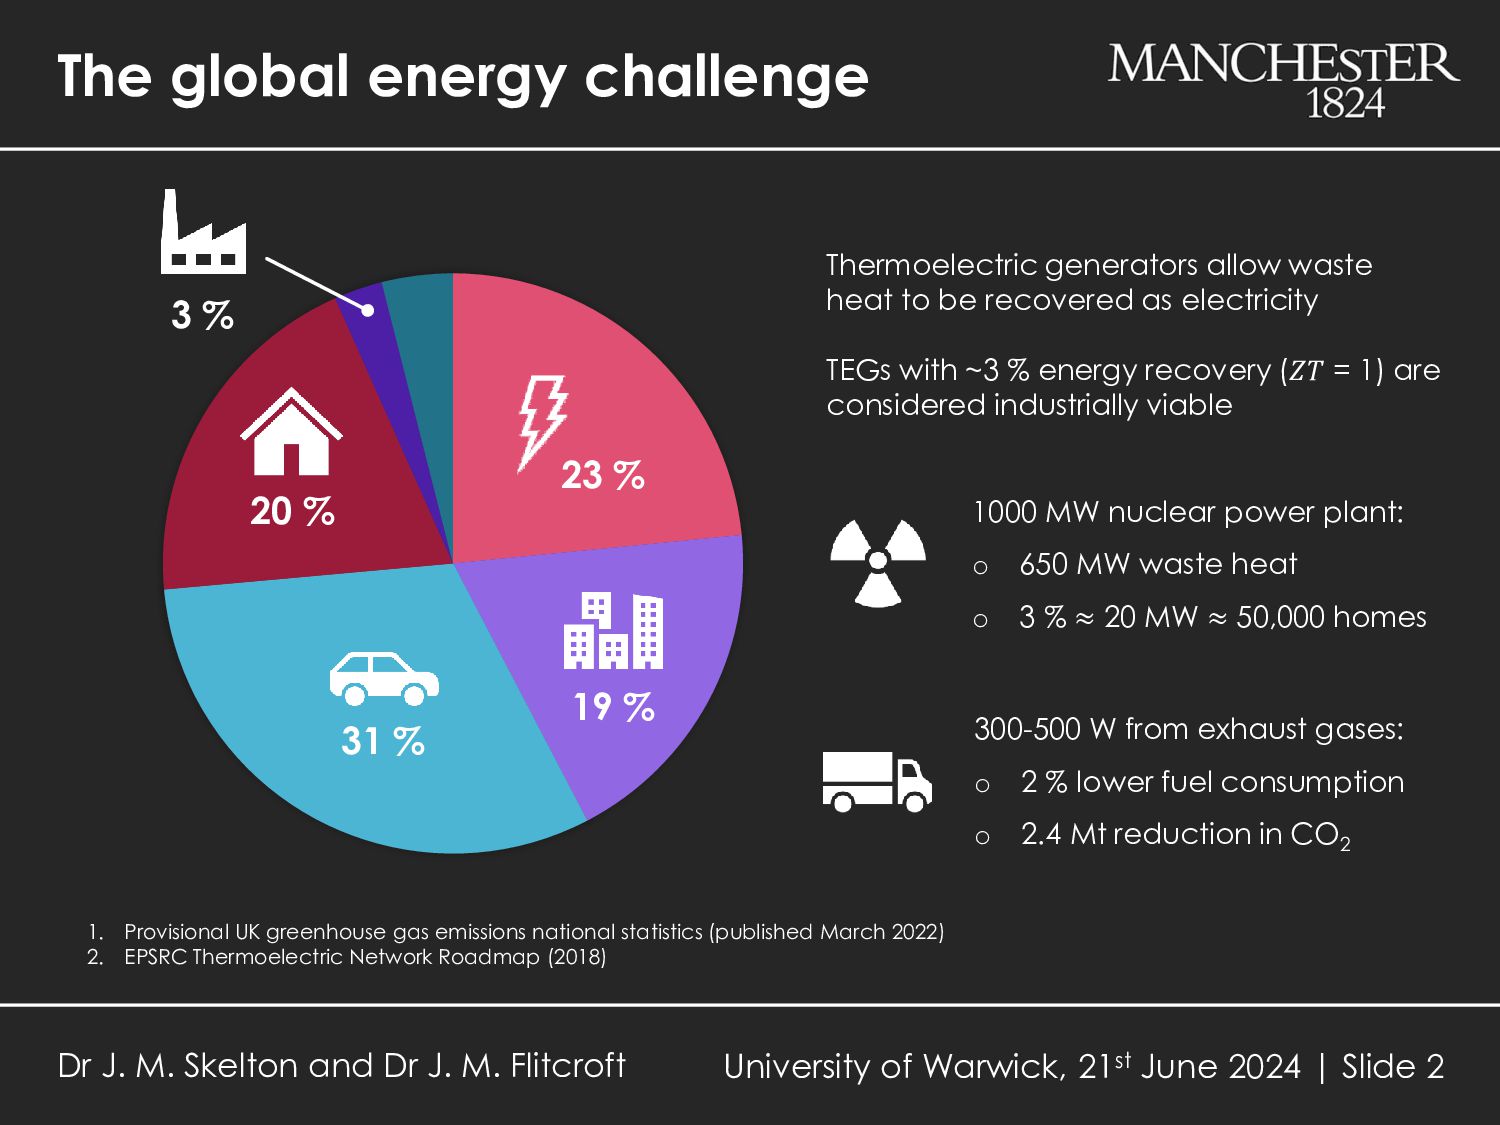
19 % 3 % 1000 MW nuclear power plant: o 650 MW waste heat o 3 % ≈ 20 MW ≈ 50,000 homes 300-500 W from exhaust gases: o 2 % lower fuel consumption o 2.4 Mt reduction in CO2 Thermoelectric generators allow waste heat to be recovered as electricity TEGs with ~3 % energy recovery (𝑍𝑇 = 1) are considered industrially viable 1. Provisional UK greenhouse gas emissions national statistics (published March 2022) 2. EPSRC Thermoelectric Network Roadmap (2018) Dr J. M. Skelton and Dr J. M. Flitcroft University of Warwick, 21st June 2024 | Slide 2
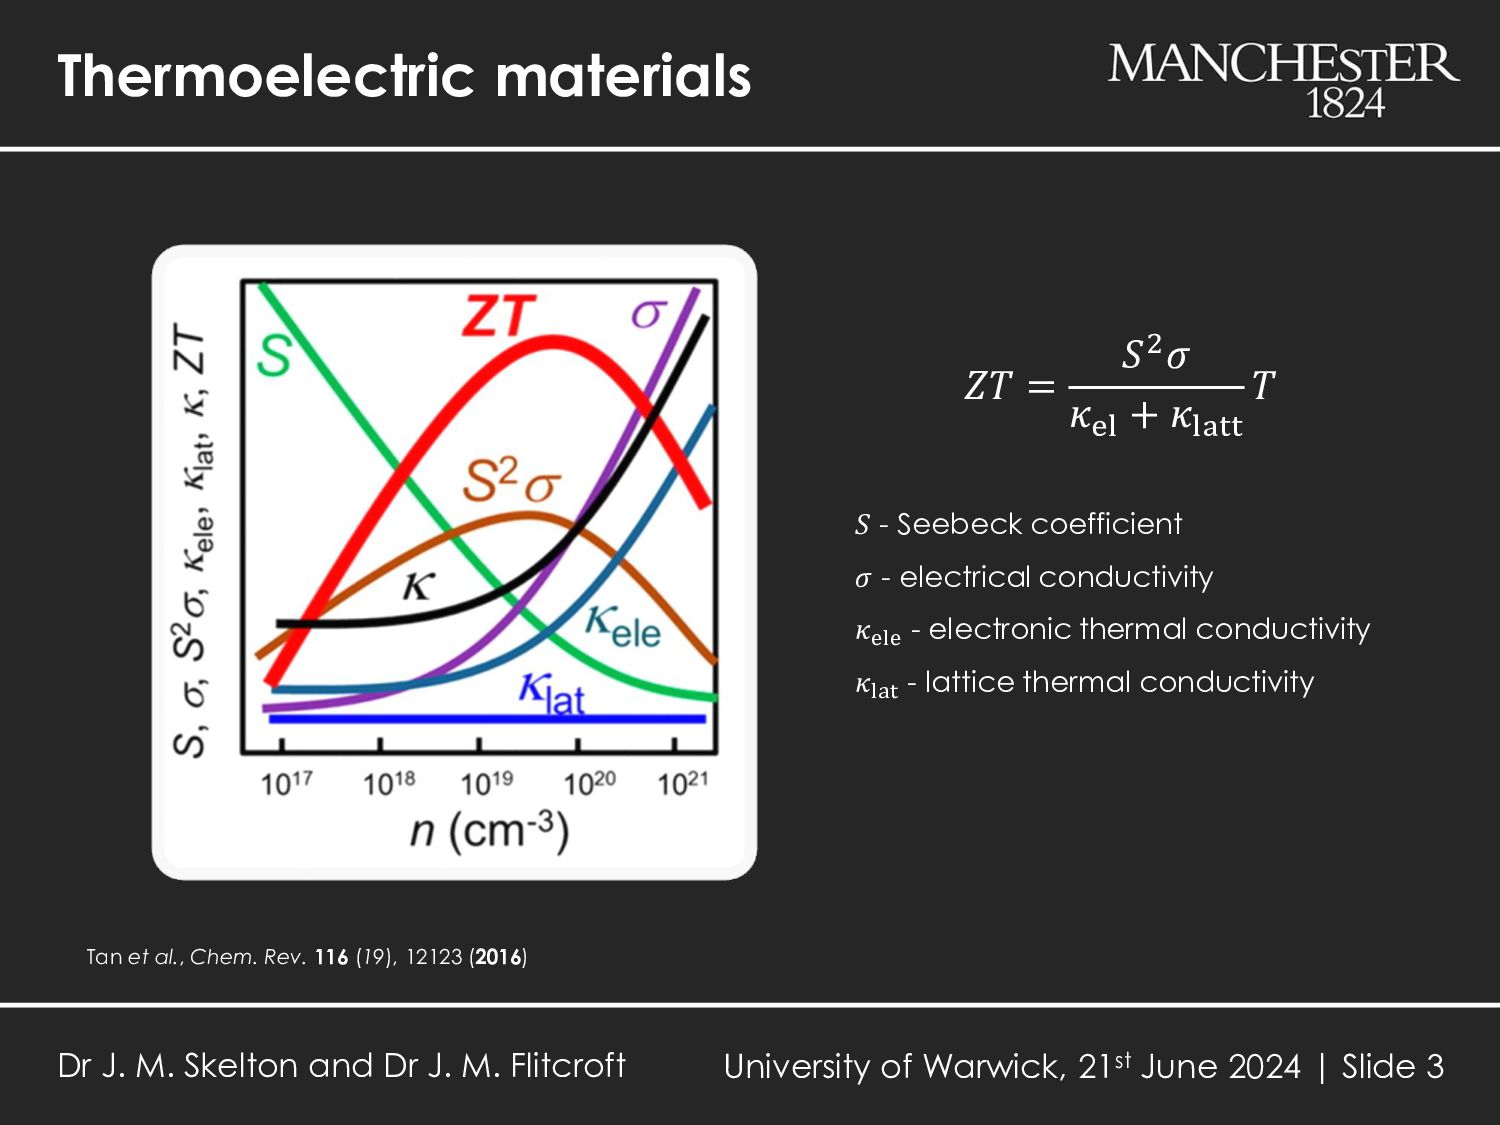
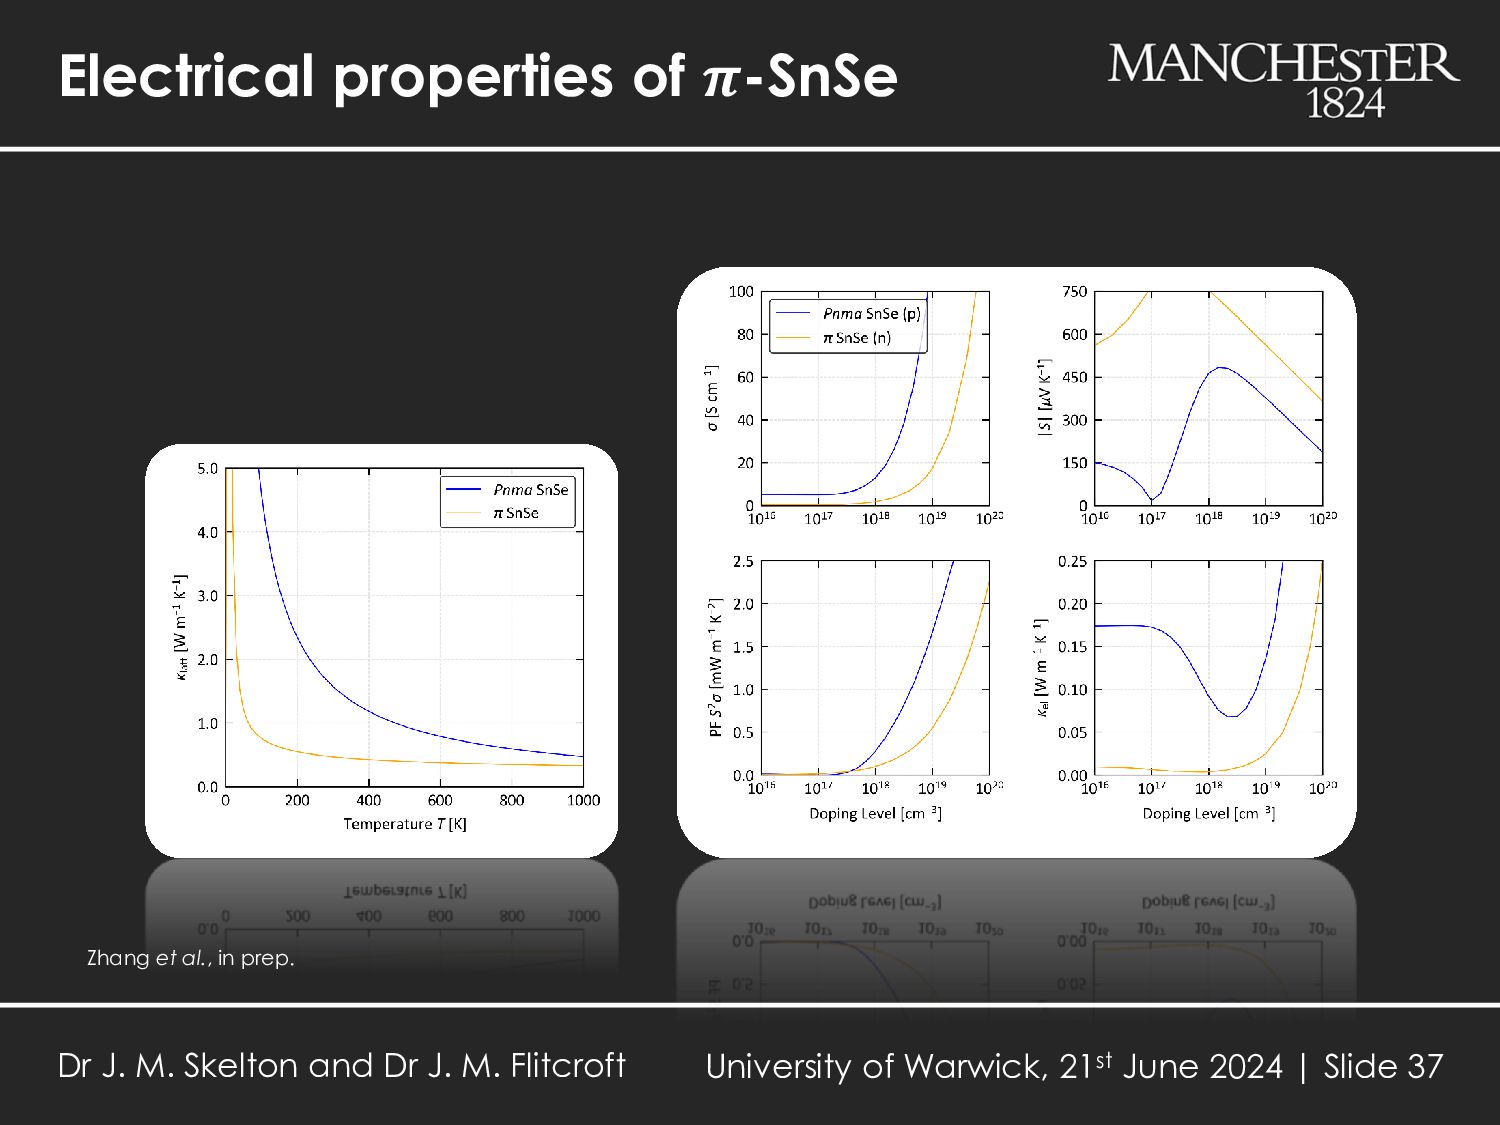
- Seebeck coefficient 𝜎 - electrical conductivity 𝜅ele - electronic thermal conductivity 𝜅lat - lattice thermal conductivity Tan et al., Chem. Rev. 116 (19), 12123 (2016) Dr J. M. Skelton and Dr J. M. Flitcroft University of Warwick, 21st June 2024 | Slide 3
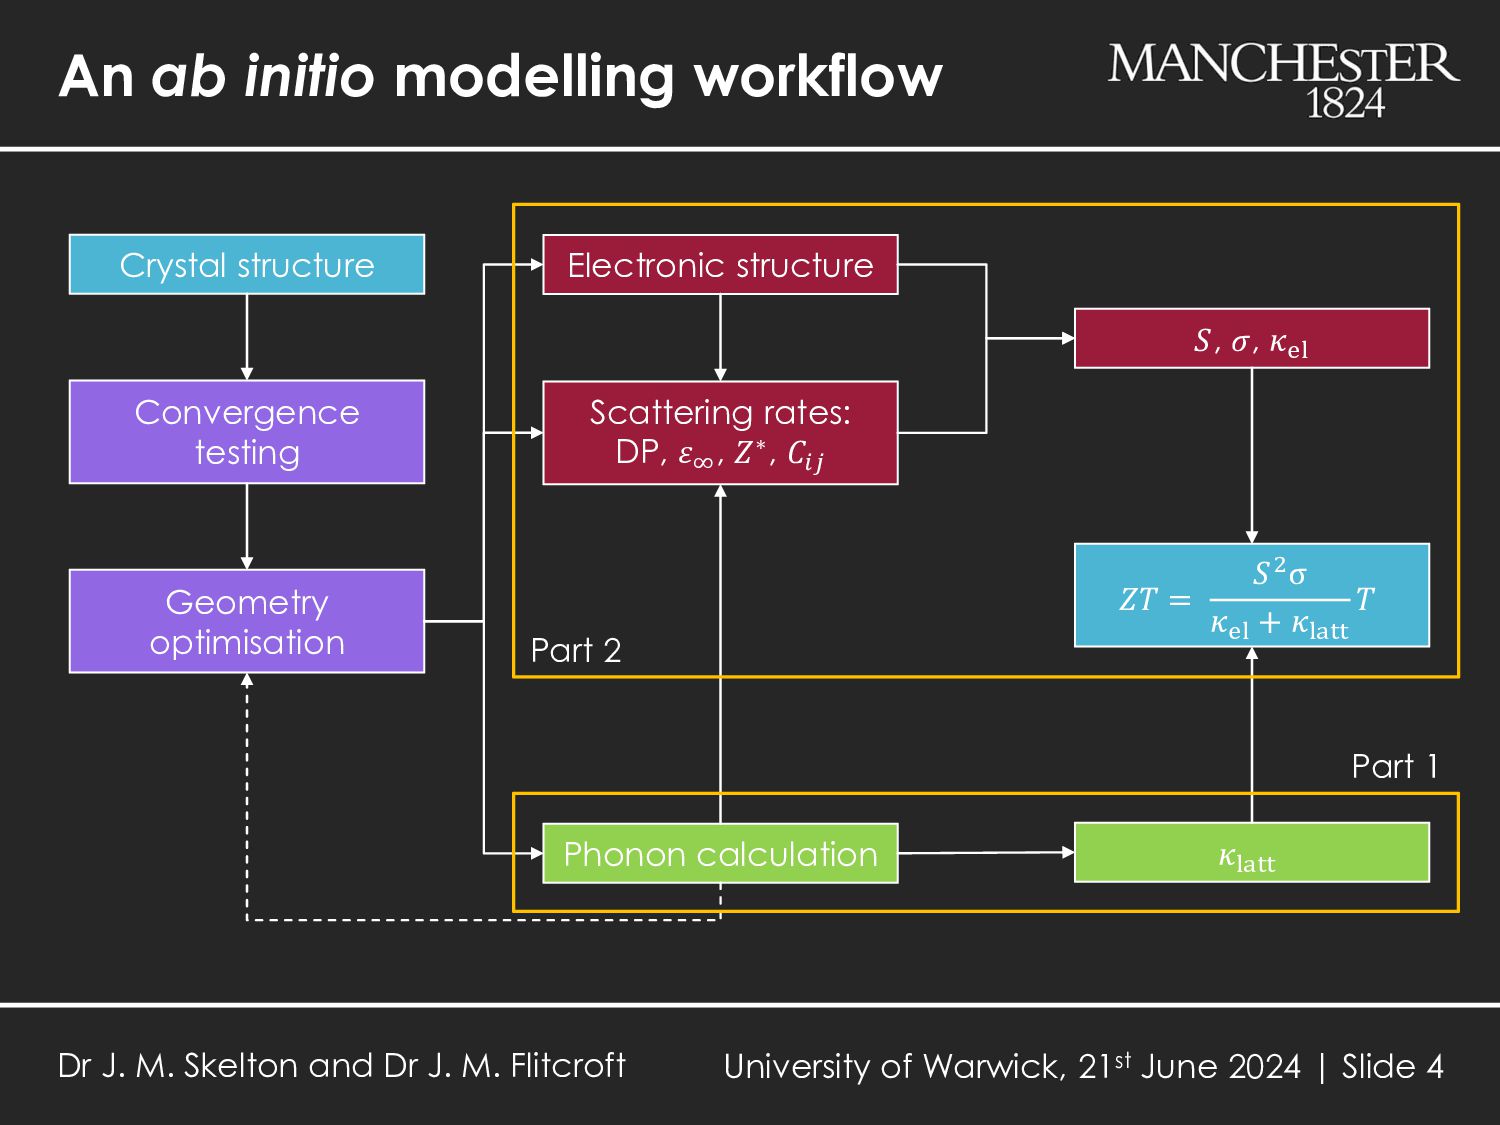
optimisation Phonon calculation 𝜅latt Electronic structure 𝑆, 𝜎, 𝜅el 𝑍𝑇 = 𝑆2σ 𝜅el + 𝜅latt 𝑇 Scattering rates: DP, 𝜀∞ , 𝑍∗, 𝐶𝑖𝑗 Part 2 Part 1 Dr J. M. Skelton and Dr J. M. Flitcroft University of Warwick, 21st June 2024 | Slide 4
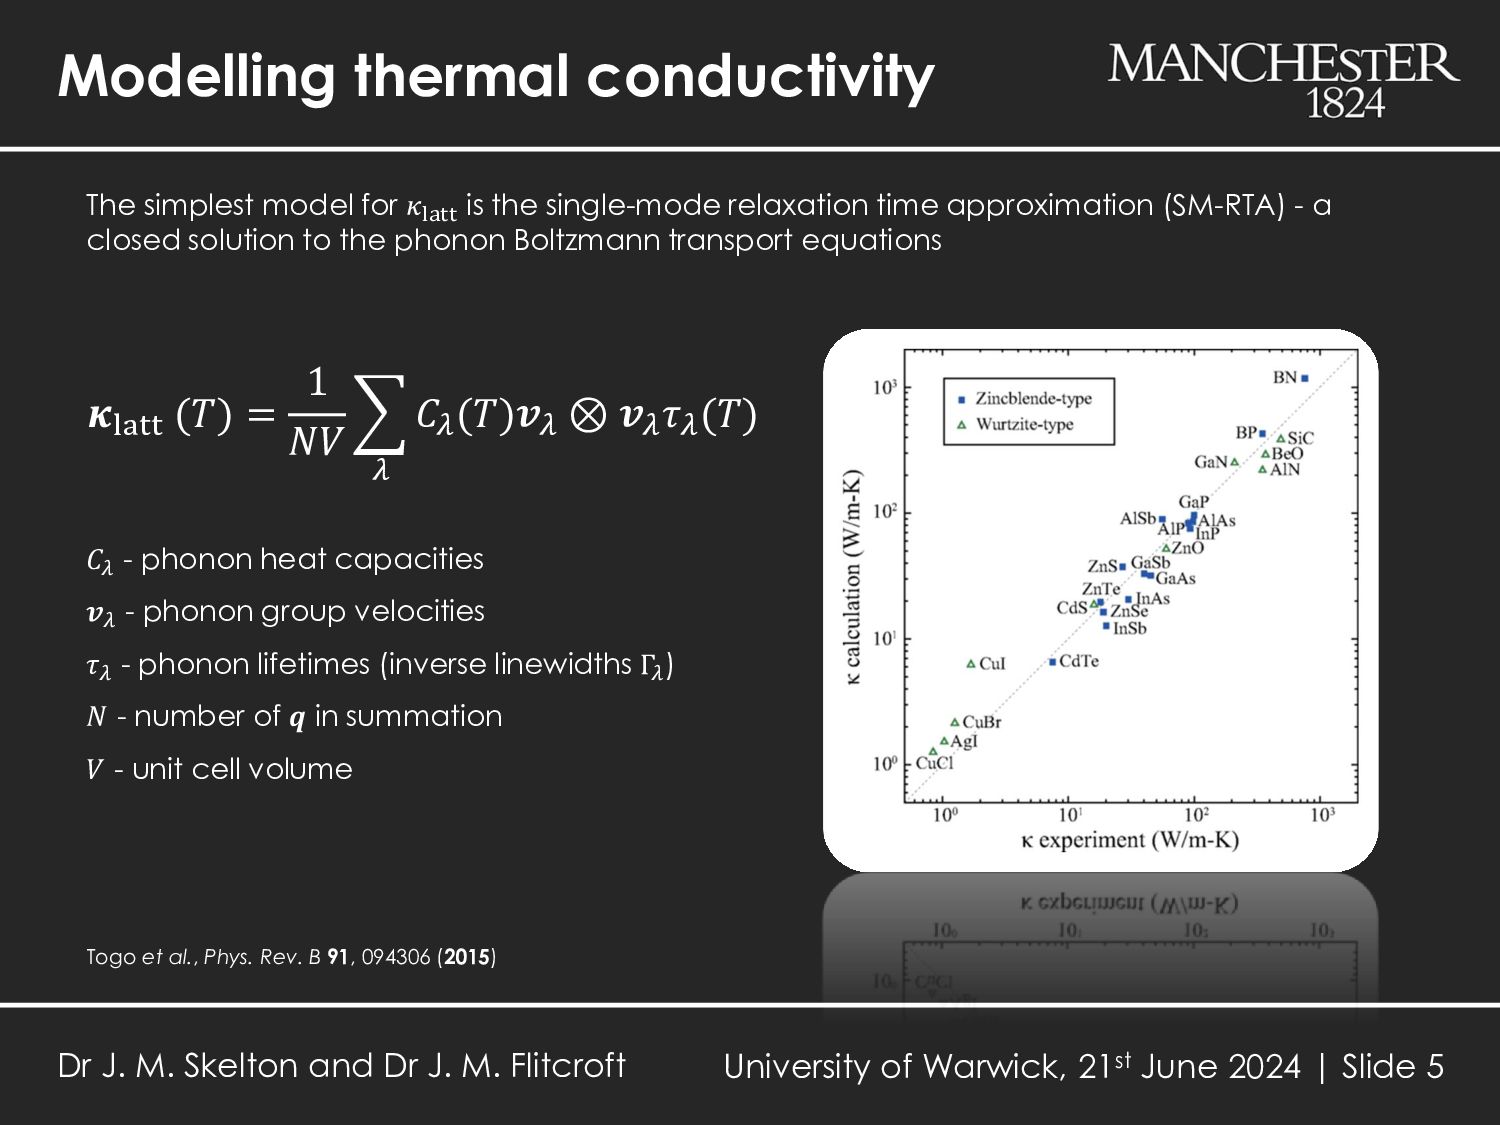
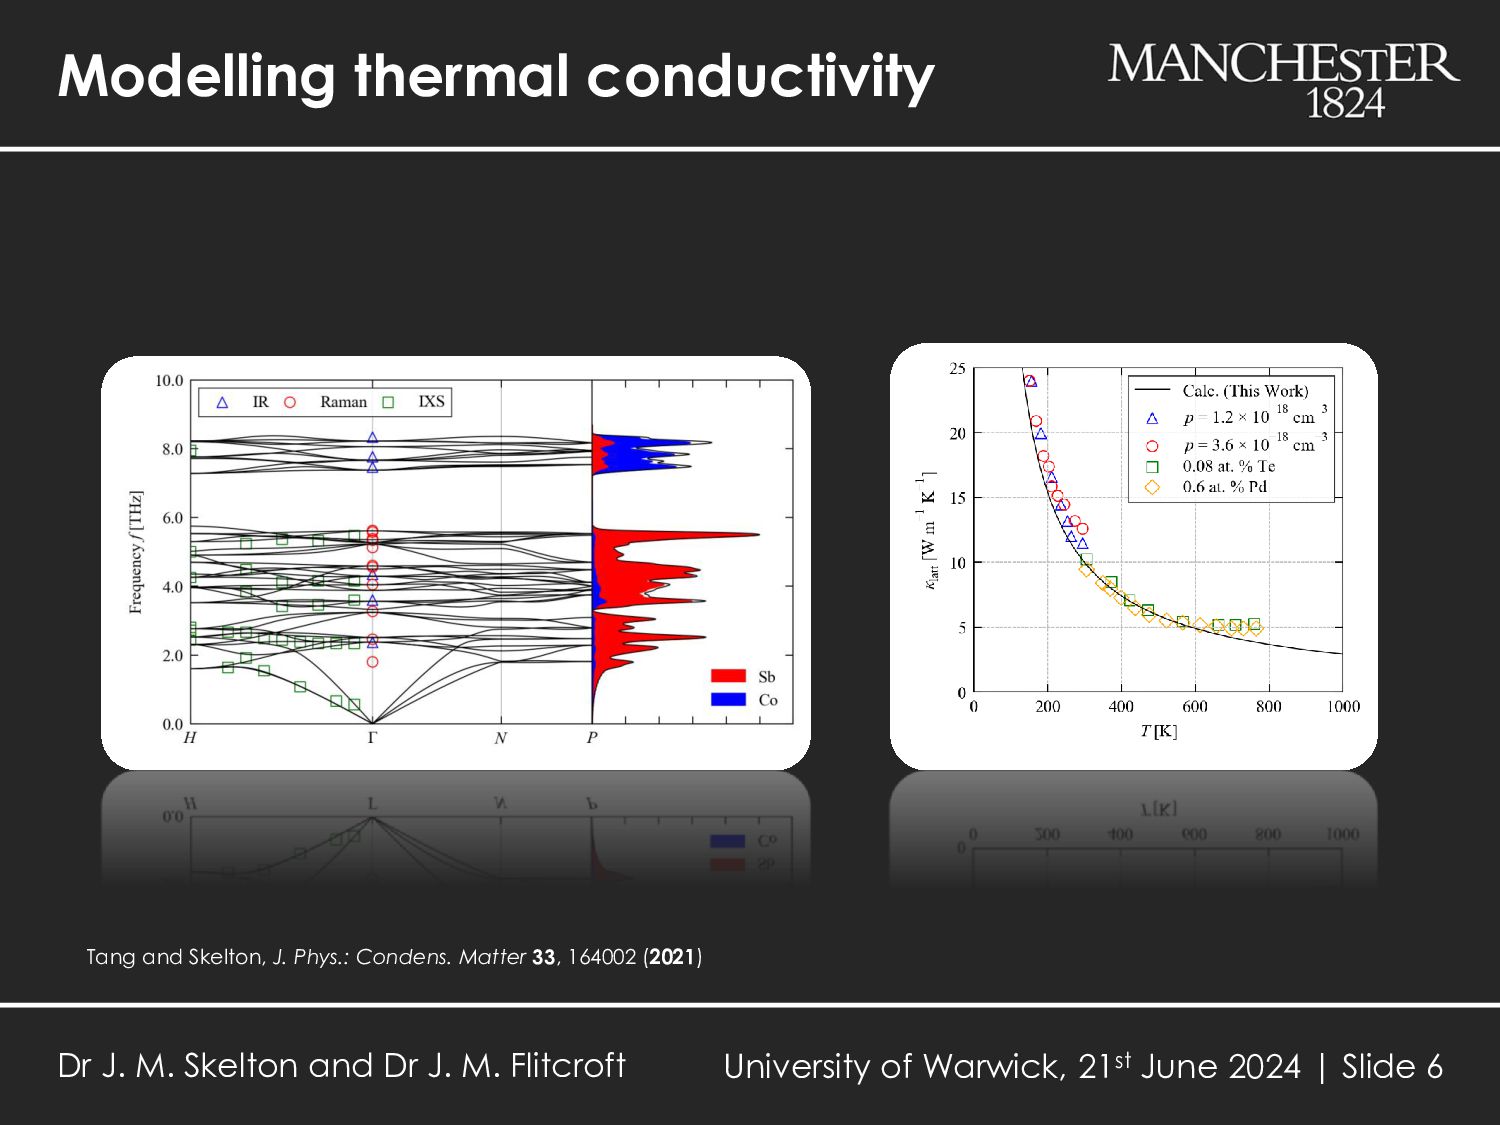
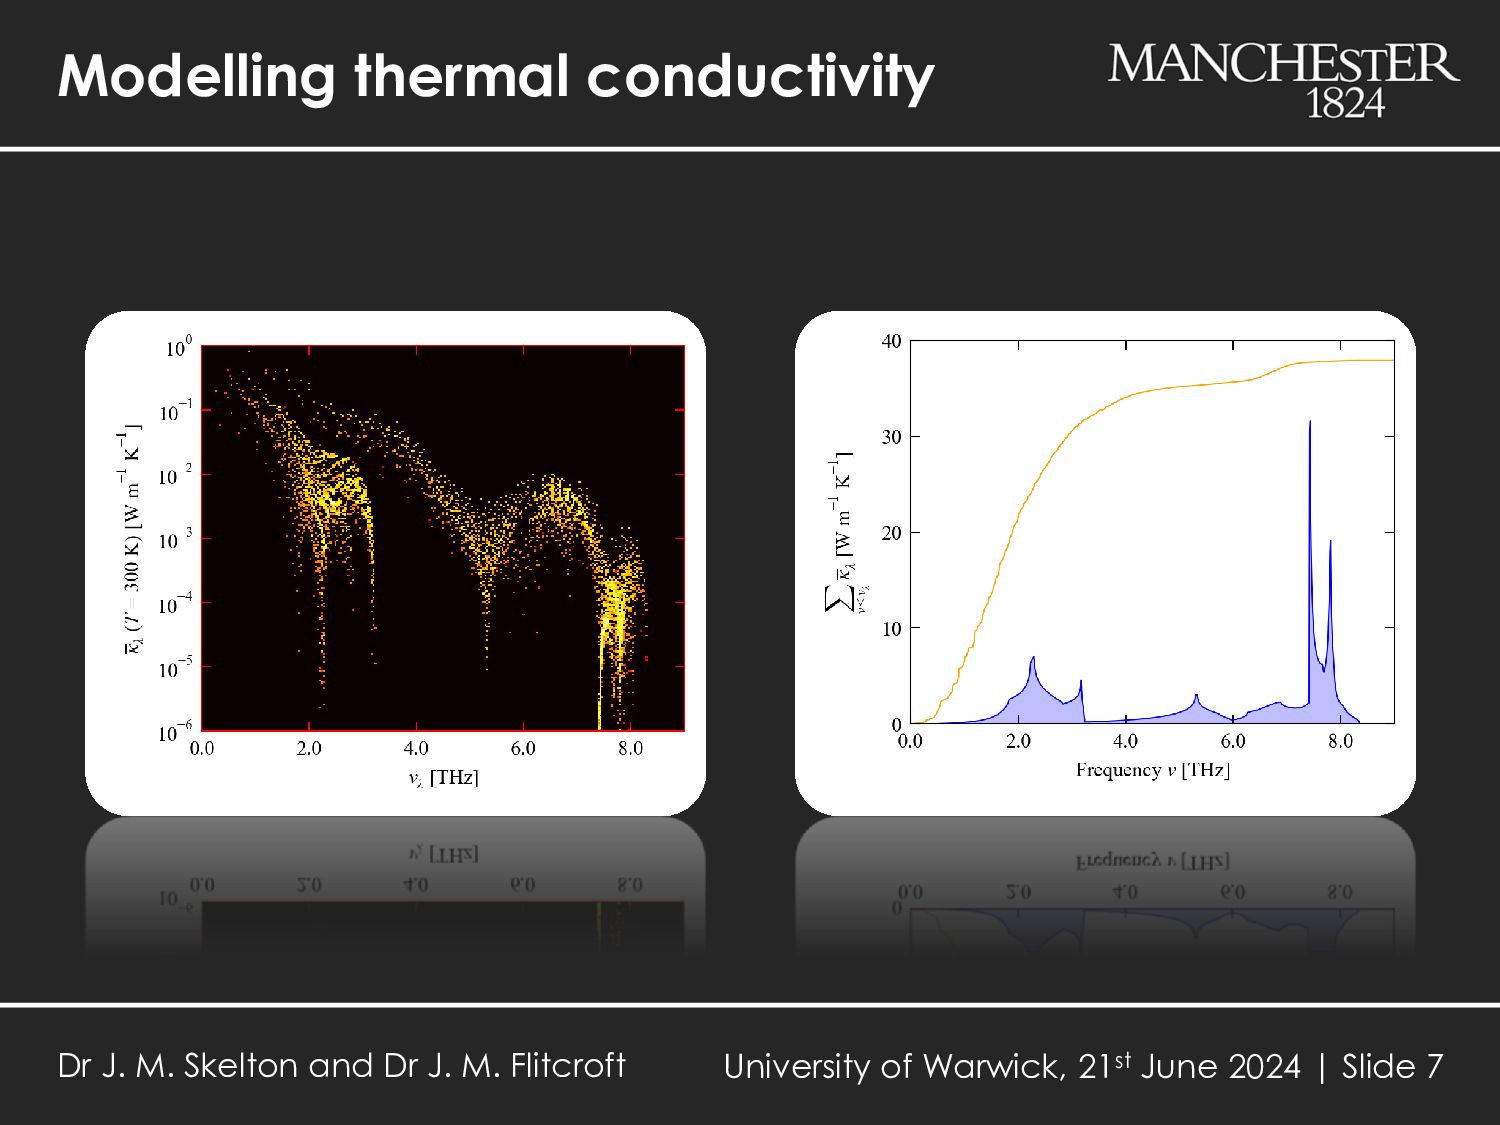
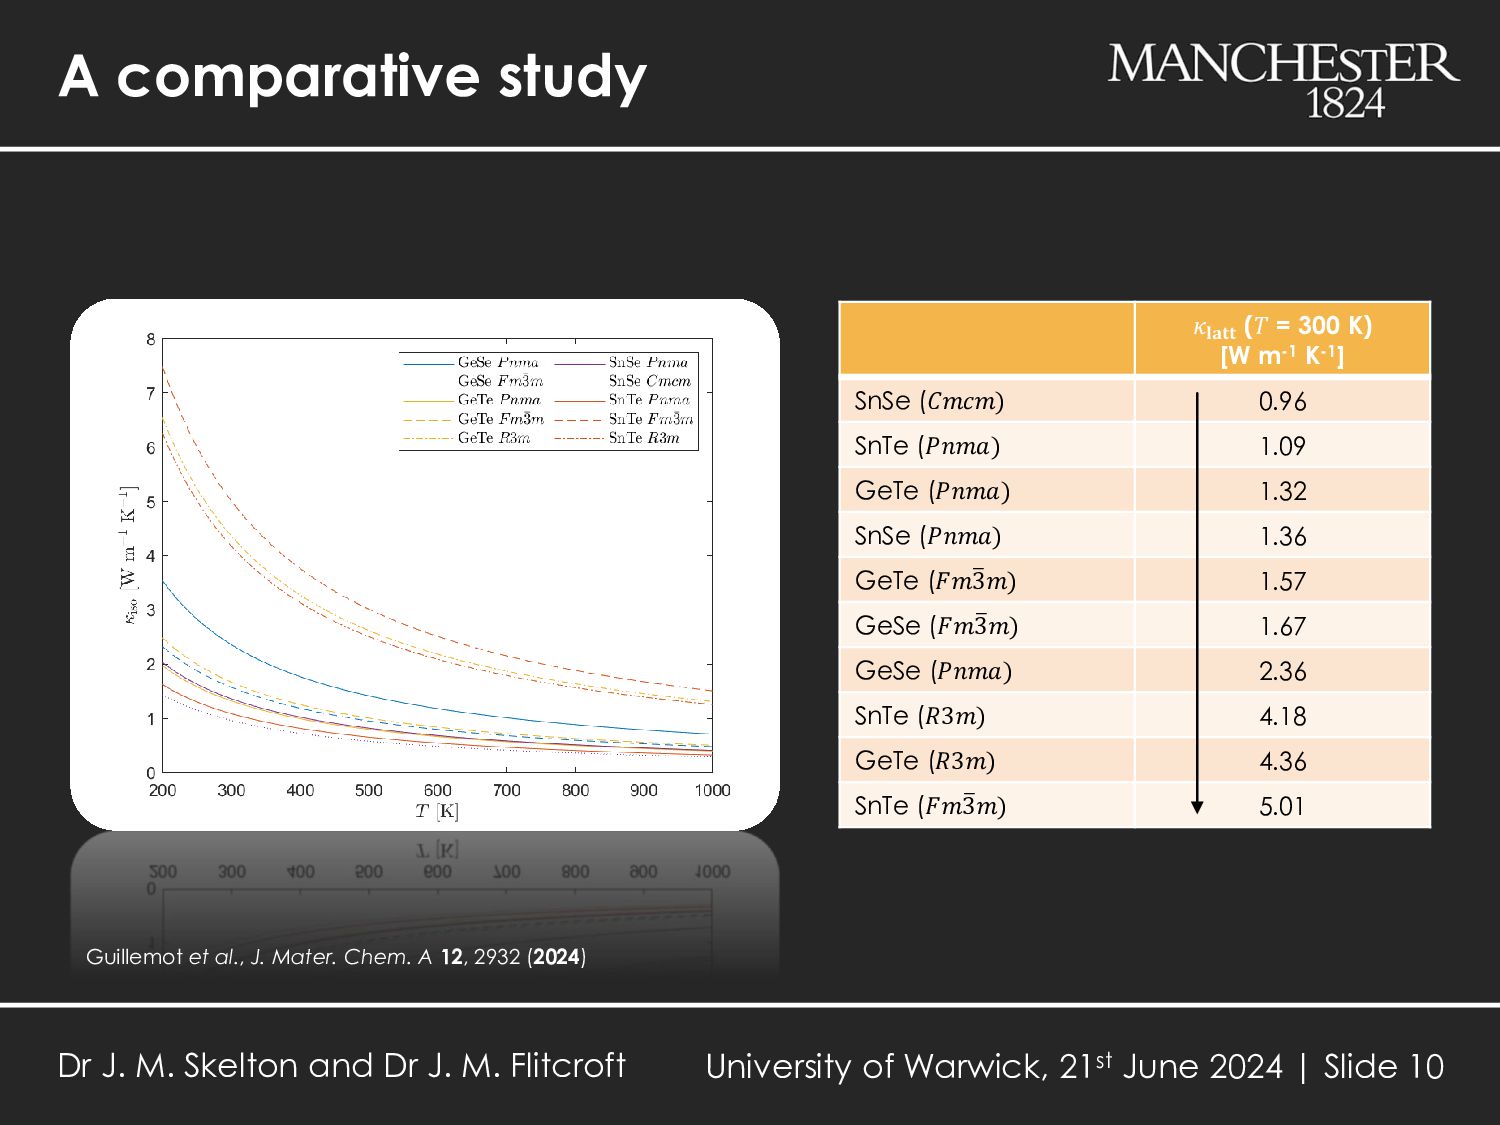
094306 (2015) The simplest model for 𝜅latt is the single-mode relaxation time approximation (SM-RTA) - a closed solution to the phonon Boltzmann transport equations 𝜿latt (𝑇) = 1 𝑁𝑉 𝜆 𝐶𝜆 (𝑇)𝒗𝜆 ⊗ 𝒗𝜆 𝜏𝜆 (𝑇) 𝐶𝜆 - phonon heat capacities 𝒗𝜆 - phonon group velocities 𝜏𝜆 - phonon lifetimes (inverse linewidths Γ𝜆 ) 𝑁 - number of 𝒒 in summation 𝑉 - unit cell volume Dr J. M. Skelton and Dr J. M. Flitcroft University of Warwick, 21st June 2024 | Slide 5
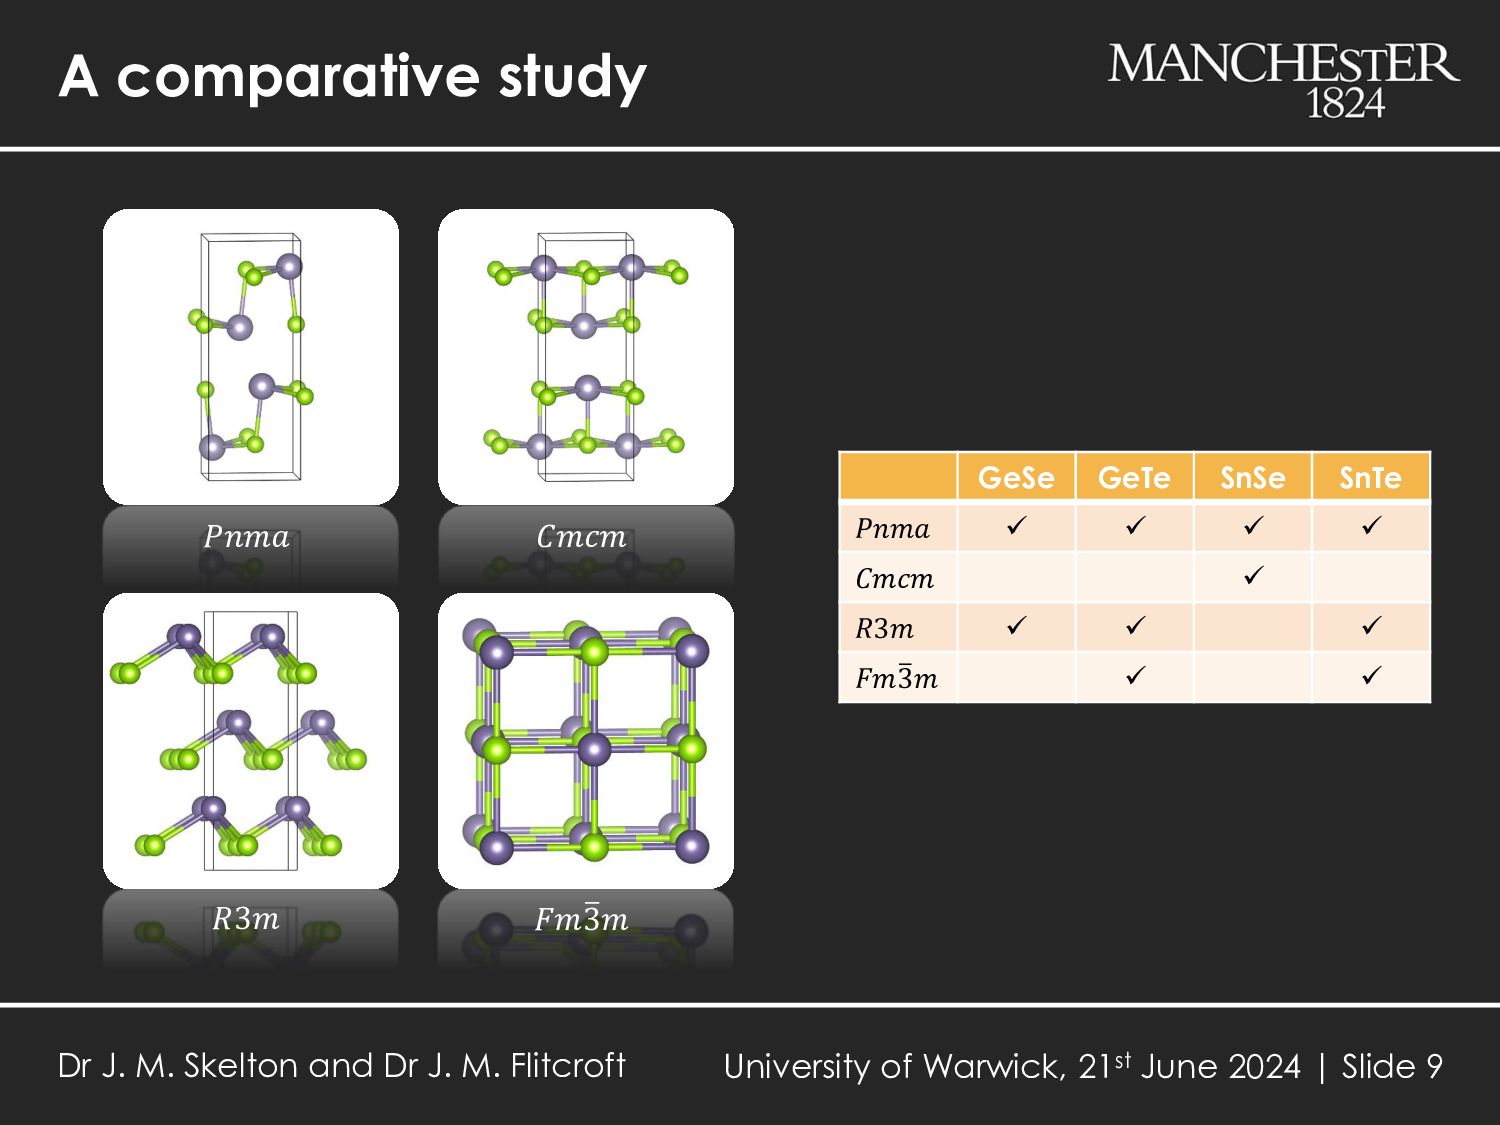
K-1] SnSe (𝐶𝑚𝑐𝑚) 0.96 SnTe (𝑃𝑛𝑚𝑎) 1.09 GeTe (𝑃𝑛𝑚𝑎) 1.32 SnSe (𝑃𝑛𝑚𝑎) 1.36 GeTe (𝐹𝑚ത 3𝑚) 1.57 GeSe (𝐹𝑚ത 3𝑚) 1.67 GeSe (𝑃𝑛𝑚𝑎) 2.36 SnTe (𝑅3𝑚) 4.18 GeTe (𝑅3𝑚) 4.36 SnTe (𝐹𝑚ത 3𝑚) 5.01 Guillemot et al., J. Mater. Chem. A 12, 2932 (2024) Dr J. M. Skelton and Dr J. M. Flitcroft University of Warwick, 21st June 2024 | Slide 10
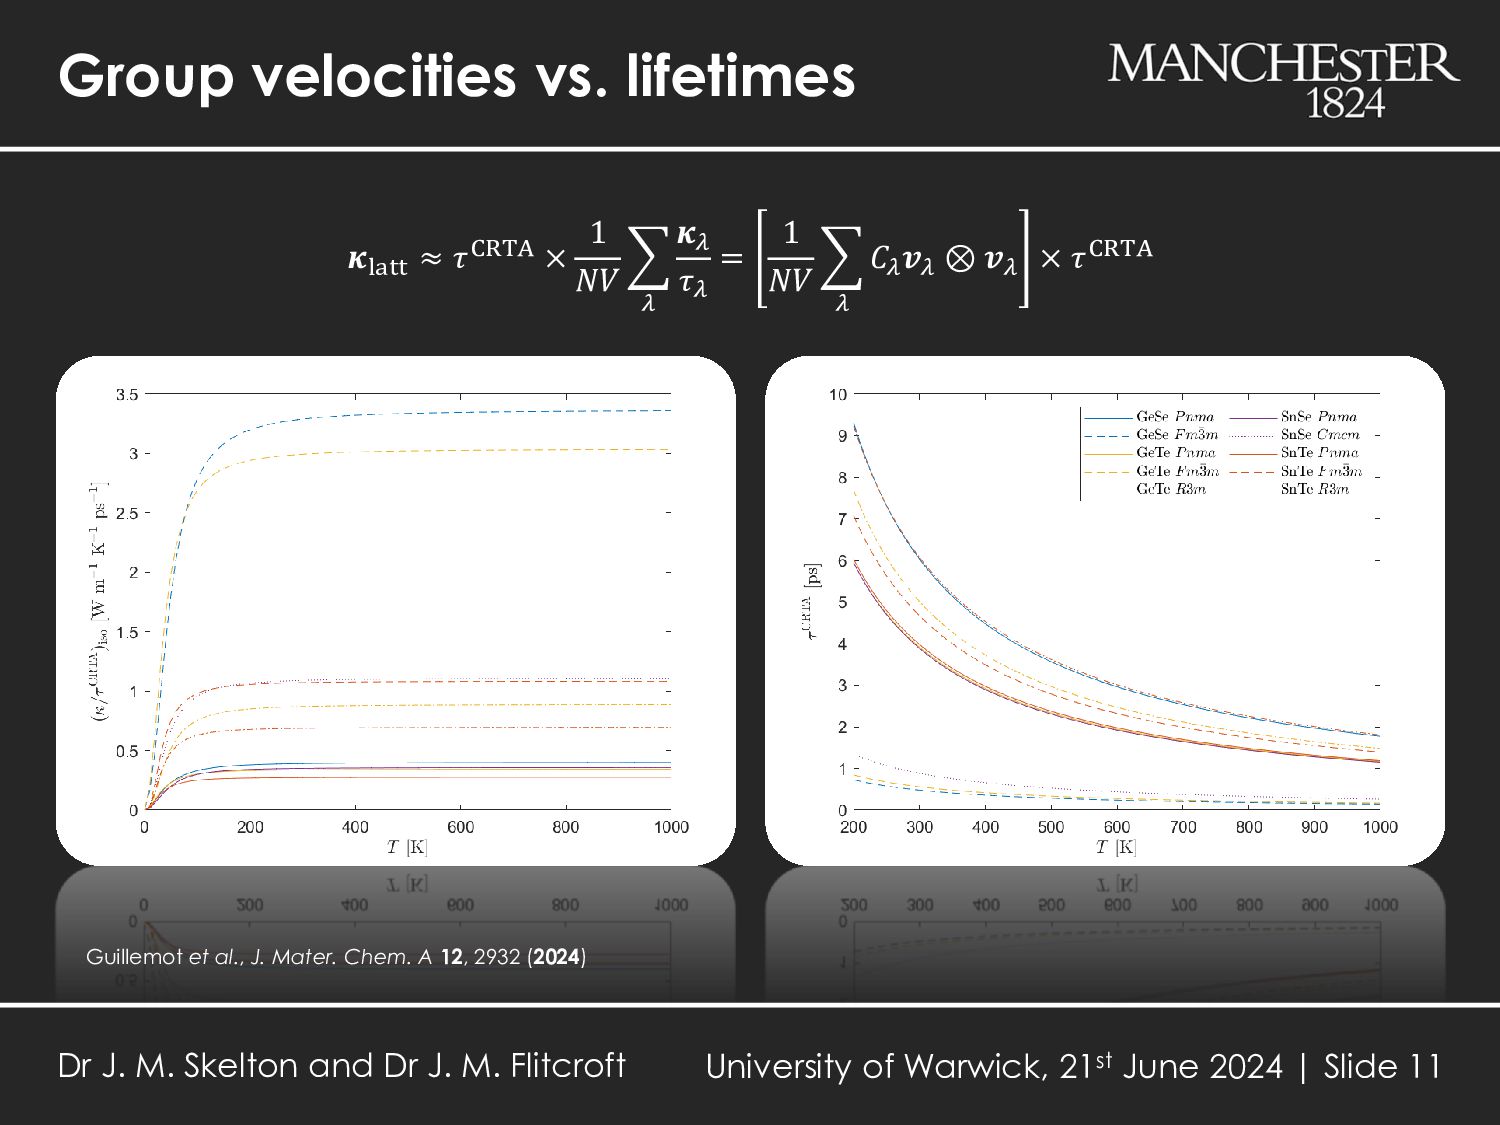
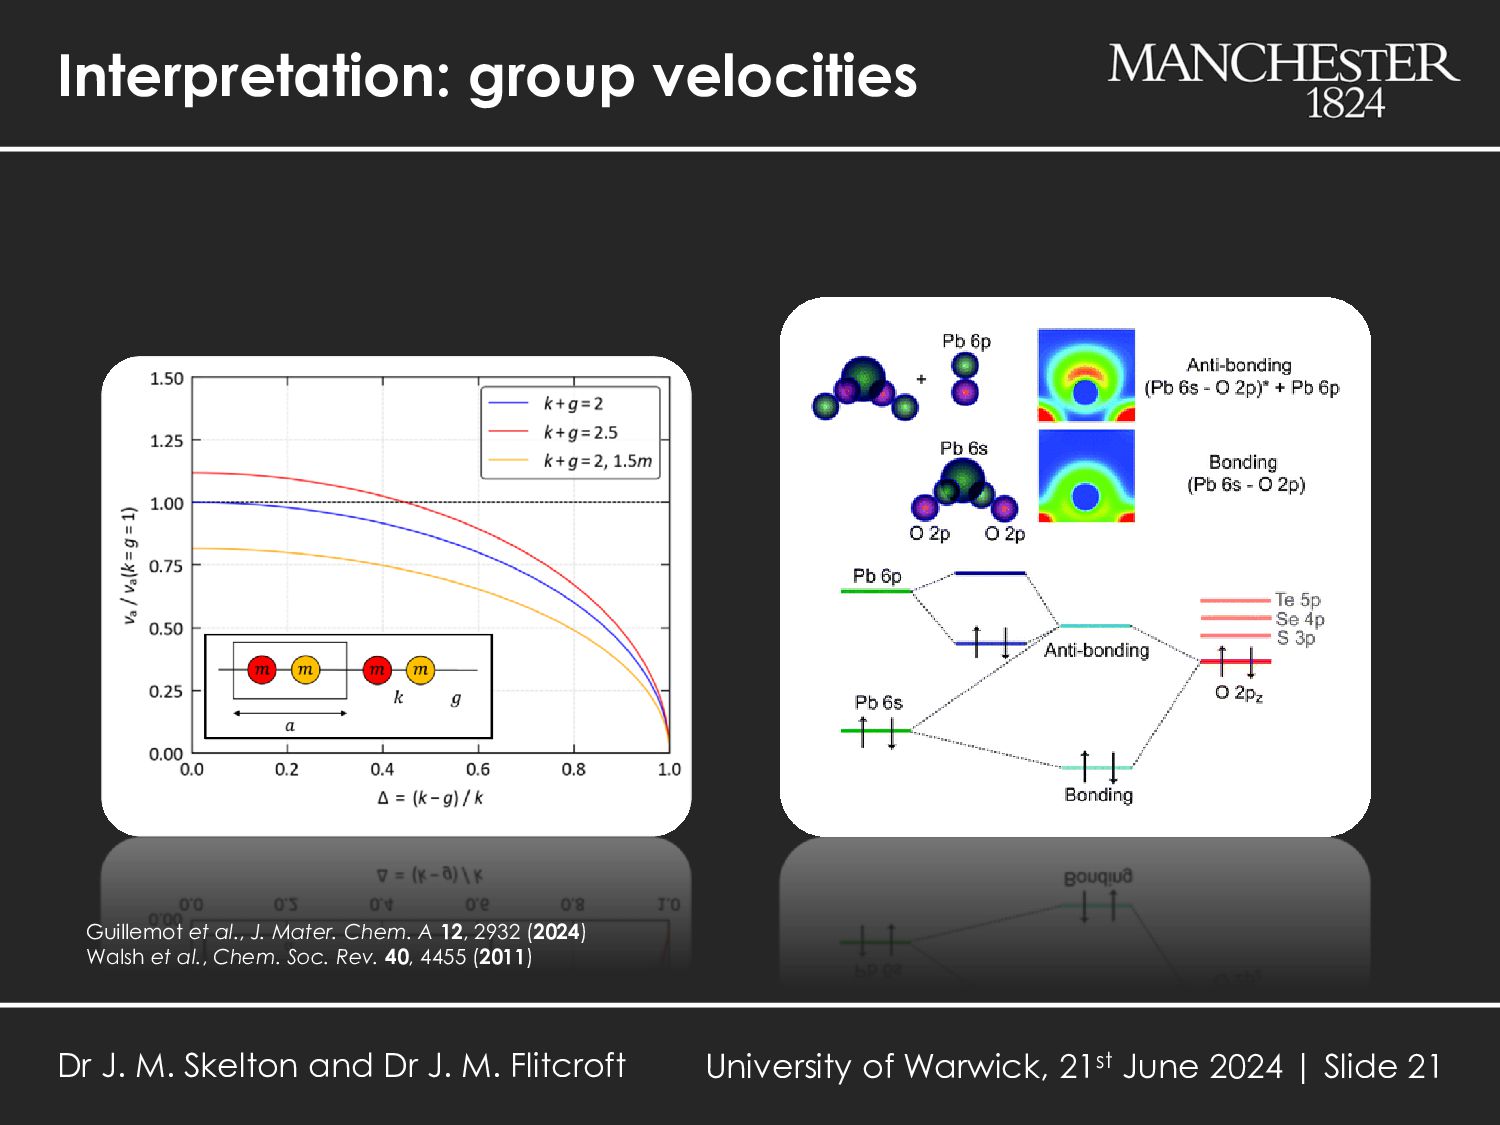
𝜆 𝜿𝜆 𝜏𝜆 = 1 𝑁𝑉 𝜆 𝐶𝜆 𝒗𝜆 ⊗ 𝒗𝜆 × 𝜏CRTA Guillemot et al., J. Mater. Chem. A 12, 2932 (2024) Dr J. M. Skelton and Dr J. M. Flitcroft University of Warwick, 21st June 2024 | Slide 11
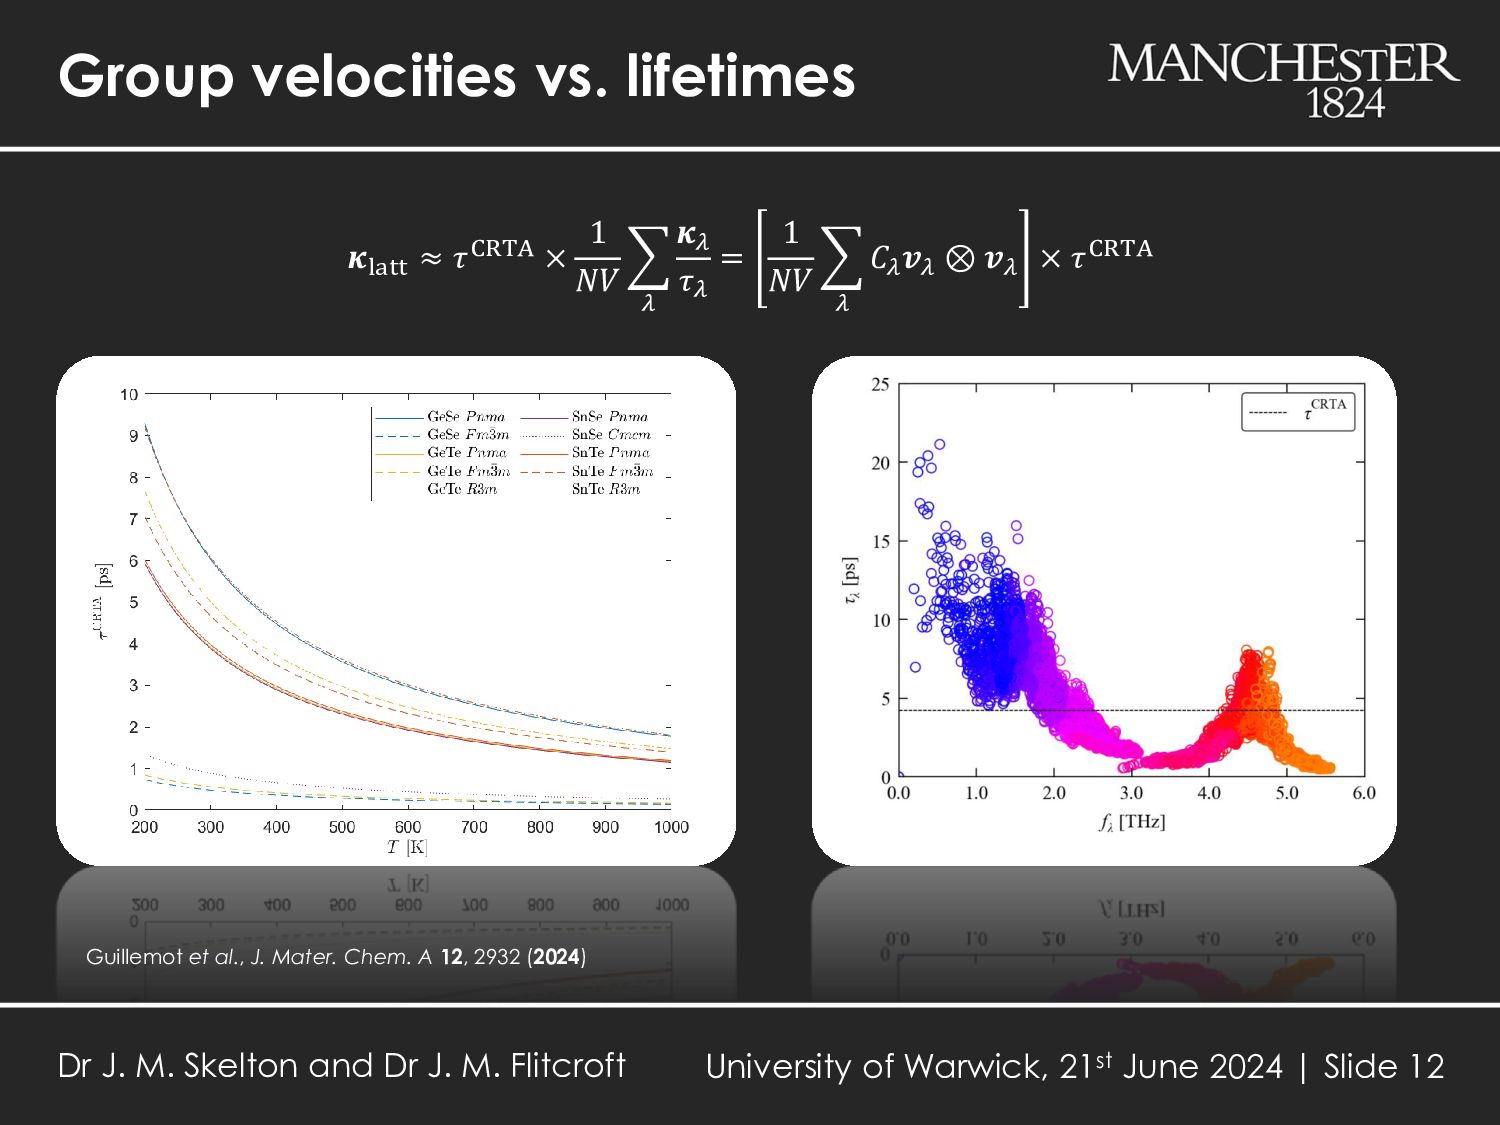
𝜆 𝜿𝜆 𝜏𝜆 = 1 𝑁𝑉 𝜆 𝐶𝜆 𝒗𝜆 ⊗ 𝒗𝜆 × 𝜏CRTA Guillemot et al., J. Mater. Chem. A 12, 2932 (2024) Dr J. M. Skelton and Dr J. M. Flitcroft University of Warwick, 21st June 2024 | Slide 12
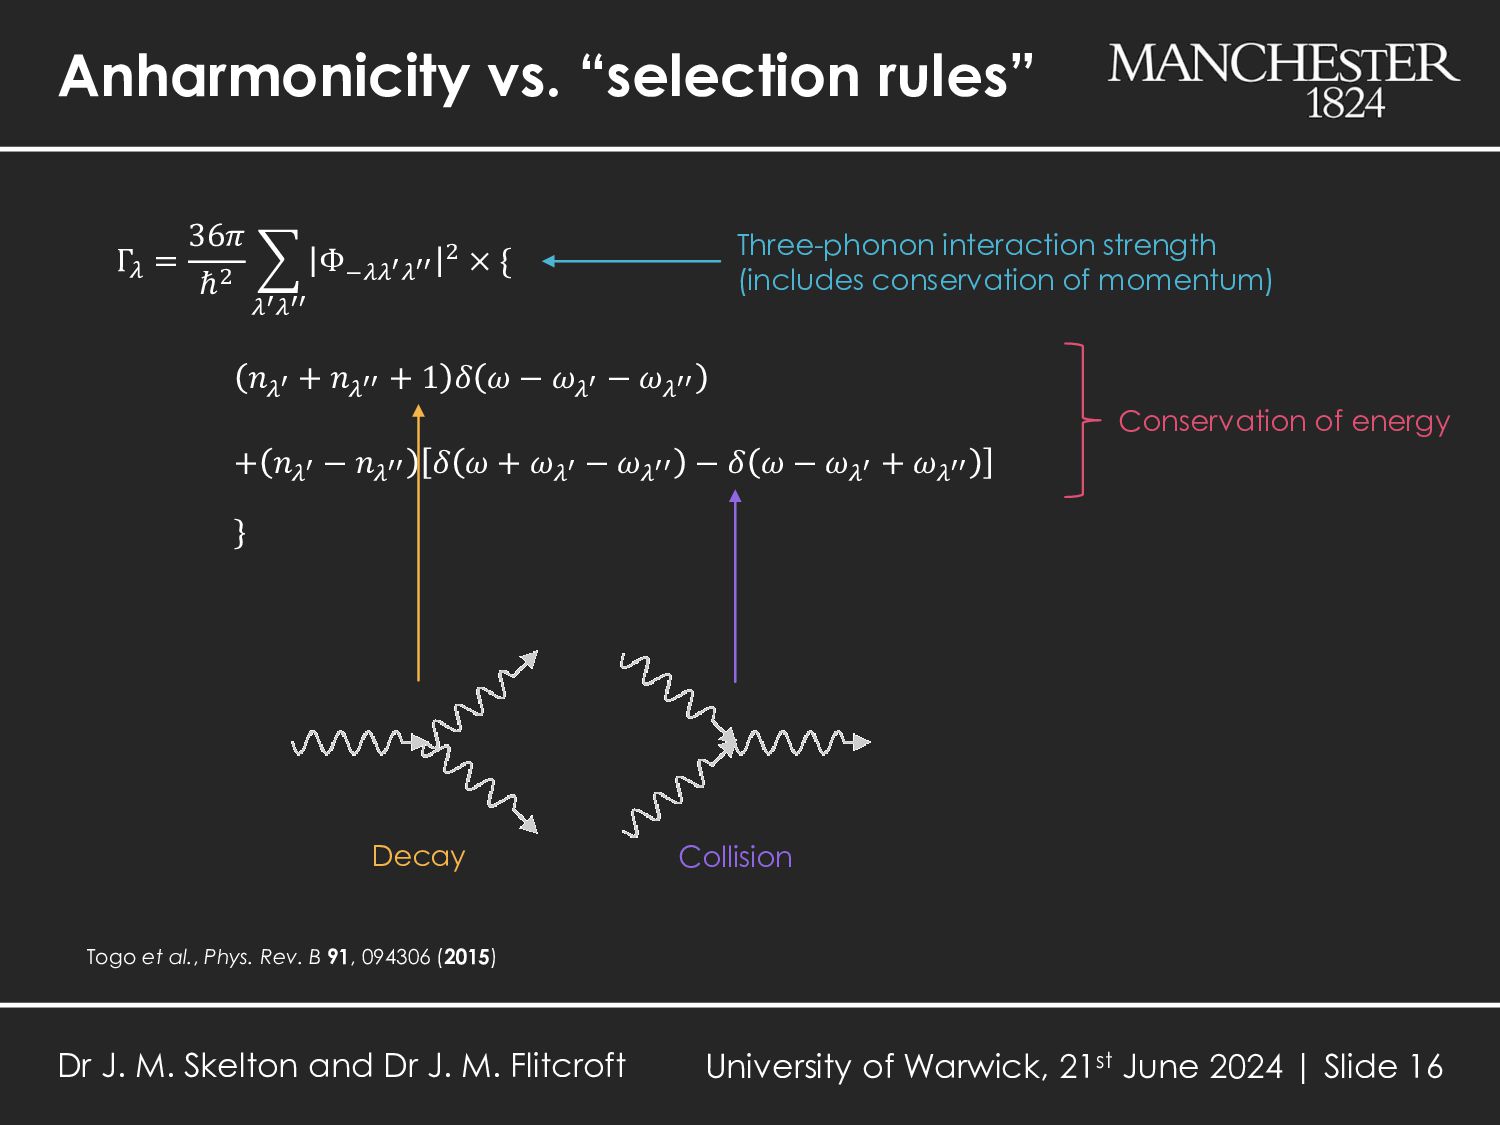
Φ−𝜆𝜆′𝜆′′ 2 × { 𝑛𝜆′ + 𝑛𝜆′′ + 1 𝛿 𝜔 − 𝜔𝜆′ − 𝜔𝜆′′ + 𝑛𝜆′ − 𝑛𝜆′′ 𝛿 𝜔 + 𝜔𝜆′ − 𝜔𝜆′′ − 𝛿 𝜔 − 𝜔𝜆′ + 𝜔𝜆′′ } Decay Collision Three-phonon interaction strength (includes conservation of momentum) Conservation of energy Togo et al., Phys. Rev. B 91, 094306 (2015) Dr J. M. Skelton and Dr J. M. Flitcroft University of Warwick, 21st June 2024 | Slide 16
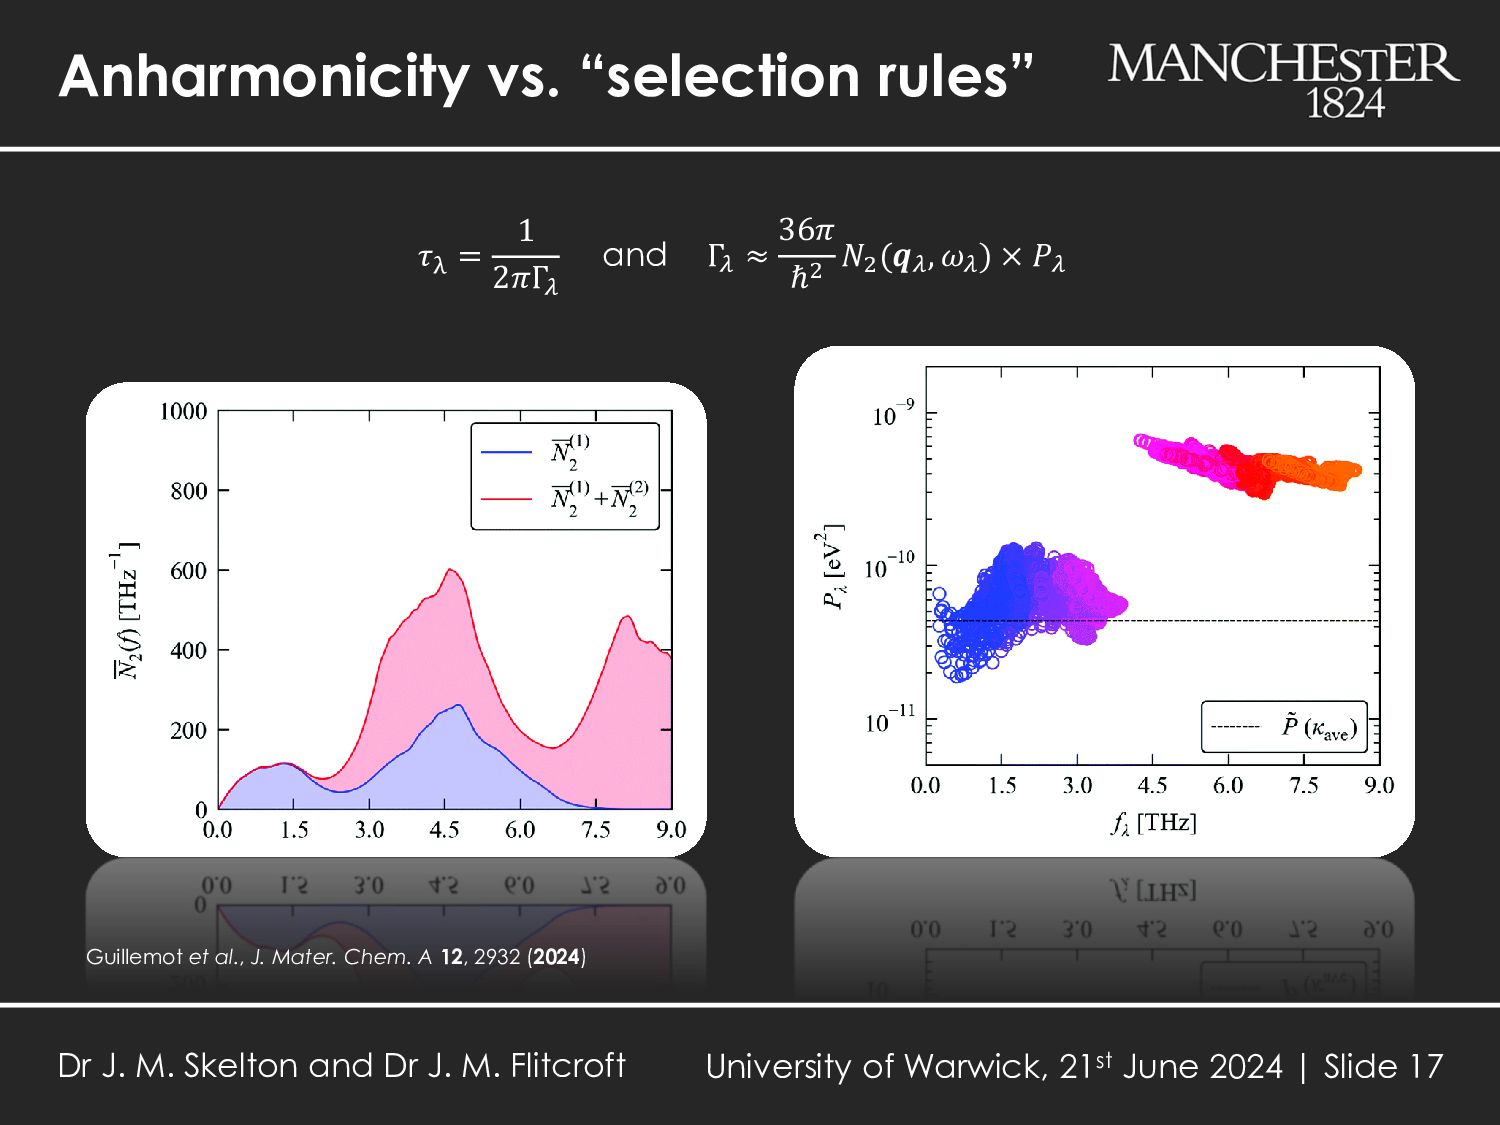
36𝜋 ℏ2 𝑁2 (𝒒𝜆 , 𝜔𝜆 ) × 𝑃𝜆 and Guillemot et al., J. Mater. Chem. A 12, 2932 (2024) Dr J. M. Skelton and Dr J. M. Flitcroft University of Warwick, 21st June 2024 | Slide 17
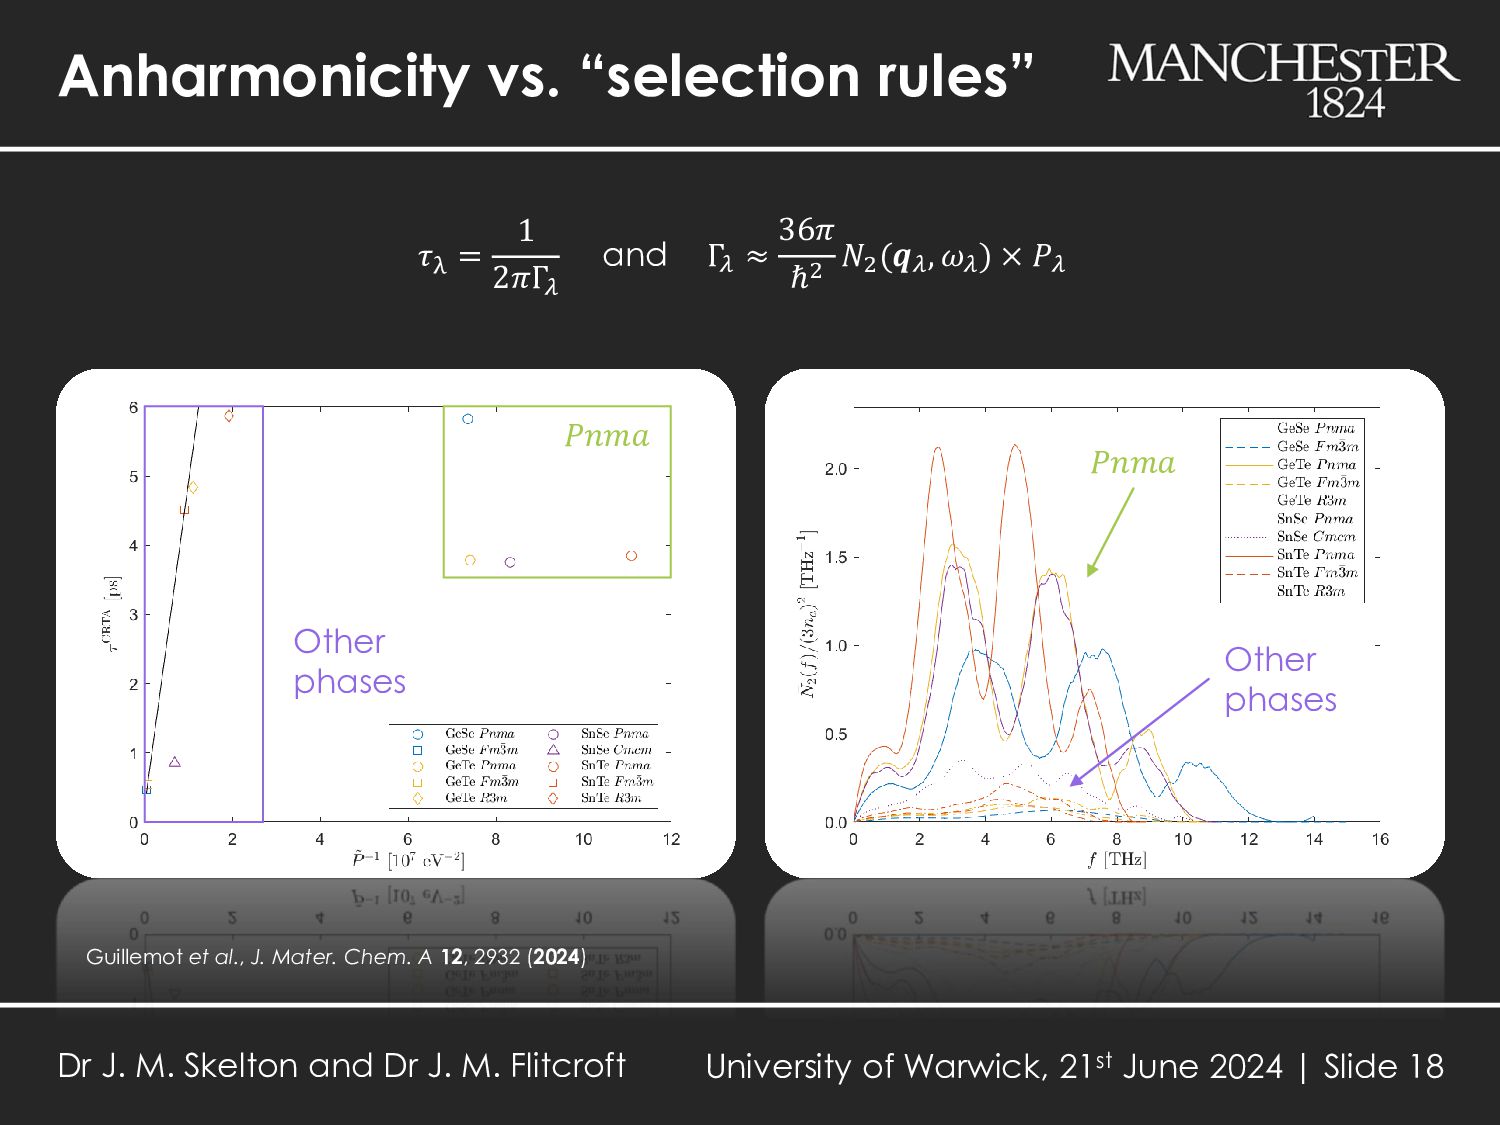
𝜏λ = 1 2𝜋Γ𝜆 Γ𝜆 ≈ 36𝜋 ℏ2 𝑁2 (𝒒𝜆 , 𝜔𝜆 ) × 𝑃𝜆 and Guillemot et al., J. Mater. Chem. A 12, 2932 (2024) Dr J. M. Skelton and Dr J. M. Flitcroft University of Warwick, 21st June 2024 | Slide 18
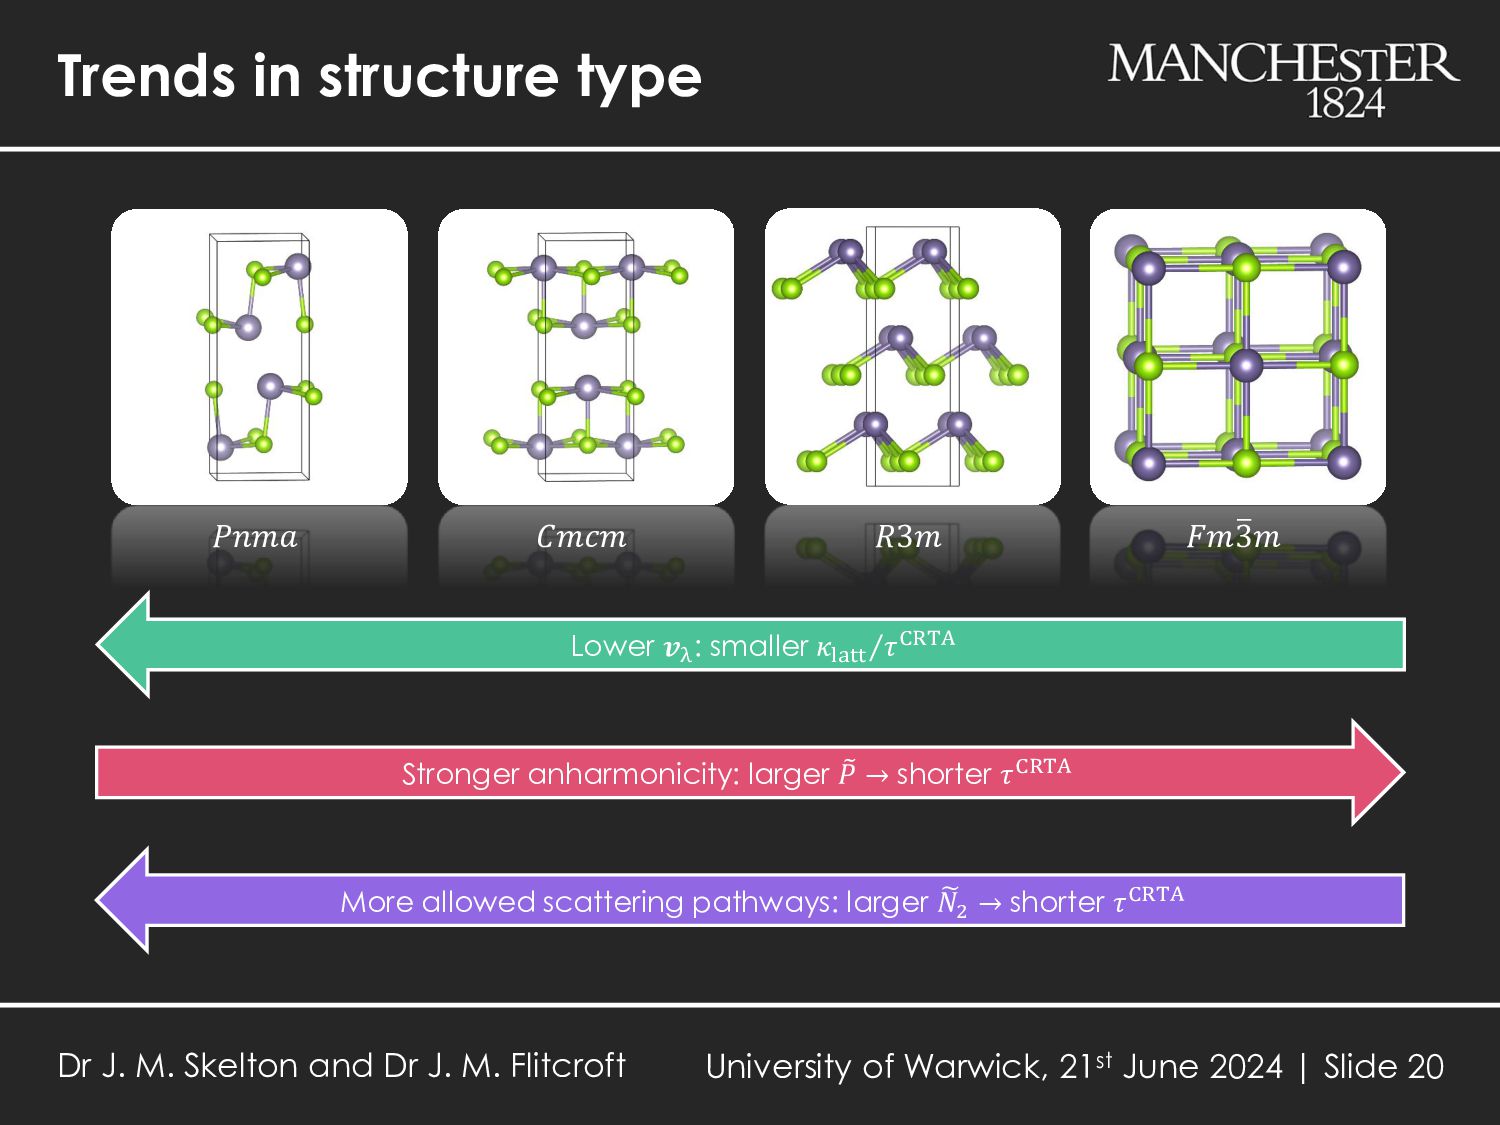
𝒗λ : smaller Τ 𝜅latt 𝜏CRTA Stronger anharmonicity: larger ෨ 𝑃 → shorter 𝜏CRTA More allowed scattering pathways: larger ෩ 𝑁2 → shorter 𝜏CRTA Dr J. M. Skelton and Dr J. M. Flitcroft University of Warwick, 21st June 2024 | Slide 20
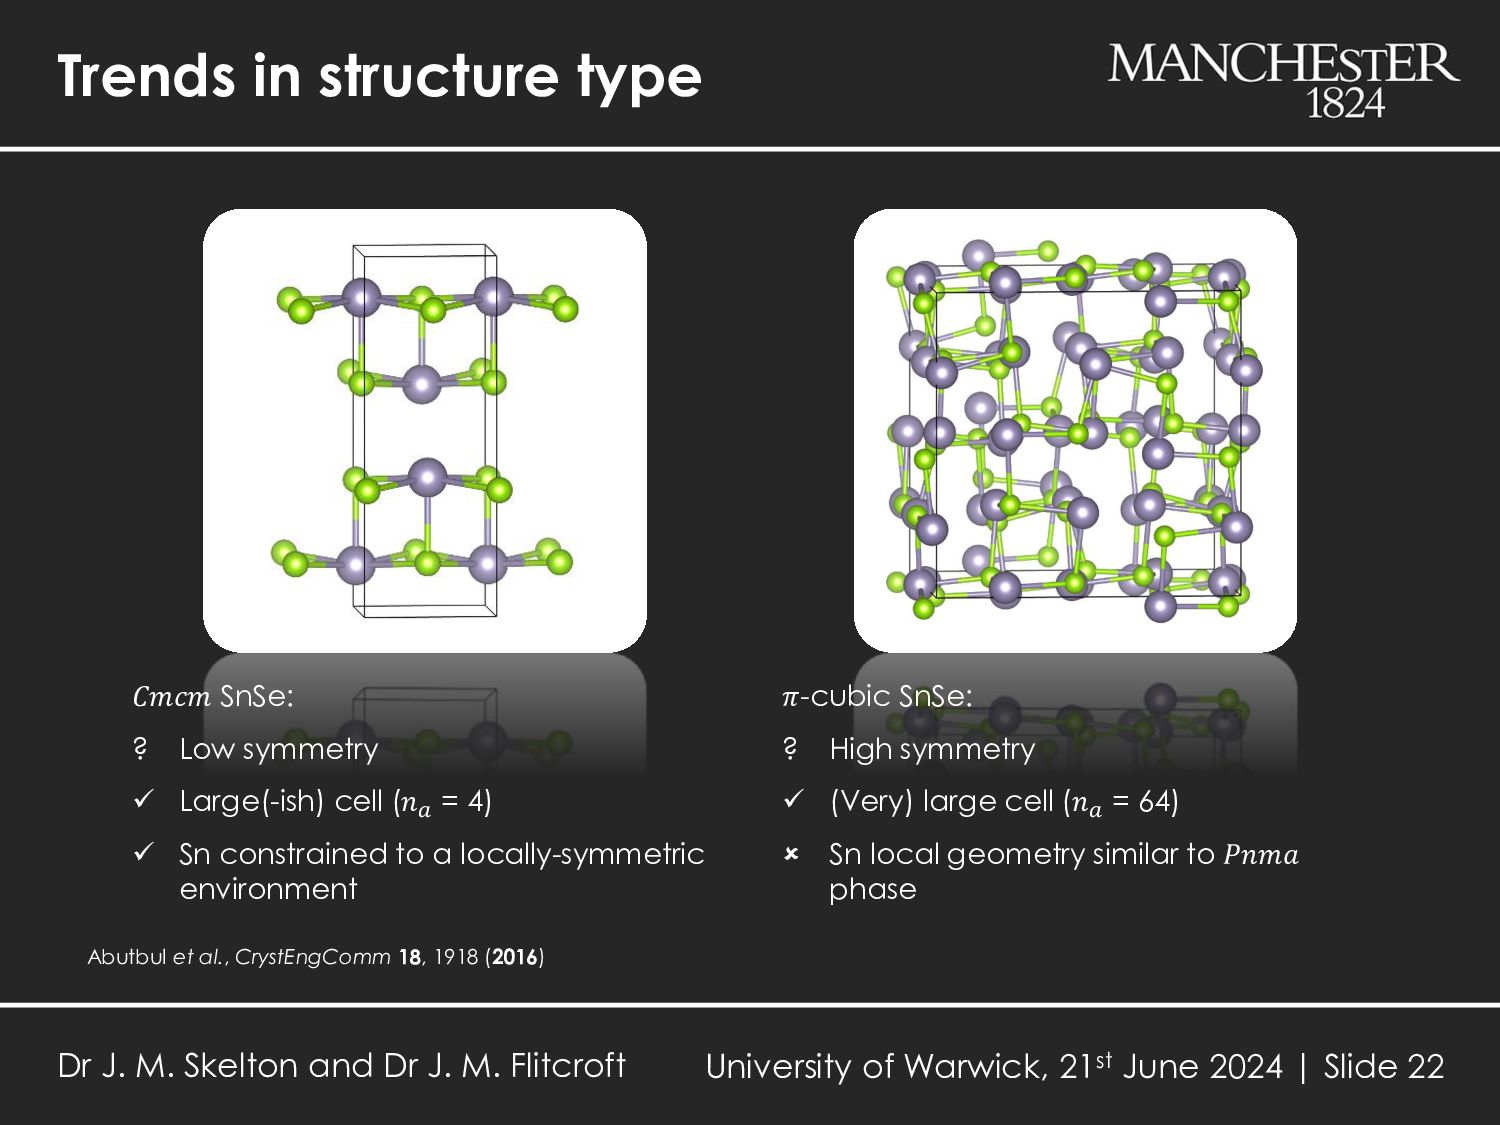
Large(-ish) cell (𝑛𝑎 = 4) Sn constrained to a locally-symmetric environment 𝜋-cubic SnSe: ? High symmetry (Very) large cell (𝑛𝑎 = 64) Sn local geometry similar to 𝑃𝑛𝑚𝑎 phase Abutbul et al., CrystEngComm 18, 1918 (2016) Dr J. M. Skelton and Dr J. M. Flitcroft University of Warwick, 21st June 2024 | Slide 22
optimisation Phonon calculation 𝜅latt Electronic structure 𝑆, 𝜎, 𝜅el 𝑍𝑇 = 𝑆2σ 𝜅el + 𝜅latt 𝑇 Scattering rates: DP, 𝜀∞ , 𝑍∗, 𝐶𝑖𝑗 Part 1 Dr J. M. Skelton and Dr J. M. Flitcroft University of Warwick, 21st June 2024 | Slide 24 Part 2
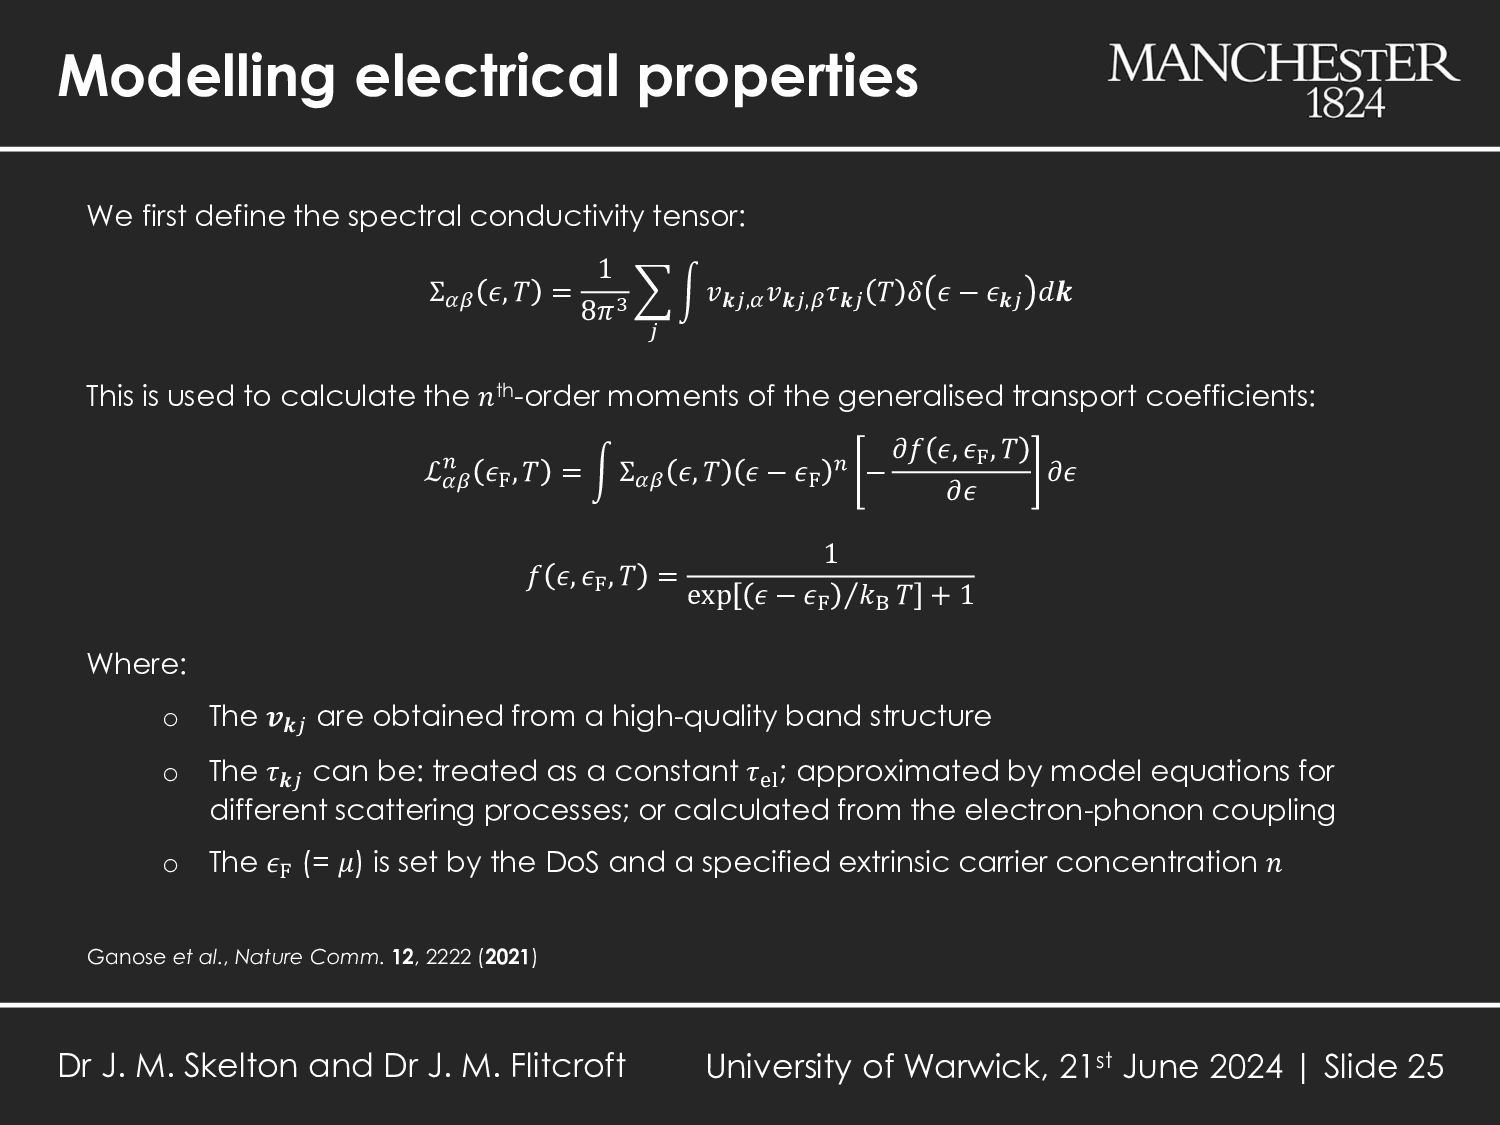
(2021) We first define the spectral conductivity tensor: Σ𝛼𝛽 𝜖, 𝑇 = 1 8𝜋3 𝑗 න 𝑣𝒌𝑗,𝛼 𝑣𝒌𝑗,𝛽 𝜏𝒌𝑗 𝑇 𝛿 𝜖 − 𝜖𝒌𝑗 𝑑𝒌 This is used to calculate the 𝑛th-order moments of the generalised transport coefficients: ℒ𝛼𝛽 𝑛 𝜖F , 𝑇 = න Σ𝛼𝛽 𝜖, 𝑇 𝜖 − 𝜖F 𝑛 − 𝜕𝑓 𝜖, 𝜖F , 𝑇 𝜕𝜖 𝜕𝜖 𝑓 𝜖, 𝜖F , 𝑇 = 1 exp Τ 𝜖 − 𝜖F 𝑘B 𝑇 + 1 Where: o The 𝒗𝒌𝑗 are obtained from a high-quality band structure o The 𝜏𝒌𝑗 can be: treated as a constant 𝜏el ; approximated by model equations for different scattering processes; or calculated from the electron-phonon coupling o The 𝜖F (= 𝜇) is set by the DoS and a specified extrinsic carrier concentration 𝑛 Dr J. M. Skelton and Dr J. M. Flitcroft University of Warwick, 21st June 2024 | Slide 25
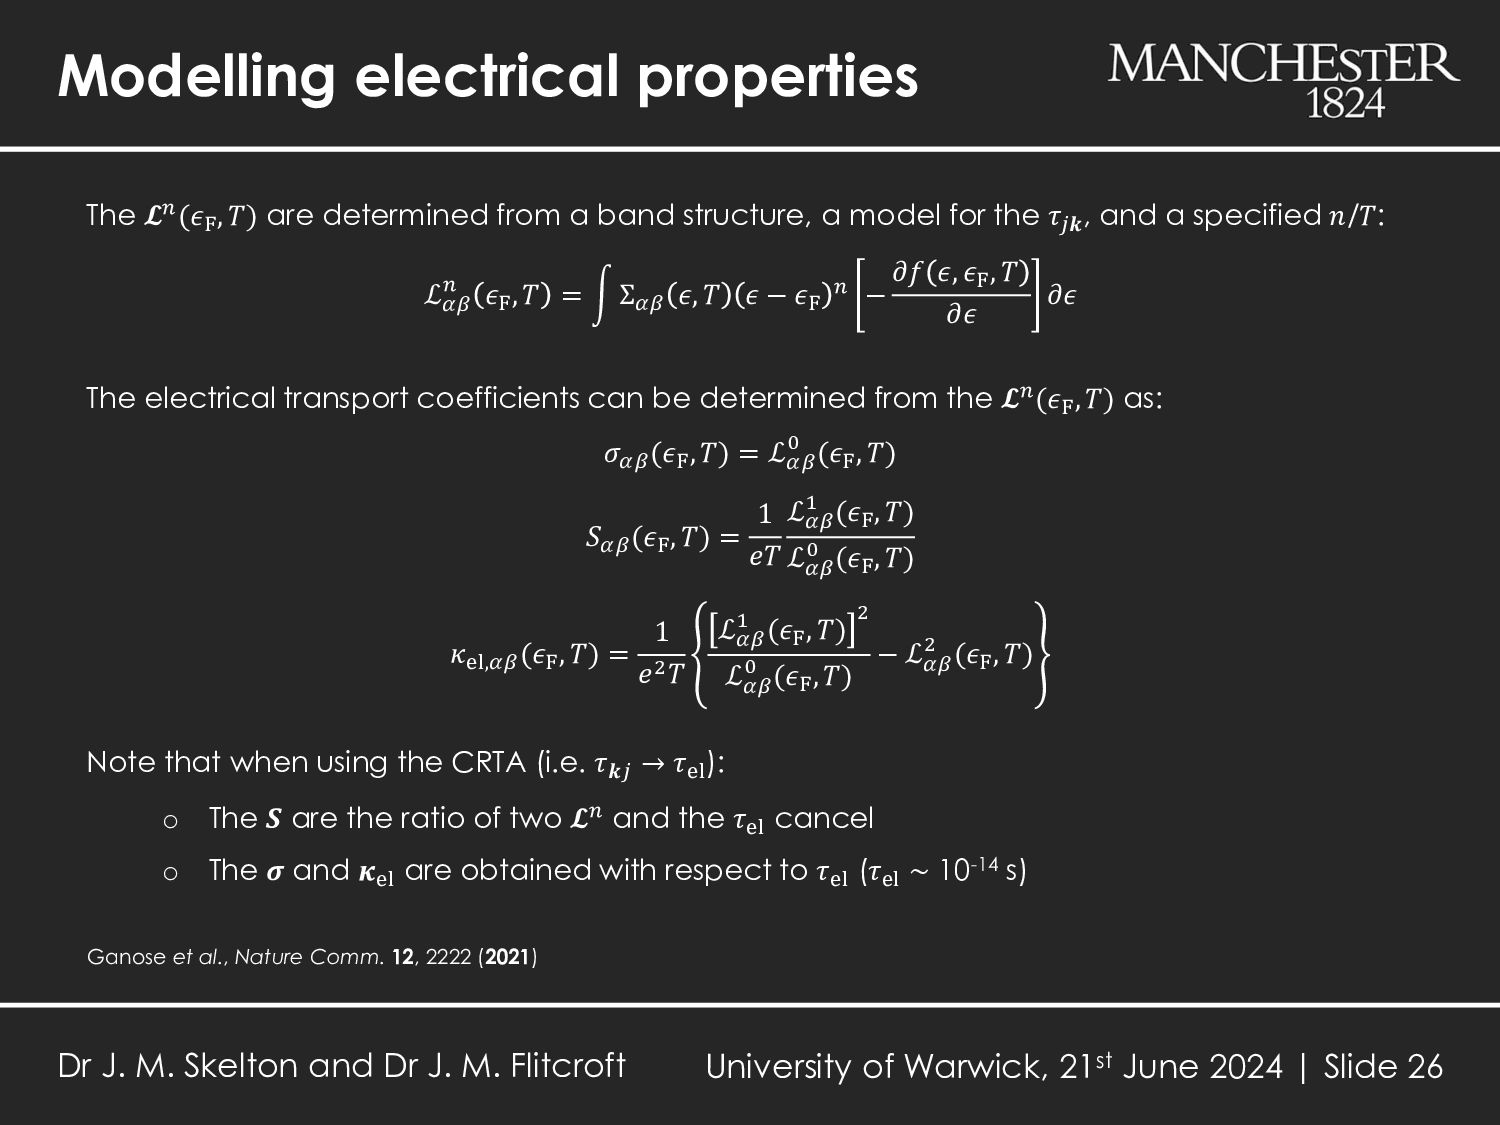
a band structure, a model for the 𝜏𝑗𝒌 , and a specified 𝑛/𝑇: ℒ𝛼𝛽 𝑛 𝜖F , 𝑇 = න Σ𝛼𝛽 𝜖, 𝑇 𝜖 − 𝜖F 𝑛 − 𝜕𝑓 𝜖, 𝜖F , 𝑇 𝜕𝜖 𝜕𝜖 The electrical transport coefficients can be determined from the 𝓛𝑛(𝜖F , 𝑇) as: 𝜎𝛼𝛽 (𝜖F , 𝑇) = ℒ𝛼𝛽 0 (𝜖F , 𝑇) 𝑆𝛼𝛽 (𝜖F , 𝑇) = 1 𝑒𝑇 ℒ𝛼𝛽 1 (𝜖F , 𝑇) ℒ 𝛼𝛽 0 (𝜖F , 𝑇) 𝜅el,𝛼𝛽 (𝜖F , 𝑇) = 1 𝑒2𝑇 ℒ𝛼𝛽 1 (𝜖F , 𝑇) 2 ℒ 𝛼𝛽 0 (𝜖F , 𝑇) − ℒ𝛼𝛽 2 (𝜖F , 𝑇) Note that when using the CRTA (i.e. 𝜏𝒌𝑗 → 𝜏el ): o The 𝑺 are the ratio of two 𝓛𝑛 and the 𝜏el cancel o The 𝝈 and 𝜿el are obtained with respect to 𝜏el (𝜏el ~ 10-14 s) Ganose et al., Nature Comm. 12, 2222 (2021) Dr J. M. Skelton and Dr J. M. Flitcroft University of Warwick, 21st June 2024 | Slide 26
[Å3] Bi2 SO2 3.81 3.81 11.90 173 Expt 3.87 3.84 11.92 177 Bi2 SeO2 3.87 3.87 12.12 182 Expt 3.88 3.88 12.21 184 Bi2 TeO2 3.96 3.96 12.68 199 Expt 3.98 3.98 12.70 201 Koyama et al., Acta Cryst. B 40, 105 (1984) Zhan et al., J. Am. Ceram. Soc. 98, 2465 (2015) Luu and Vaqueiro, J. Solid State Chem. 226, 219 (2015) Dr J. M. Skelton and Dr J. M. Flitcroft University of Warwick, 21st June 2024 | Slide 28
SO2 300 2.62 2.9 Bi2 SeO2 800 0.97 0.71 Bi2 TeO2 300 0.95 0.91 Flitcroft et al., J. Phys.: Energy 6, 025011 (2024) Zhang et al., J. Mater. Chem. C 7, 14986 (2019) Pan et al., Nano Energy 69, 104394 (2020) Luu and Vaqueiro, J. Solid State Chen. 226, 219 (2015) Dr J. M. Skelton and Dr J. M. Flitcroft University of Warwick, 21st June 2024 | Slide 29
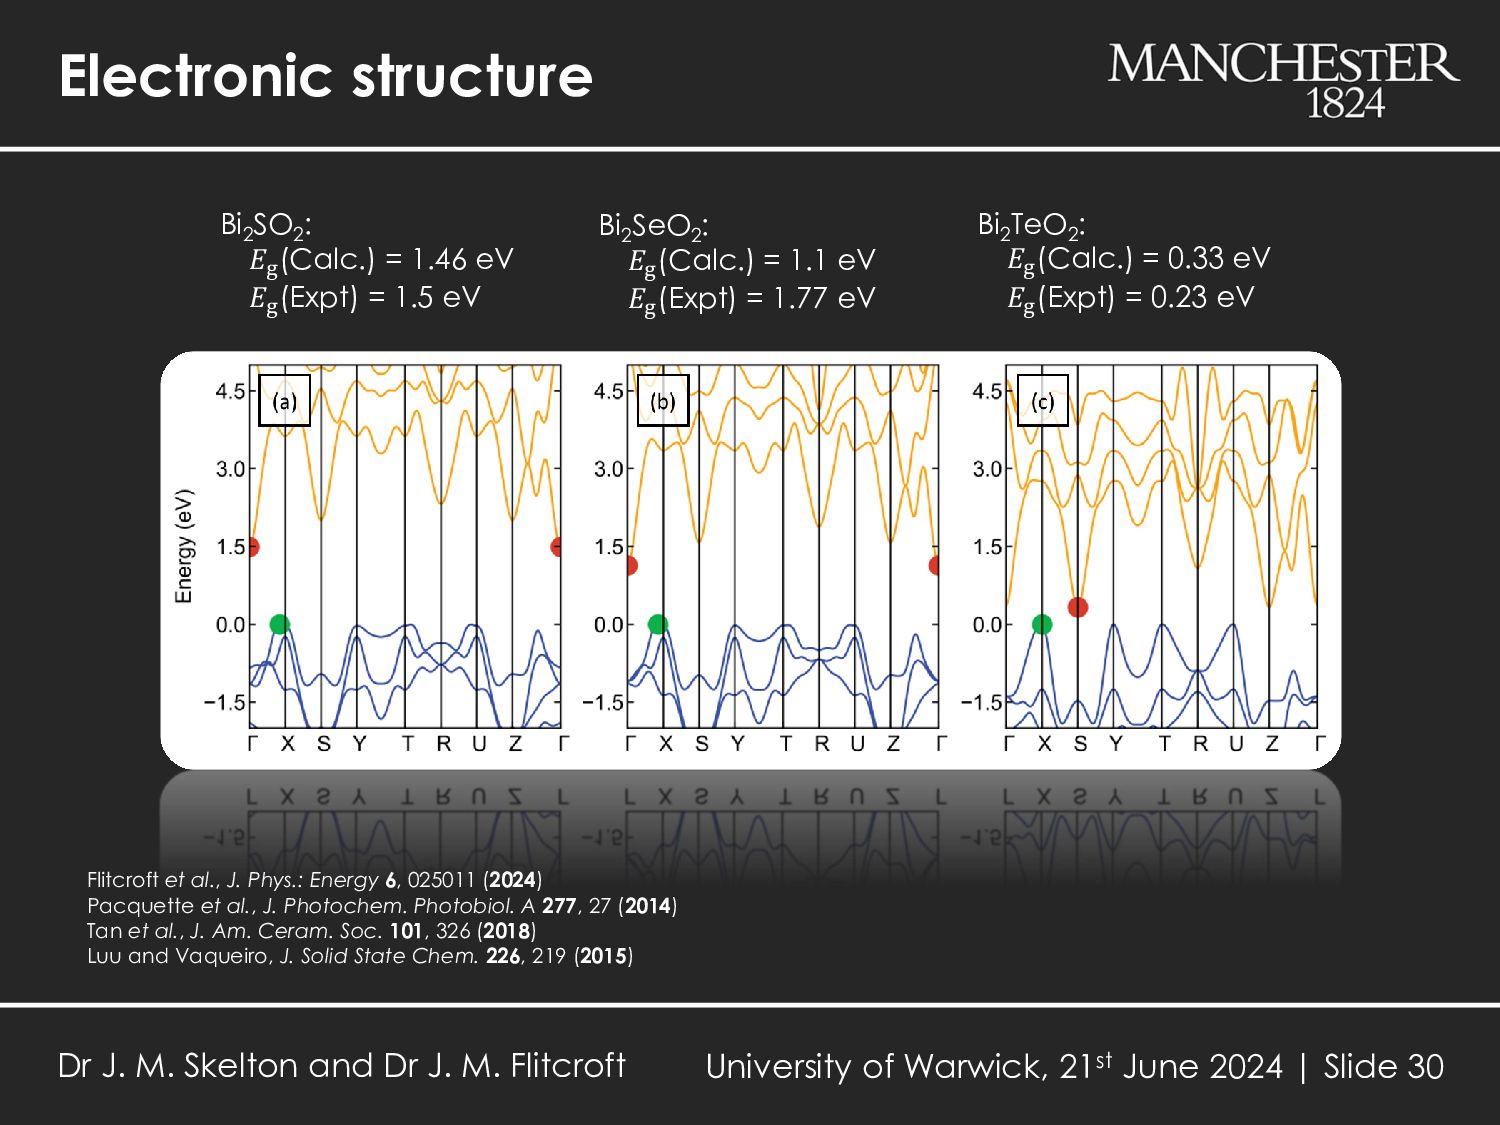
(2024) Pacquette et al., J. Photochem. Photobiol. A 277, 27 (2014) Tan et al., J. Am. Ceram. Soc. 101, 326 (2018) Luu and Vaqueiro, J. Solid State Chem. 226, 219 (2015) Bi2 SO2 : 𝐸g (Calc.) = 1.46 eV 𝐸g (Expt) = 1.5 eV Bi2 SeO2 : 𝐸g (Calc.) = 1.1 eV 𝐸g (Expt) = 1.77 eV Bi2 TeO2 : 𝐸g (Calc.) = 0.33 eV 𝐸g (Expt) = 0.23 eV Dr J. M. Skelton and Dr J. M. Flitcroft University of Warwick, 21st June 2024 | Slide 30
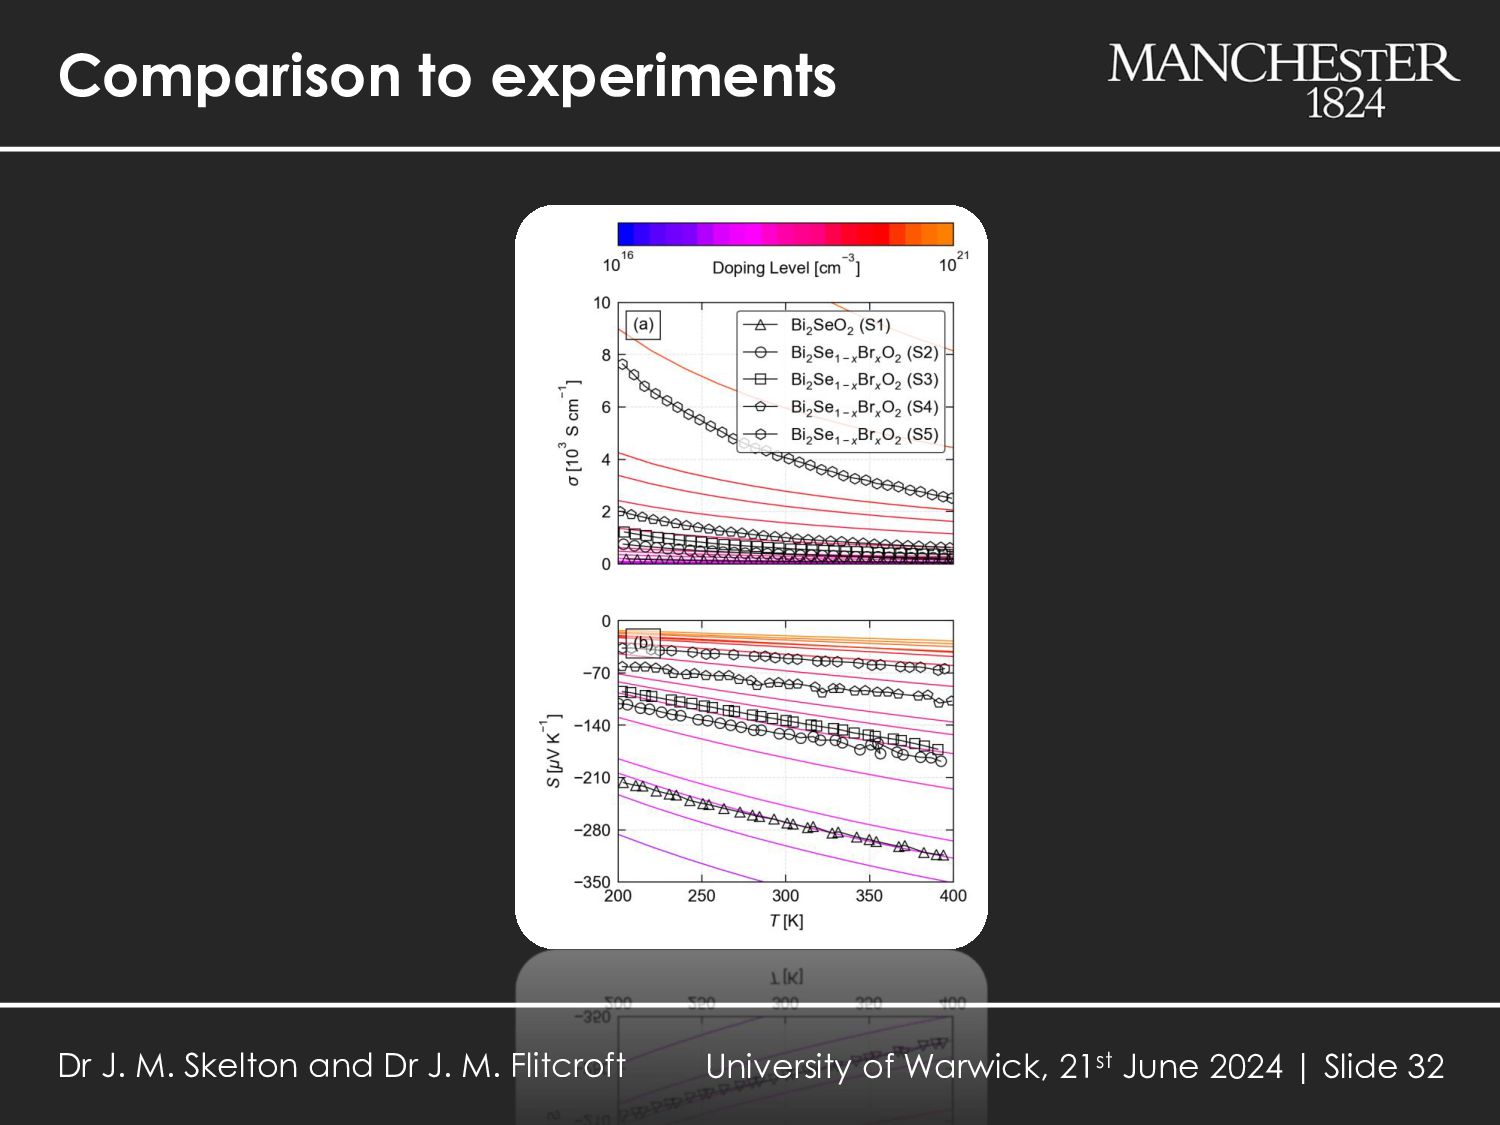
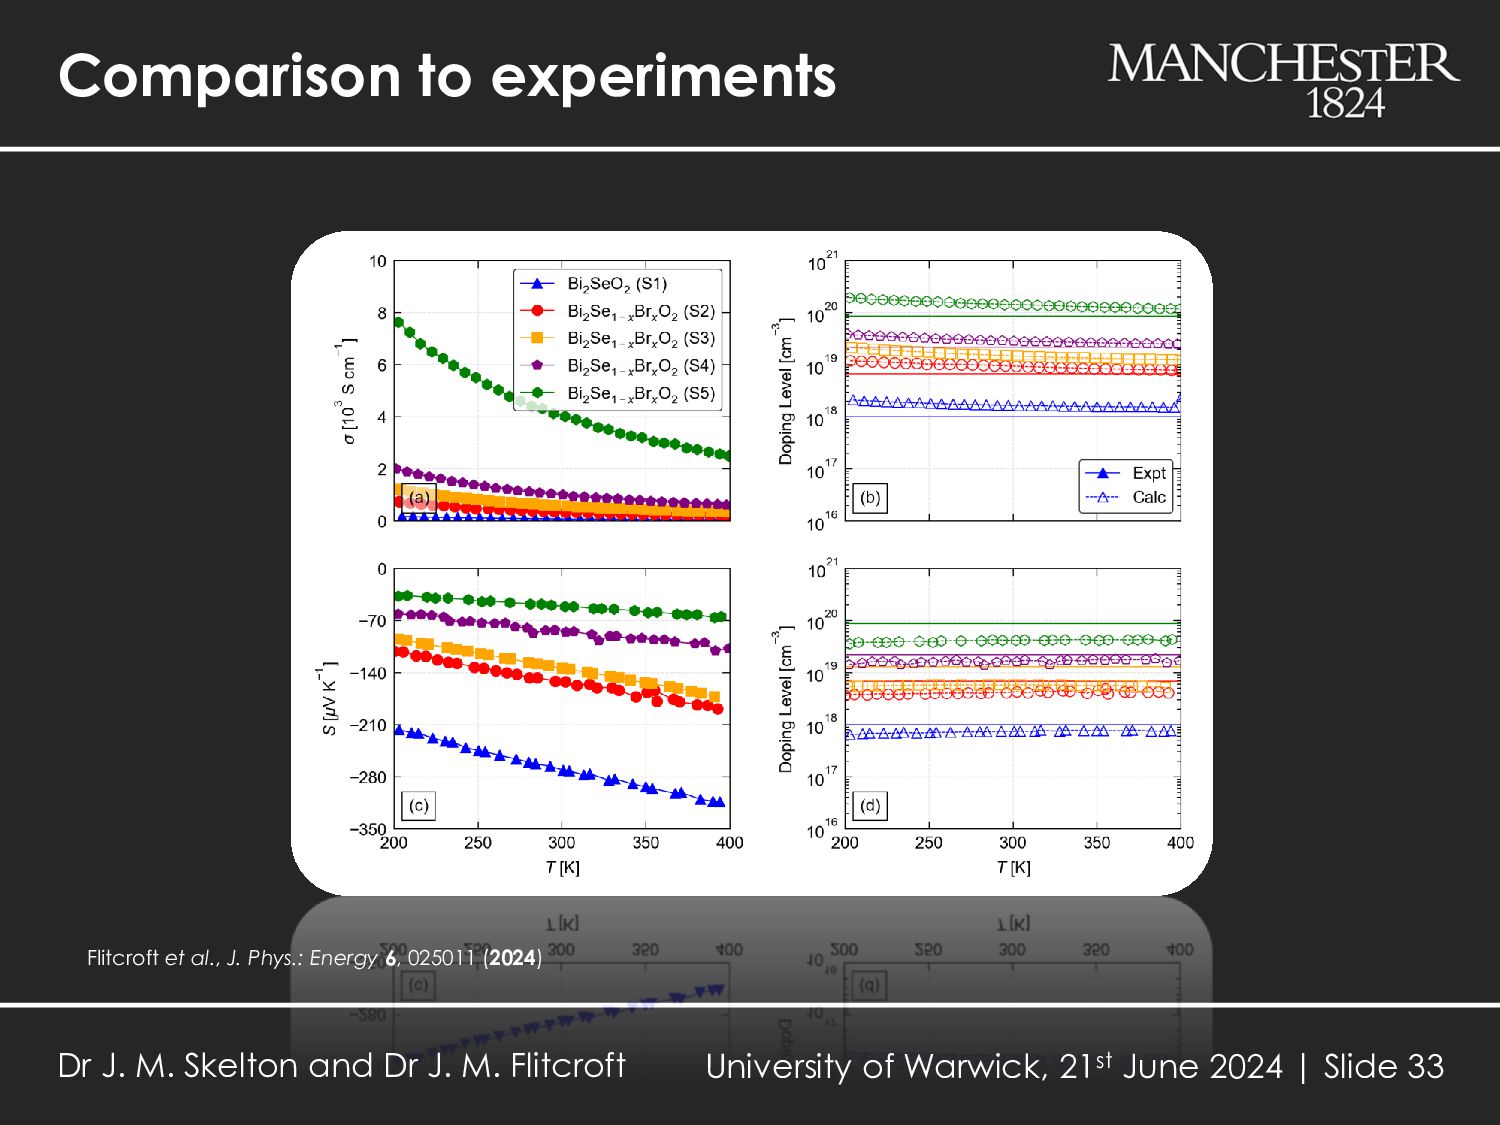
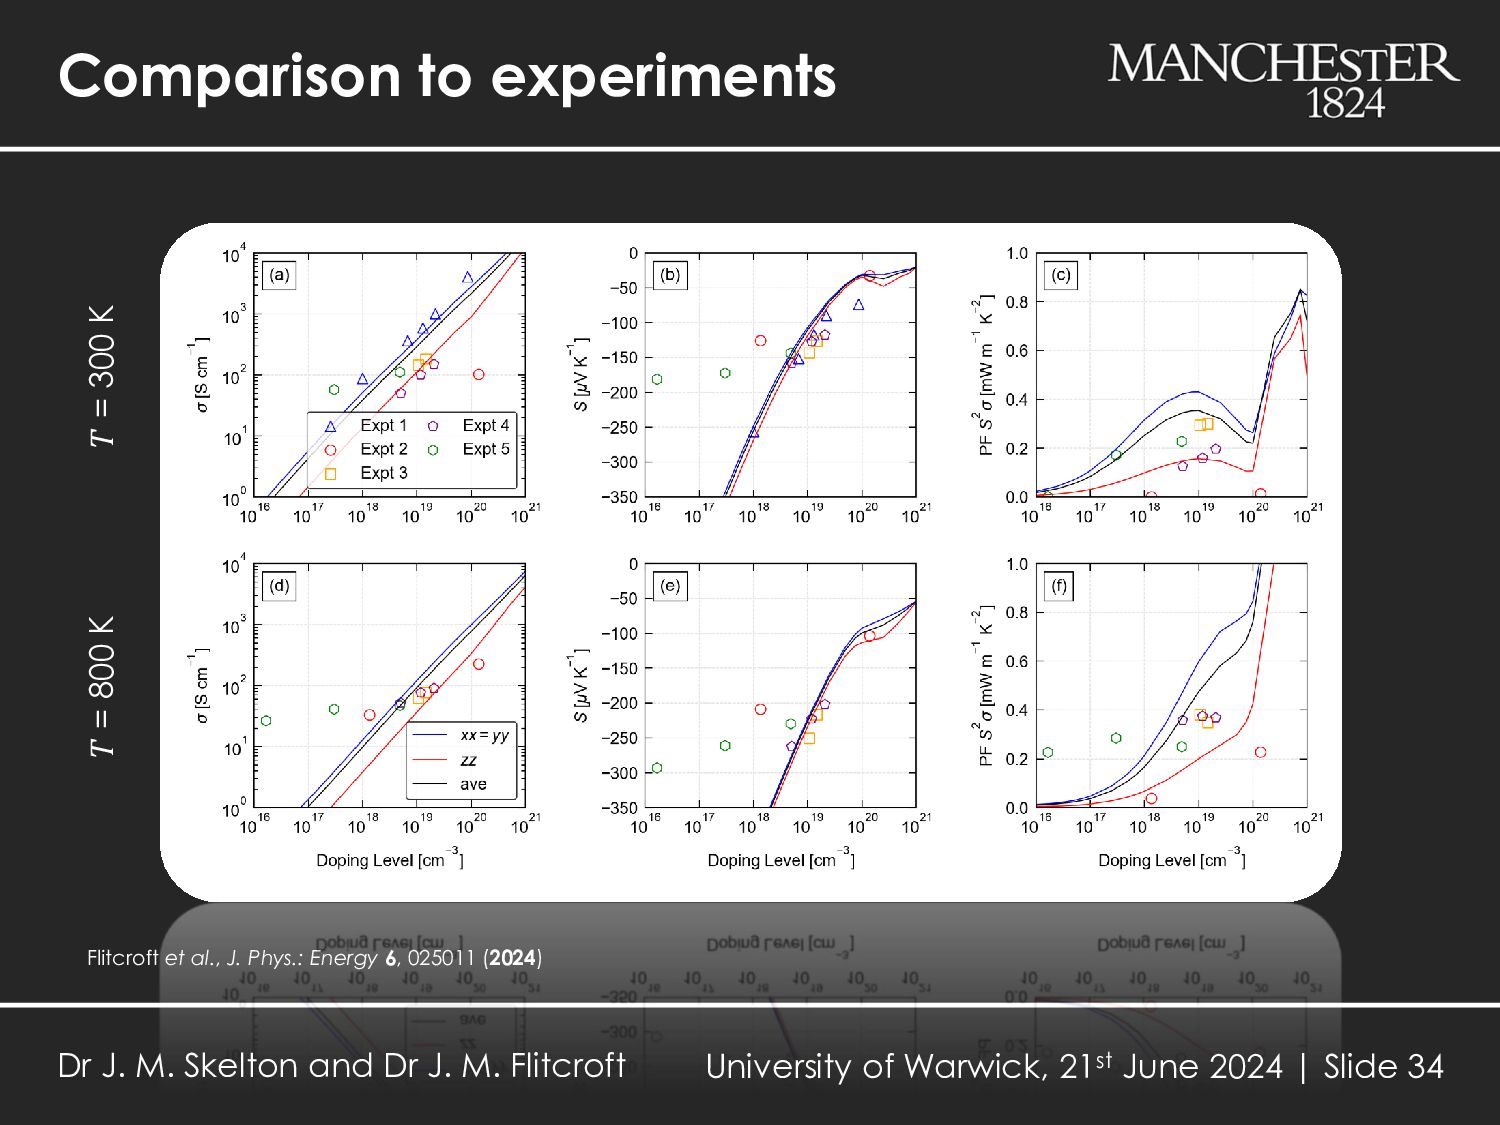
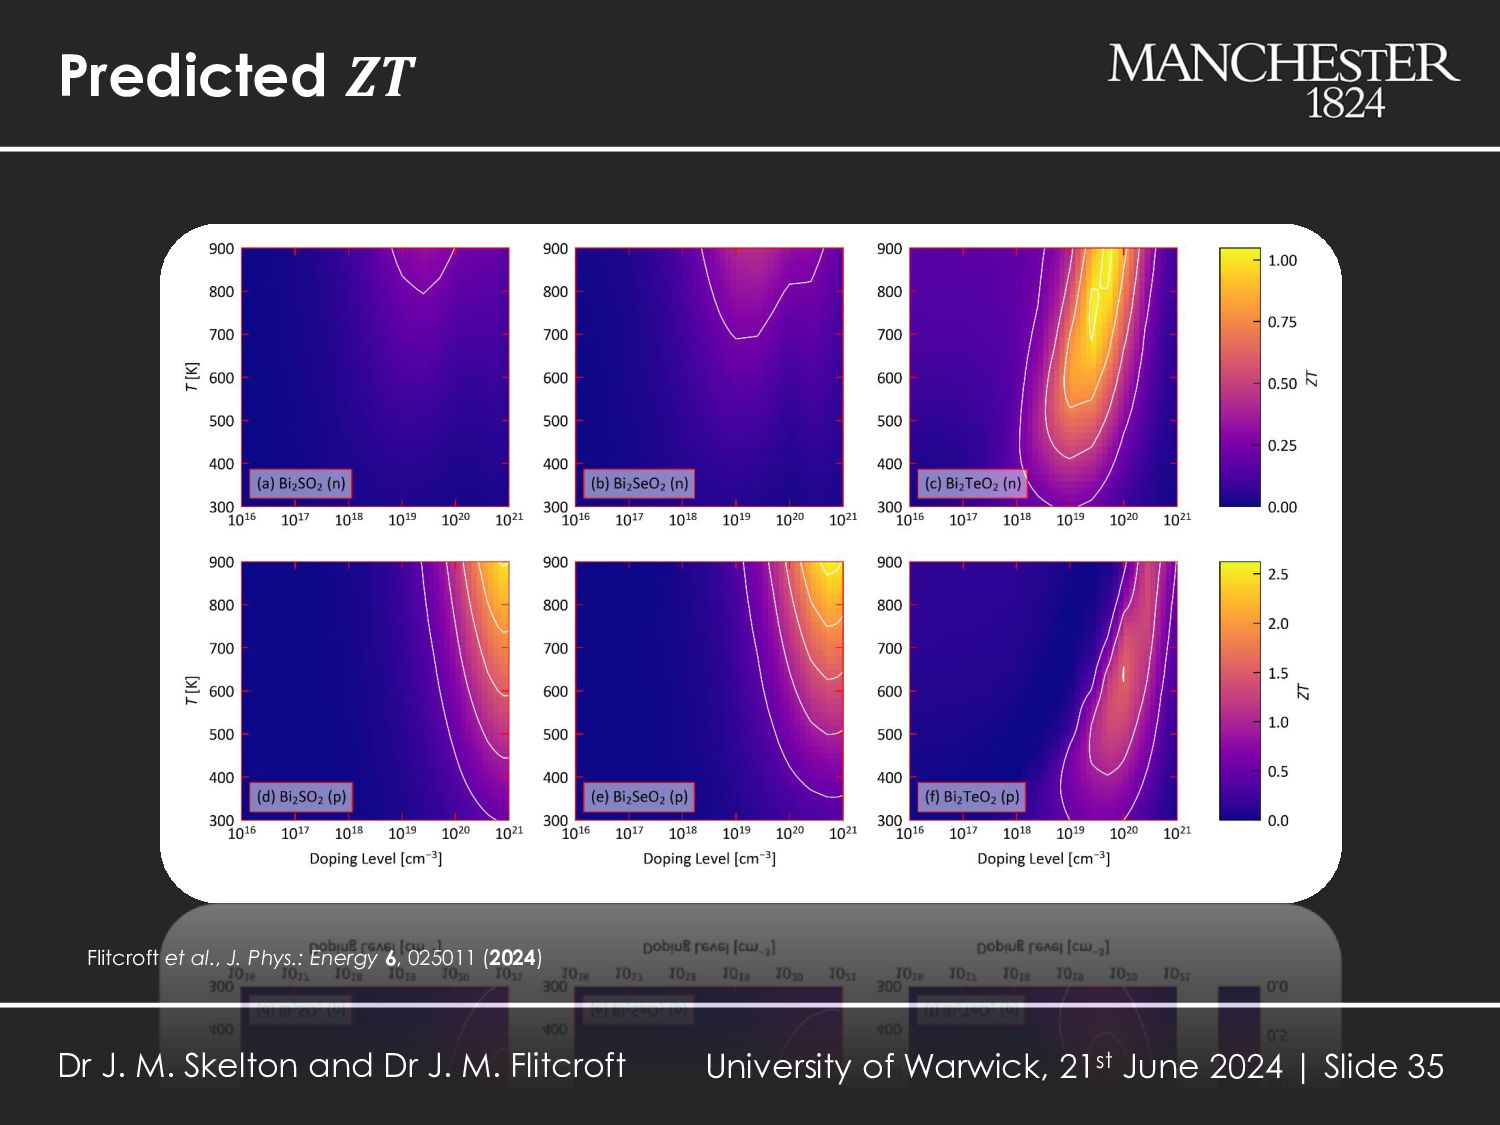
𝜎 and low 𝜅 = 𝜅latt + 𝜅el The 𝜅latt can be modelled using the single-mode relaxation-time approximation: o Provides microscopic insight at the level of individual phonon modes o Analysis procedure to determine how differences in 𝑣𝜆 , 𝜏𝜆 , ෨ 𝑃 and ෩ 𝑁2 underpin differences in 𝜅latt between materials o 𝜅latt of flagship IV-VI chalcogenide TEs is a balance of inhomogeneous chemical bonding and anharmonicity introduced by tetrel lone pair activity The 𝑆, 𝜎 and 𝜅el calculated from electronic-structure calculations and approximate models for the 𝜏el : o Reproduce experiments reasonably well, taking into account sample variation o Can be used to explore p- and n-type doping over a wide range of carrier concentrations and “untangle” the interdependence of the 𝑆, 𝜎, 𝜅el and 𝑛 Microscopic insight from the models, and useful predictive accuracy, allow this approach to be used to identify and characterise novel TEs Dr J. M. Skelton and Dr J. M. Flitcroft University of Warwick, 21st June 2024 | Slide 39
![Group velocities vs. lifetimes 𝜅𝐥𝐚𝐭𝐭 [W m-1 K-1] Τ 𝜅𝐥𝐚𝐭𝐭](https://files.speakerdeck.com/presentations/dce508018736494da9036846652e650f/slide_12.jpg)
![Group velocities vs. lifetimes 𝜅𝐥𝐚𝐭𝐭 [W m-1 K-1] Τ 𝜅𝐥𝐚𝐭𝐭](https://files.speakerdeck.com/presentations/dce508018736494da9036846652e650f/slide_14.jpg)
![Anharmonicity vs. “selection rules” 𝝉𝐂𝐑𝐓𝐀 [ps] ෩ 𝑷 × 𝟑𝒏𝒂](https://files.speakerdeck.com/presentations/dce508018736494da9036846652e650f/slide_18.jpg)
![Oxychalcogenides: Bi2 ChO2 𝒂 [Å] 𝒃 [Å] 𝒄 [Å] 𝑽](https://files.speakerdeck.com/presentations/dce508018736494da9036846652e650f/slide_27.jpg)
![Lattice thermal conductivity 𝑇 [K] 𝜅(Calc.) [Wm-1K-1] 𝜅(Expt.) [Wm-1K-1] Bi2](https://files.speakerdeck.com/presentations/dce508018736494da9036846652e650f/slide_28.jpg)
![Predicted 𝒁𝑻 𝒁𝑻 𝒏 [cm-3] 𝑻 [K] 𝝈 [S cm-1]](https://files.speakerdeck.com/presentations/dce508018736494da9036846652e650f/slide_35.jpg)