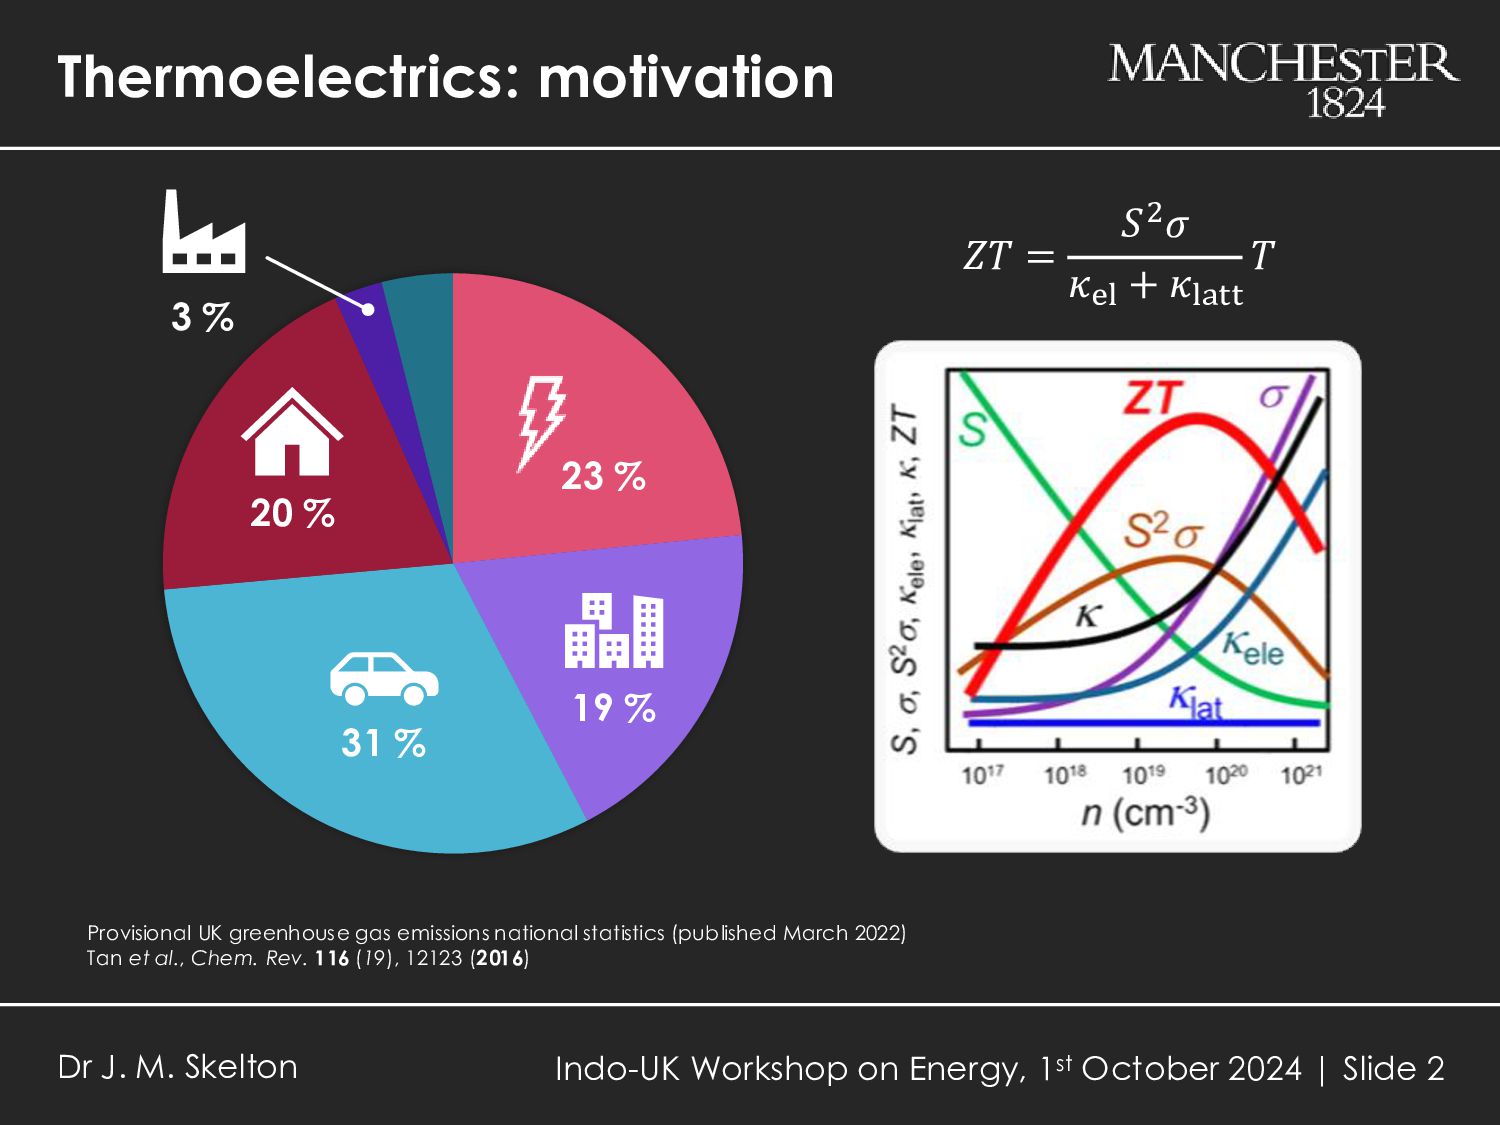
3 % Provisional UK greenhouse gas emissions national statistics (published March 2022) Tan et al., Chem. Rev. 116 (19), 12123 (2016) Dr J. M. Skelton Indo-UK Workshop on Energy, 1st October 2024 | Slide 2 𝑍𝑇 = 𝑆2𝜎 𝜅el + 𝜅latt 𝑇
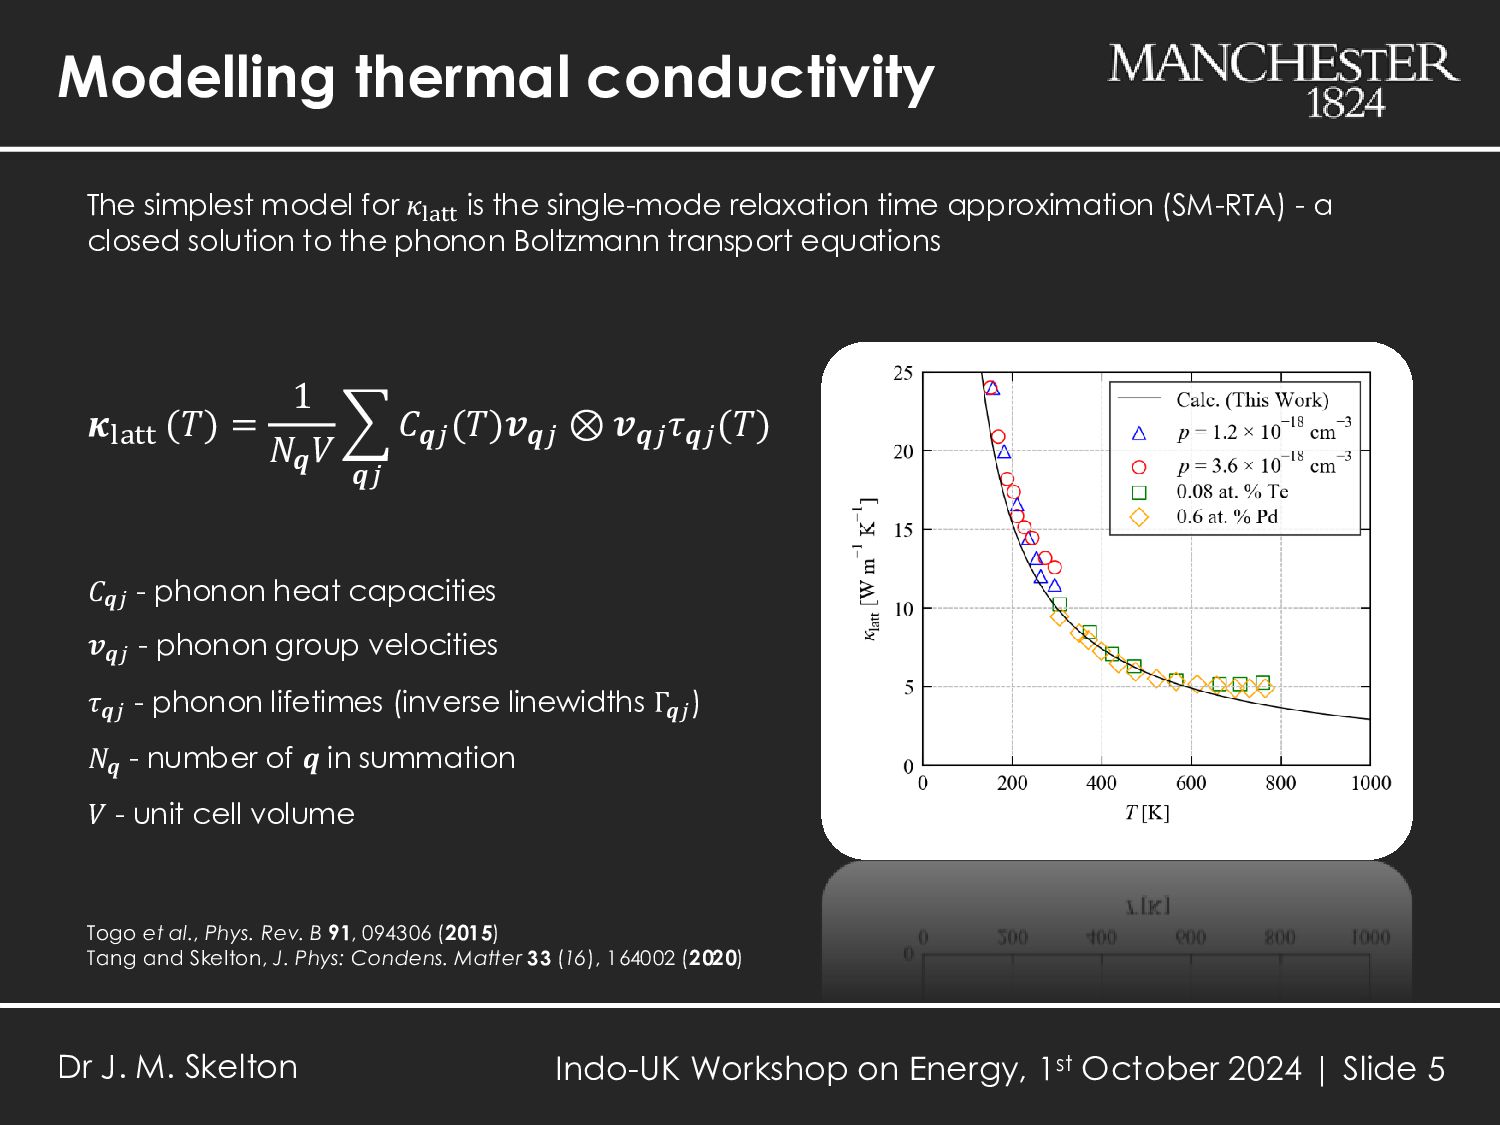
single-mode relaxation time approximation (SM-RTA) - a closed solution to the phonon Boltzmann transport equations 𝜿latt (𝑇) = 1 𝑁𝒒 𝑉 𝒒𝑗 𝐶𝒒𝑗 (𝑇)𝒗𝒒𝑗 ⊗ 𝒗𝒒𝑗 𝜏𝒒𝑗 (𝑇) 𝐶𝒒𝑗 - phonon heat capacities 𝒗𝒒𝑗 - phonon group velocities 𝜏𝒒𝑗 - phonon lifetimes (inverse linewidths Γ𝒒𝑗 ) 𝑁𝒒 - number of 𝒒 in summation 𝑉 - unit cell volume Togo et al., Phys. Rev. B 91, 094306 (2015) Tang and Skelton, J. Phys: Condens. Matter 33 (16), 164002 (2020) Dr J. M. Skelton Indo-UK Workshop on Energy, 1st October 2024 | Slide 5
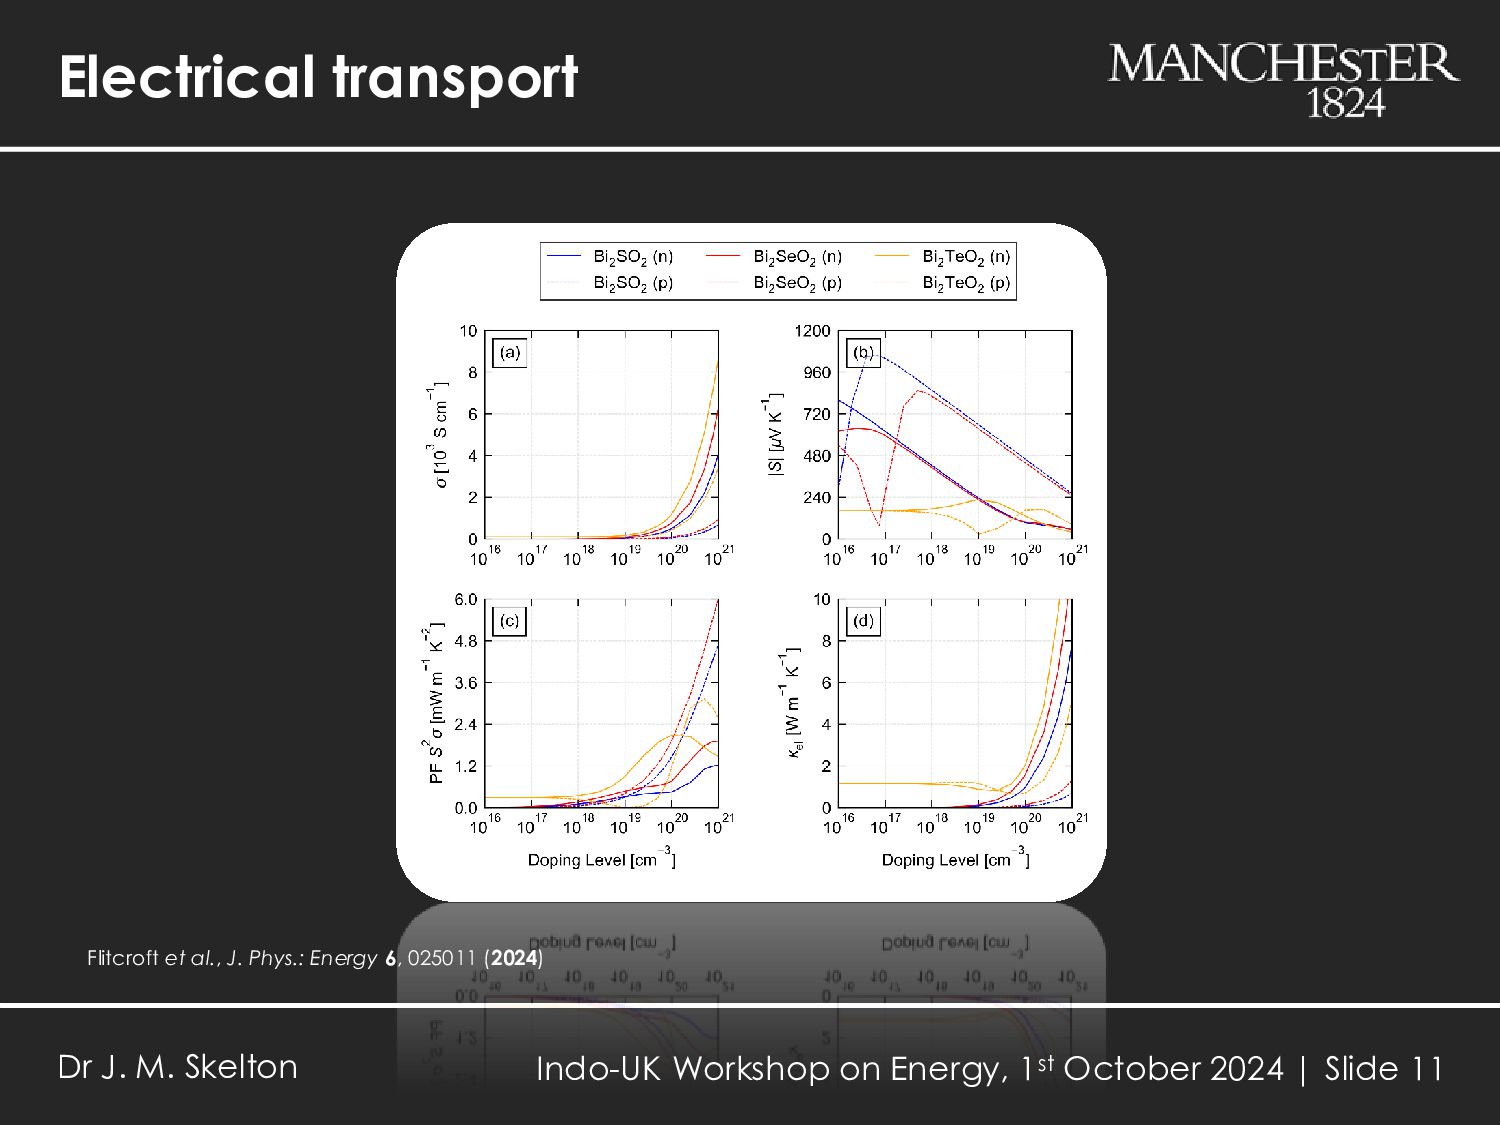
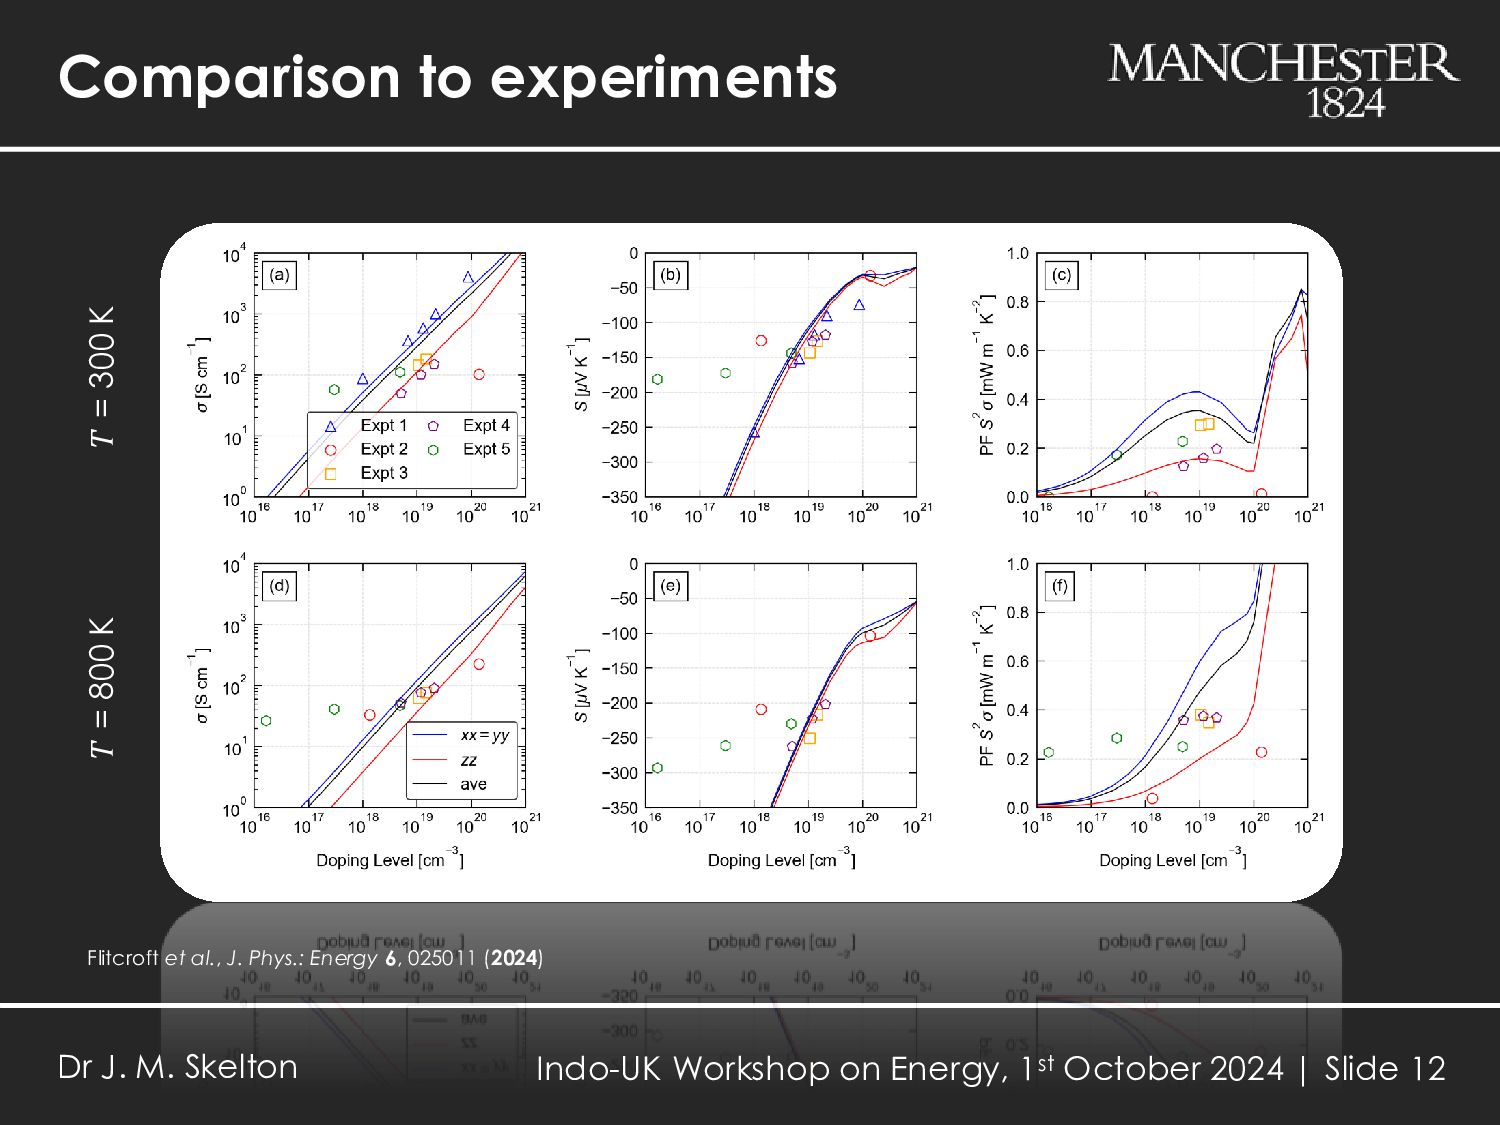
SO2 300 2.62 2.9 Bi2 SeO2 800 0.97 0.71 Bi2 TeO2 300 0.95 0.91 Flitcroft et al., J. Phys.: Energy 6, 025011 (2024) Zhang et al., J. Mater. Chem. C 7, 14986 (2019) Pan et al., Nano Energy 69, 104394 (2020) Luu and Vaqueiro, J. Solid State Chen. 226, 219 (2015) Dr J. M. Skelton Indo-UK Workshop on Energy, 1st October 2024 | Slide 6
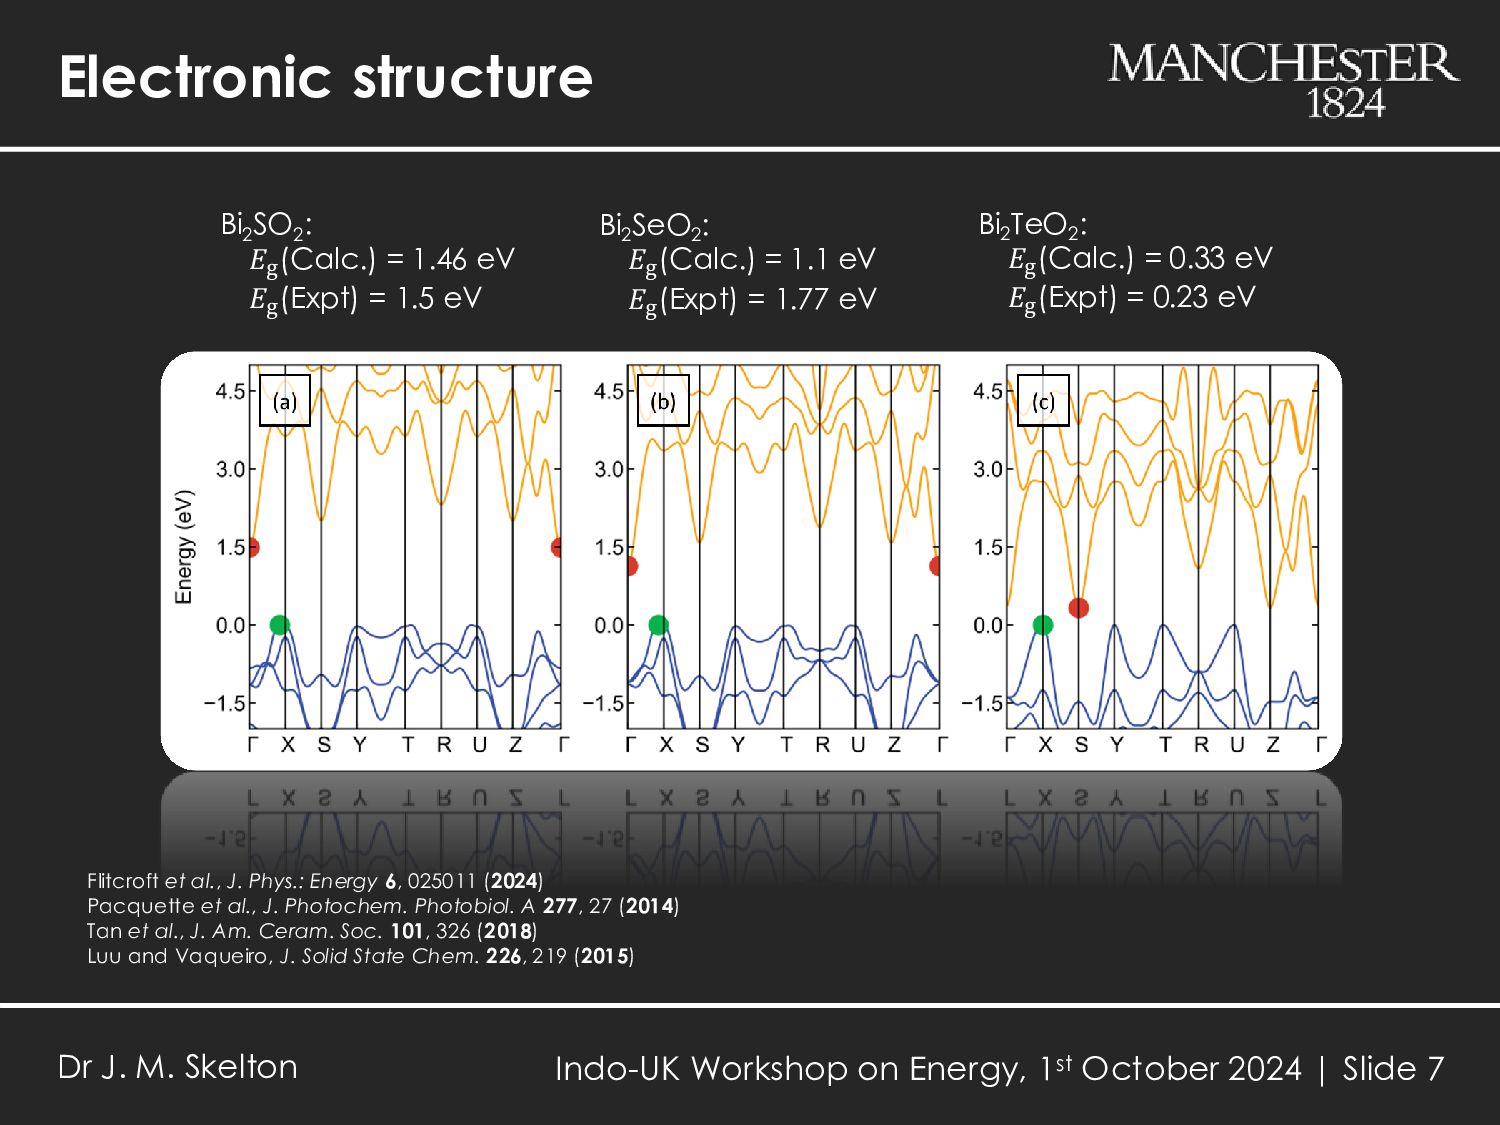
(2024) Pacquette et al., J. Photochem. Photobiol. A 277, 27 (2014) Tan et al., J. Am. Ceram. Soc. 101, 326 (2018) Luu and Vaqueiro, J. Solid State Chem. 226, 219 (2015) Bi2 SO2 : 𝐸g (Calc.) = 1.46 eV 𝐸g (Expt) = 1.5 eV Bi2 SeO2 : 𝐸g (Calc.) = 1.1 eV 𝐸g (Expt) = 1.77 eV Bi2 TeO2 : 𝐸g (Calc.) = 0.33 eV 𝐸g (Expt) = 0.23 eV Dr J. M. Skelton Indo-UK Workshop on Energy, 1st October 2024 | Slide 7
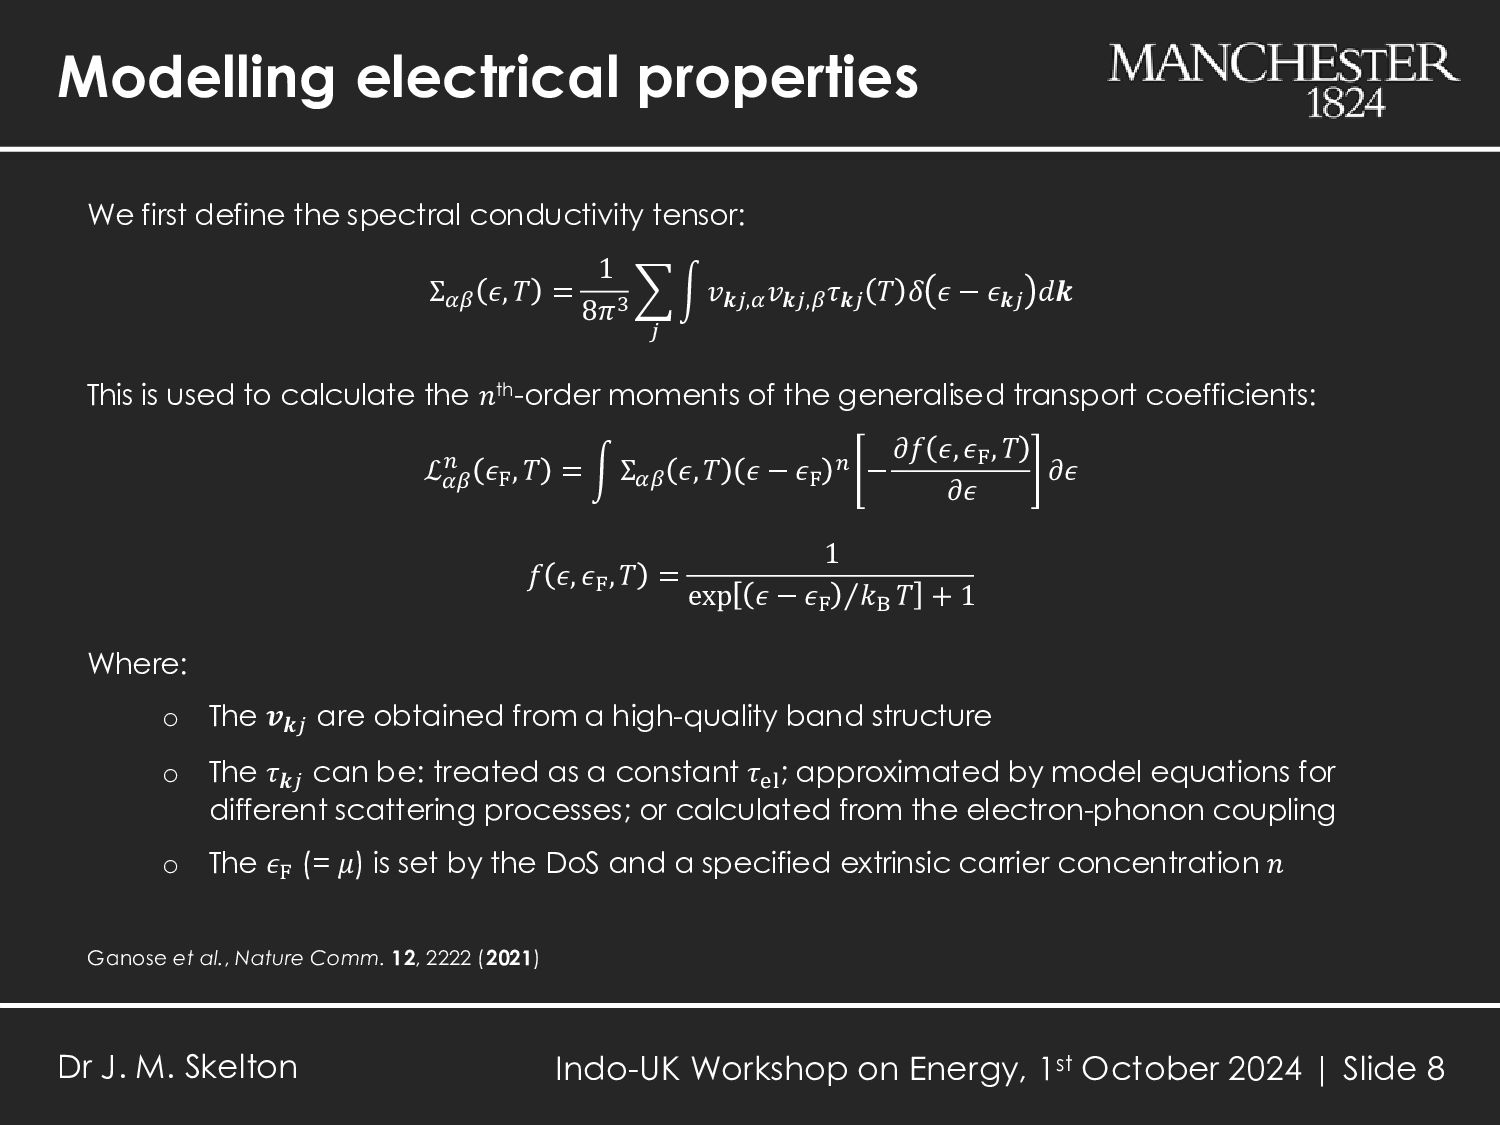
(2021) We first define the spectral conductivity tensor: Σ𝛼𝛽 𝜖, 𝑇 = 1 8𝜋3 𝑗 න𝑣𝒌𝑗,𝛼 𝑣𝒌𝑗,𝛽 𝜏𝒌𝑗 𝑇 𝛿 𝜖 − 𝜖𝒌𝑗 𝑑𝒌 This is used to calculate the 𝑛th-order moments of the generalised transport coefficients: ℒ𝛼𝛽 𝑛 𝜖F , 𝑇 = න Σ𝛼𝛽 𝜖, 𝑇 𝜖 − 𝜖F 𝑛 − 𝜕𝑓 𝜖, 𝜖F , 𝑇 𝜕𝜖 𝜕𝜖 𝑓 𝜖, 𝜖F , 𝑇 = 1 exp Τ 𝜖 − 𝜖F 𝑘B 𝑇 + 1 Where: o The 𝒗𝒌𝑗 are obtained from a high-quality band structure o The 𝜏𝒌𝑗 can be: treated as a constant 𝜏el ; approximated by model equations for different scattering processes; or calculated from the electron-phonon coupling o The 𝜖F (= 𝜇) is set by the DoS and a specified extrinsic carrier concentration 𝑛 Dr J. M. Skelton Indo-UK Workshop on Energy, 1st October 2024 | Slide 8
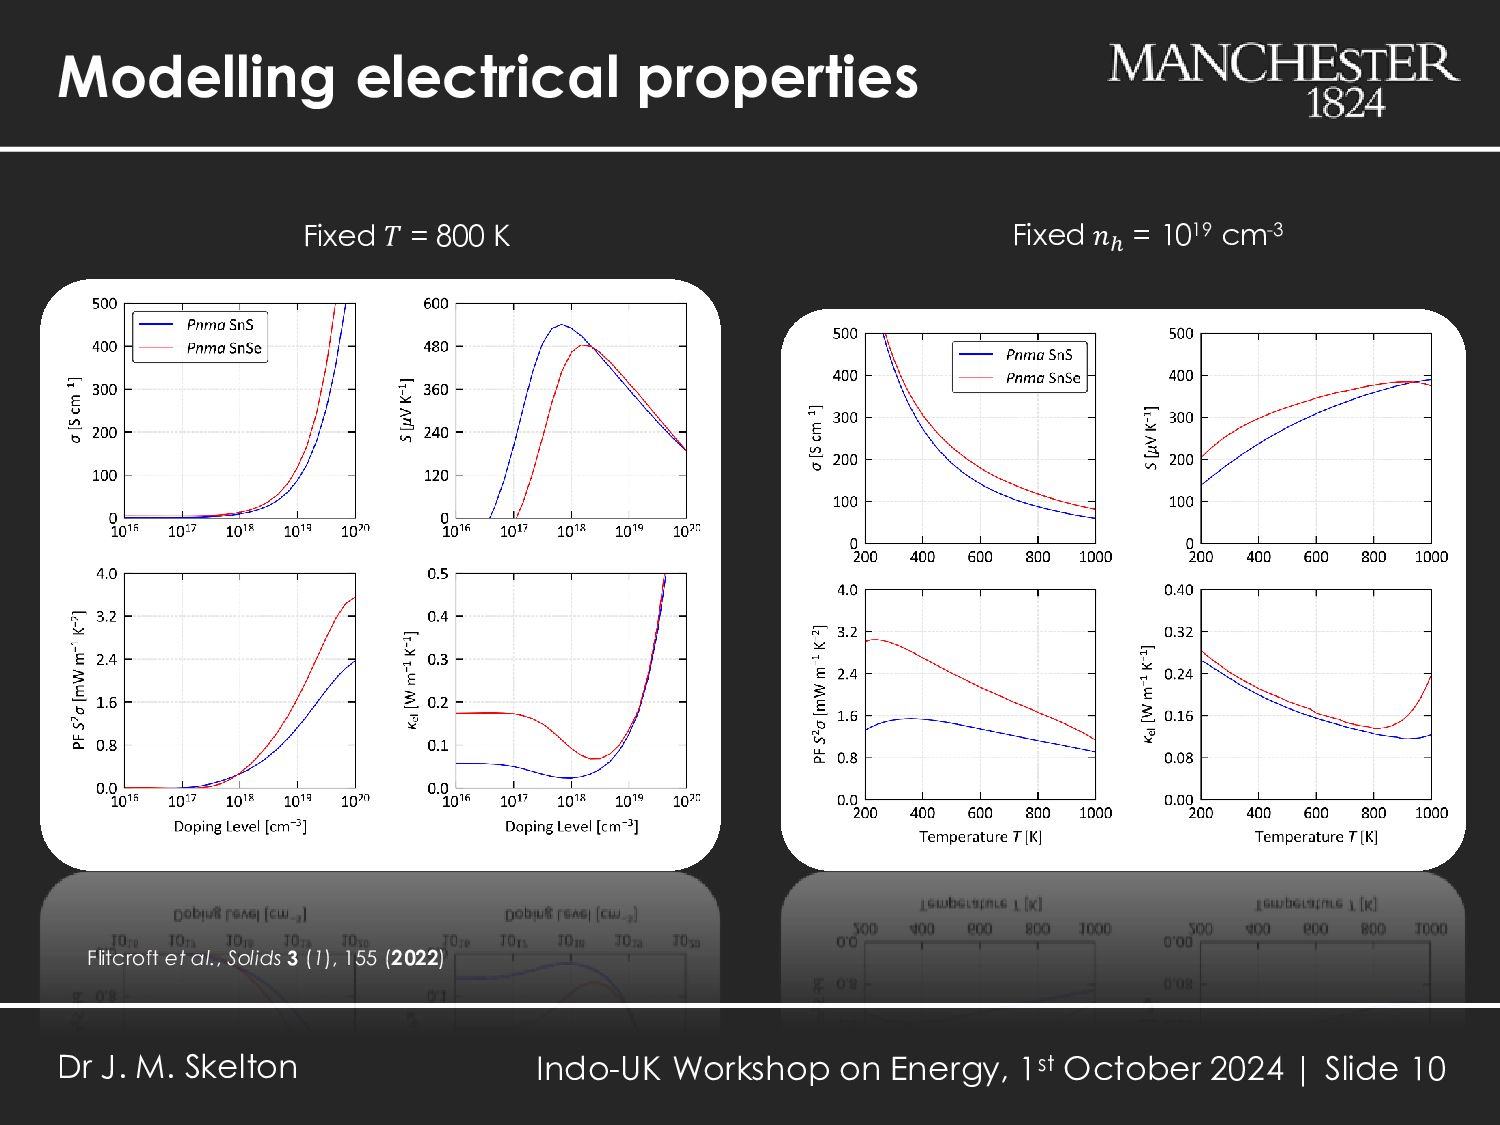
a band structure, a model for the 𝜏𝑗𝒌 , and a specified 𝑛/𝑇: ℒ𝛼𝛽 𝑛 𝜖F , 𝑇 = නΣ𝛼𝛽 𝜖, 𝑇 𝜖 − 𝜖F 𝑛 − 𝜕𝑓 𝜖, 𝜖F , 𝑇 𝜕𝜖 𝜕𝜖 The electrical transport coefficients can be determined from the 𝓛𝑛(𝜖F , 𝑇) as: 𝜎𝛼𝛽 (𝜖F , 𝑇) = ℒ𝛼𝛽 0 (𝜖F , 𝑇) 𝑆𝛼𝛽 (𝜖F , 𝑇) = 1 𝑒𝑇 ℒ𝛼𝛽 1 (𝜖F , 𝑇) ℒ𝛼𝛽 0 (𝜖F , 𝑇) 𝜅el,𝛼𝛽 (𝜖F , 𝑇) = 1 𝑒2𝑇 ℒ𝛼𝛽 1 (𝜖F , 𝑇) 2 ℒ𝛼𝛽 0 (𝜖F , 𝑇) − ℒ𝛼𝛽 2 (𝜖F , 𝑇) Note that when using the CRTA (i.e. 𝜏𝒌𝑗 → 𝜏el ): o The 𝑺 are the ratio of two 𝓛𝑛 and the 𝜏el cancel o The 𝝈 and 𝜿el are obtained with respect to 𝜏el (𝜏el ~ 10-14 s) Ganose et al., Nature Comm. 12, 2222 (2021) Dr J. M. Skelton Indo-UK Workshop on Energy, 1st October 2024 | Slide 9
𝜎 and low 𝜅 = 𝜅latt + 𝜅el The 𝜅latt can be modelled using the single-mode relaxation-time approximation: o Provides microscopic insight at the level of individual phonon modes The 𝑆, 𝜎 and 𝜅el calculated from electronic-structure calculations and approximate models for the 𝜏el : o Can reproduce experiments reasonably well, taking into account sample variation o Can be used to explore p- and n-type doping over a wide range of carrier concentrations and “untangle” the interdependence of the 𝑆, 𝜎, 𝜅el and 𝑛 Microscopic insight from the models, and useful predictive accuracy, allow this approach to be used to identify and characterise novel TEs Dr J. M. Skelton Indo-UK Workshop on Energy, 1st October 2024 | Slide 15
![Dr Jonathan Skelton Department of Chemistry, University of Manchester ([email protected])](https://files.speakerdeck.com/presentations/424a9d60a9ac4f4da97dae2c5c6cbce9/slide_0.jpg)
![Oxychalcogenides: Bi2 ChO2 𝒂 [Å] 𝒃 [Å] 𝒄 [Å] 𝑽](https://files.speakerdeck.com/presentations/424a9d60a9ac4f4da97dae2c5c6cbce9/slide_3.jpg)
![Lattice thermal conductivity 𝑇 [K] 𝜅(Calc.) [Wm-1K-1] 𝜅(Expt.) [Wm-1K-1] Bi2](https://files.speakerdeck.com/presentations/424a9d60a9ac4f4da97dae2c5c6cbce9/slide_5.jpg)
![Predicted 𝒁𝑻 𝒁𝑻 𝒏 [cm-3] 𝑻 [K] 𝝈 [S cm-1]](https://files.speakerdeck.com/presentations/424a9d60a9ac4f4da97dae2c5c6cbce9/slide_13.jpg)