Upgrade to Pro — share decks privately, control downloads, hide ads and more …

The Truth About Your Web App's Performance

The Truth About Your Web App's Performance

From the 2015 University of Illinois Web Conference

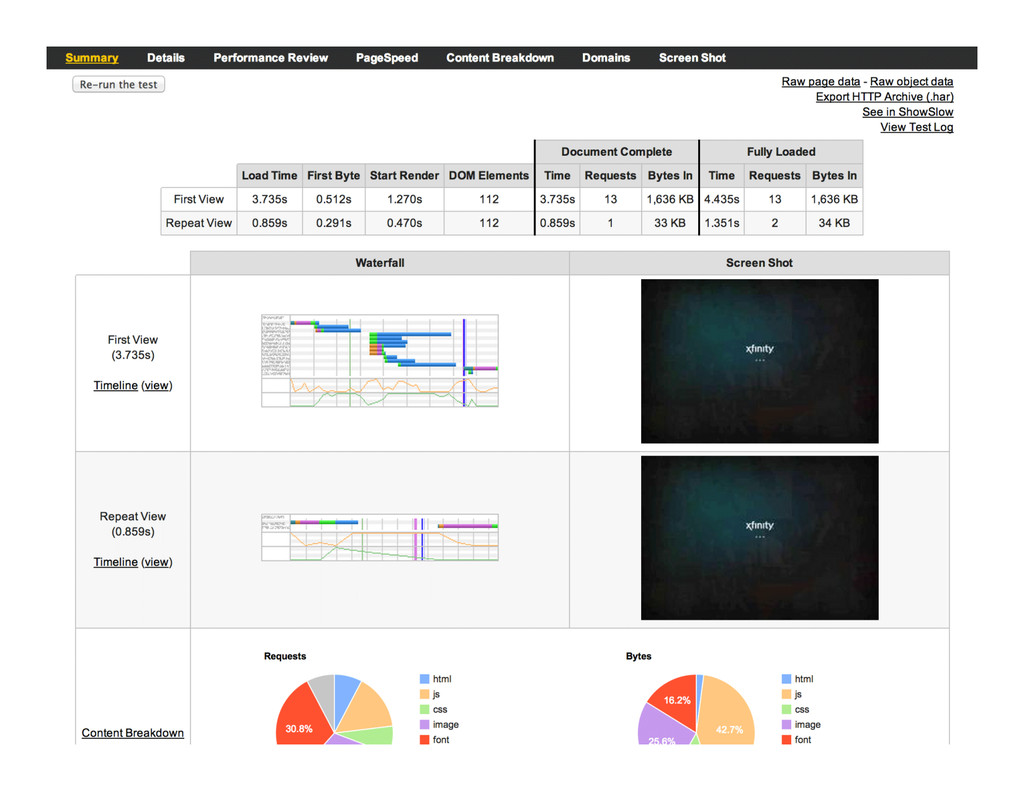
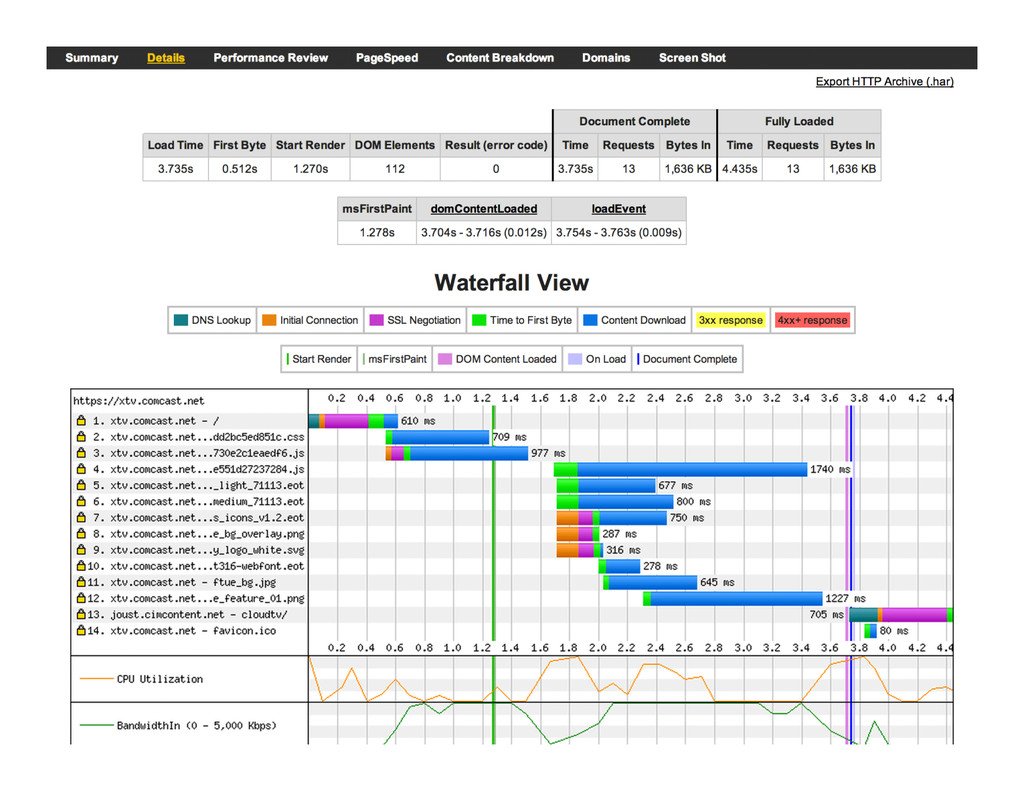
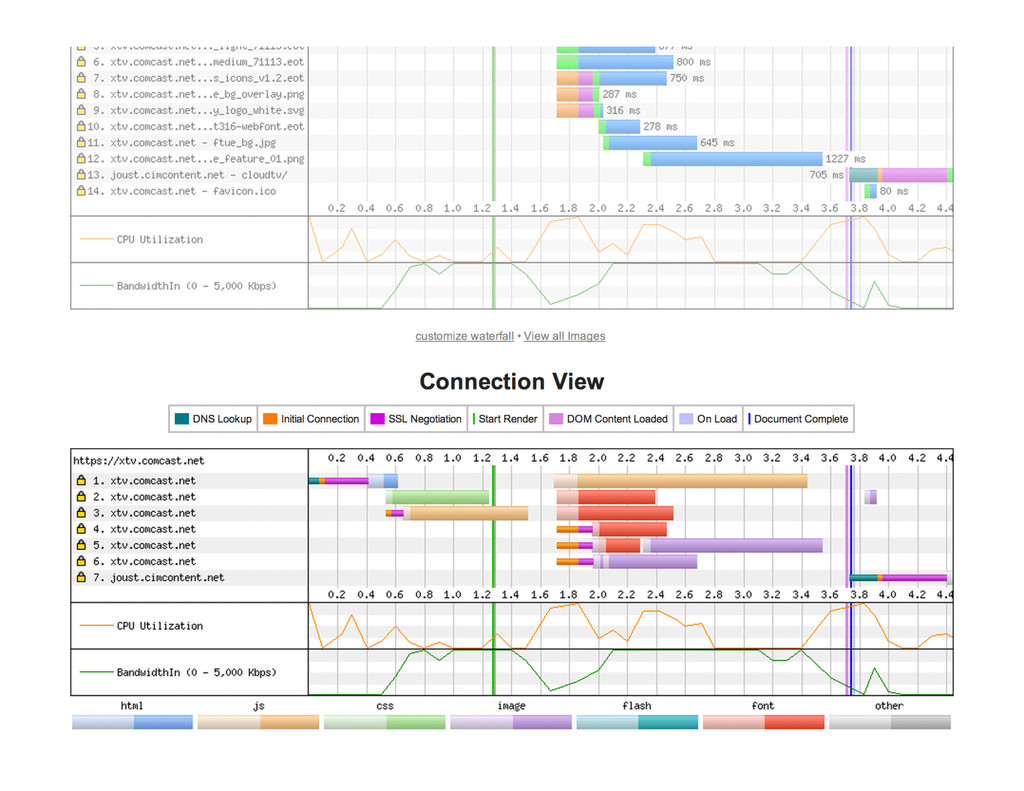
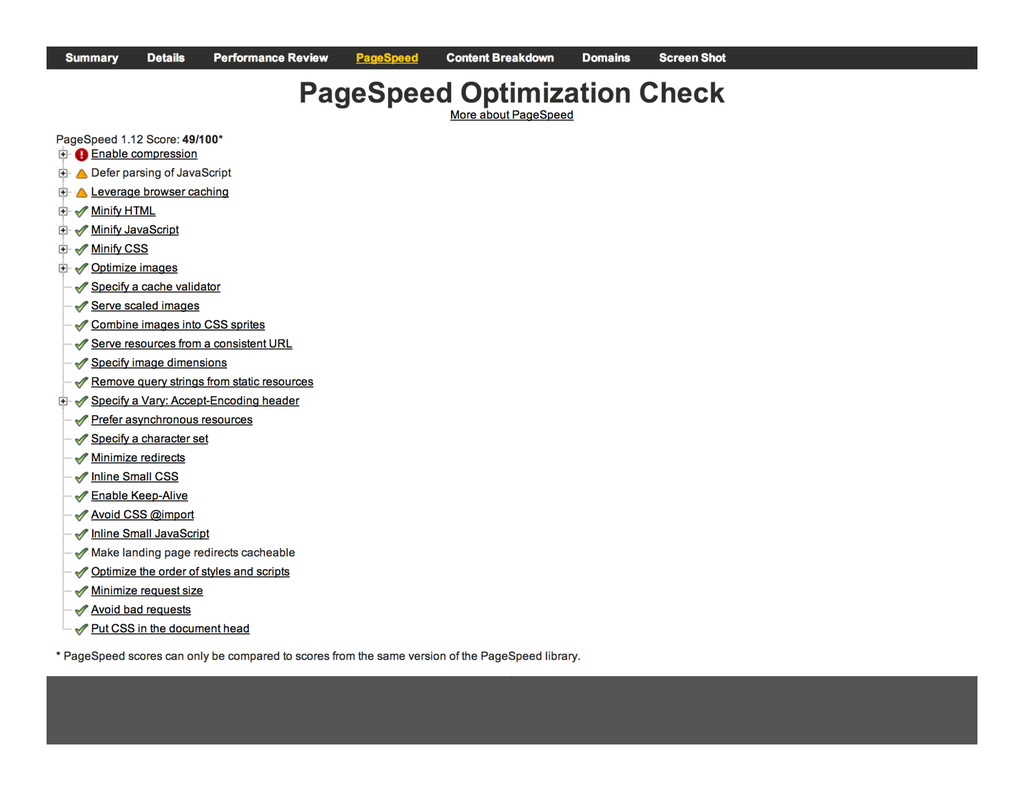
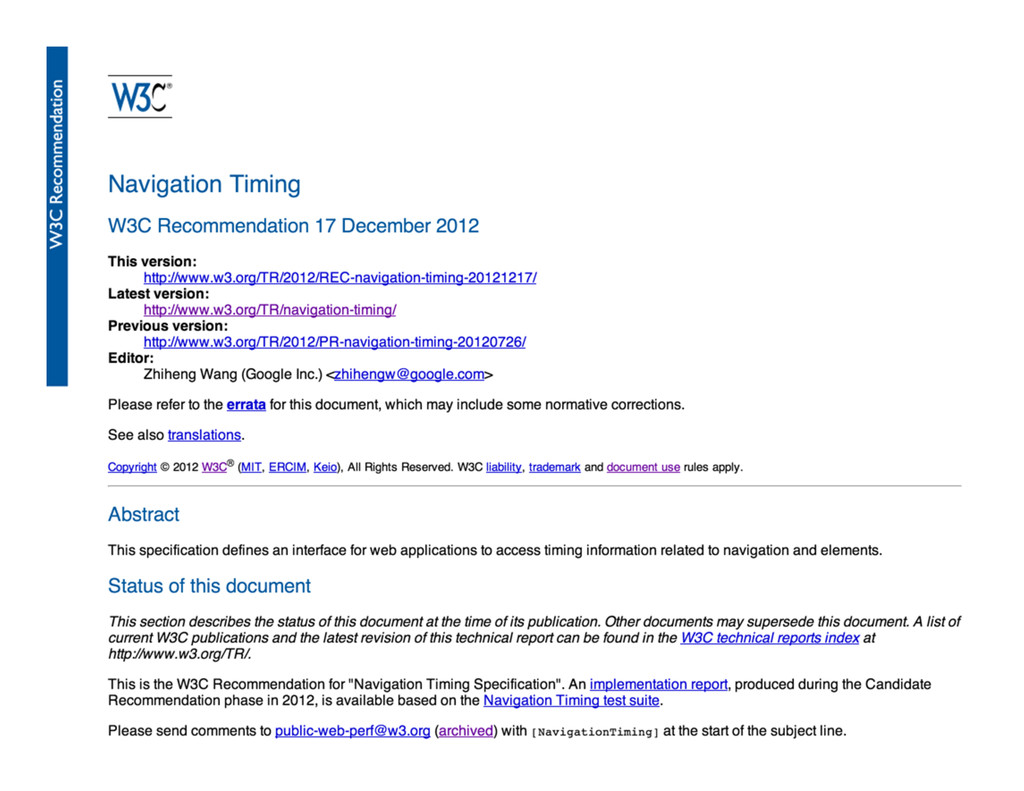
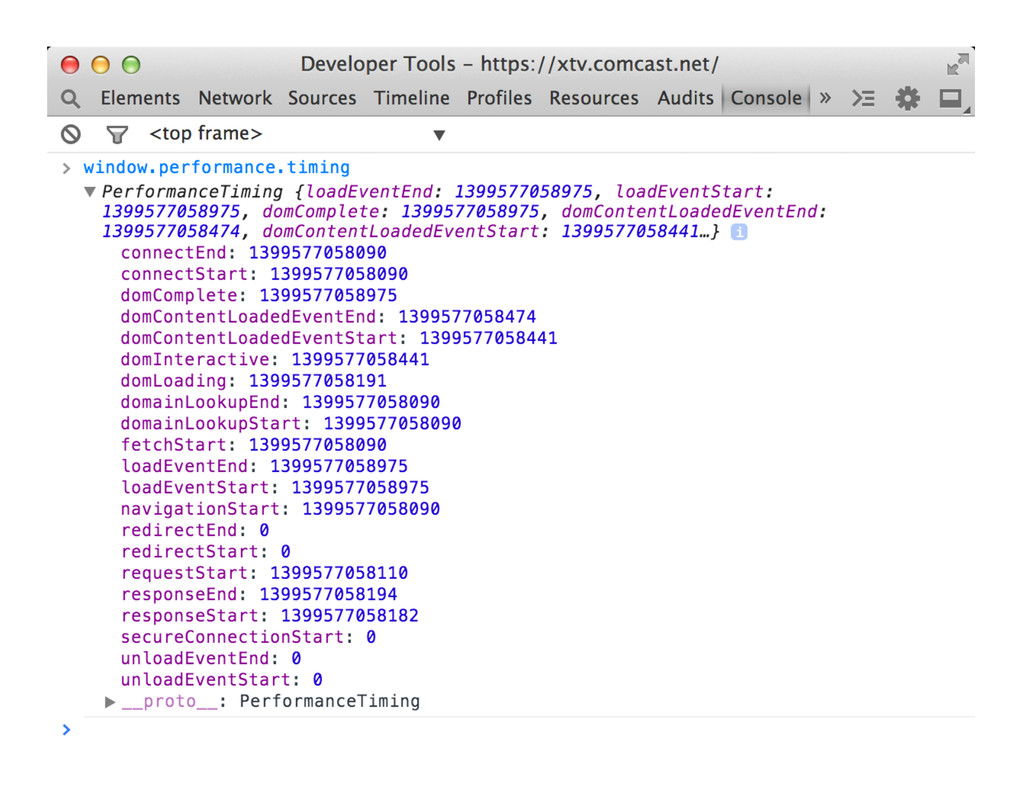
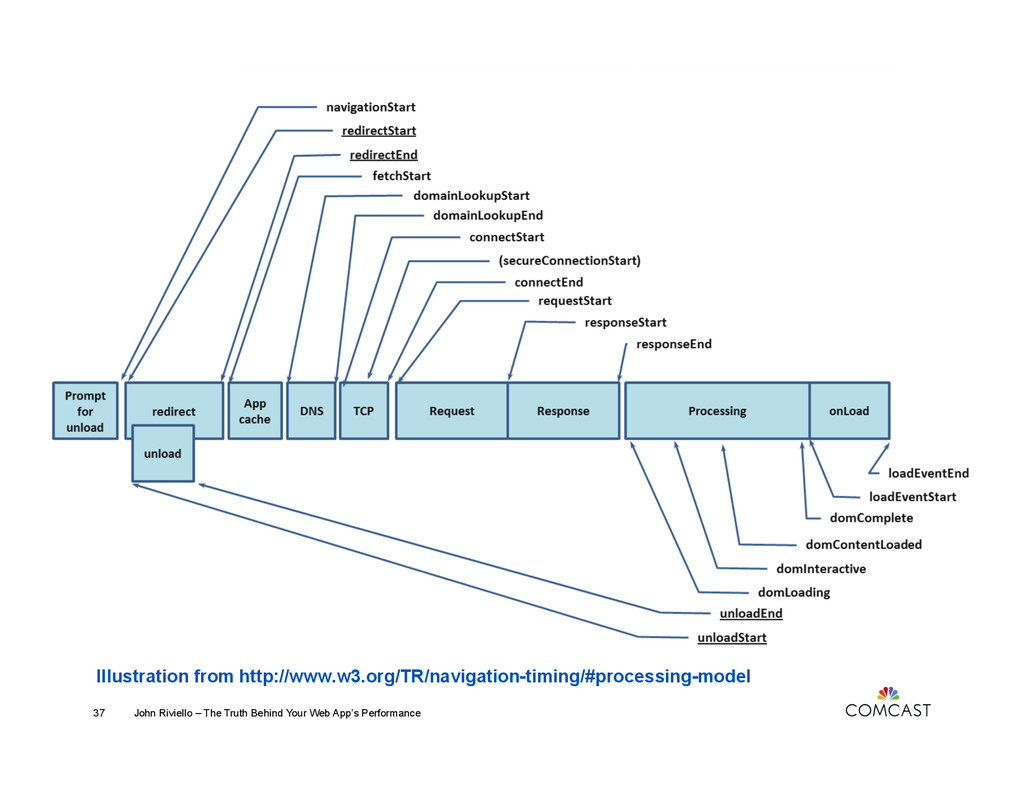
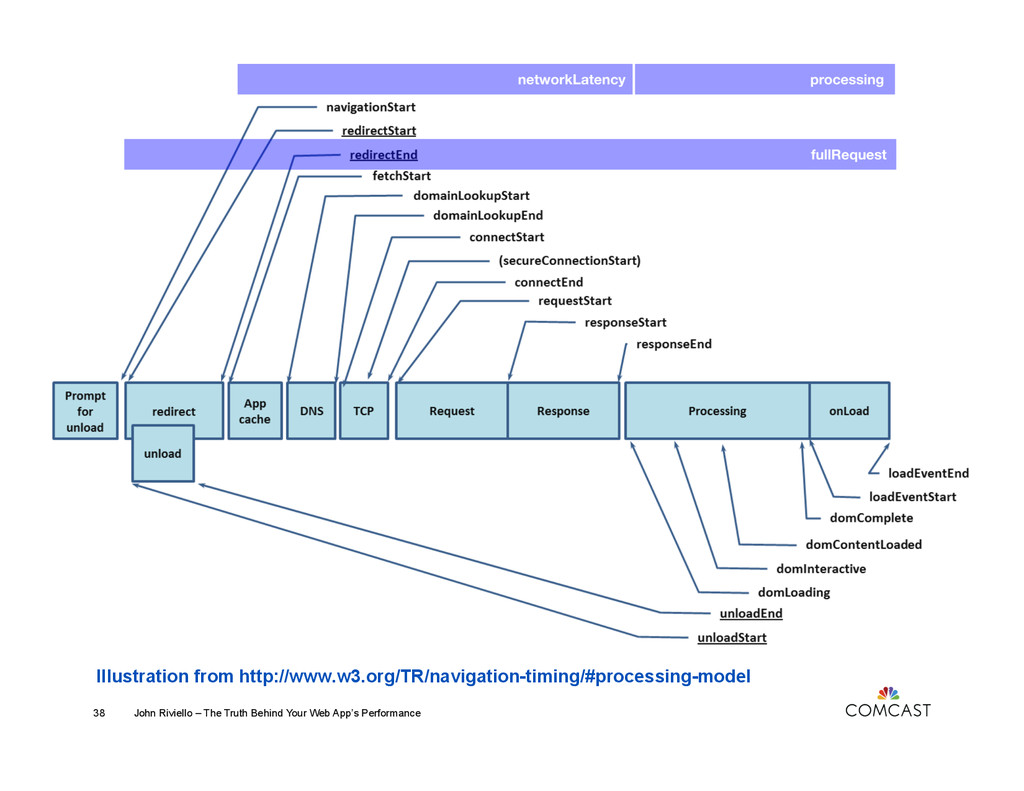
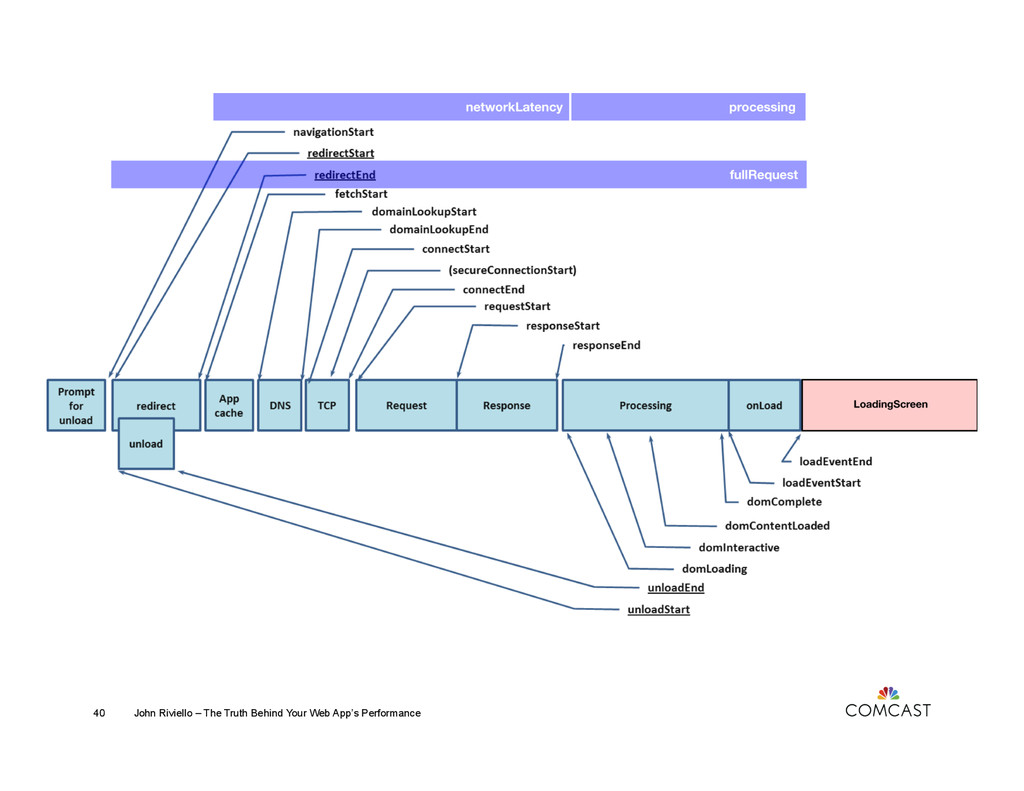
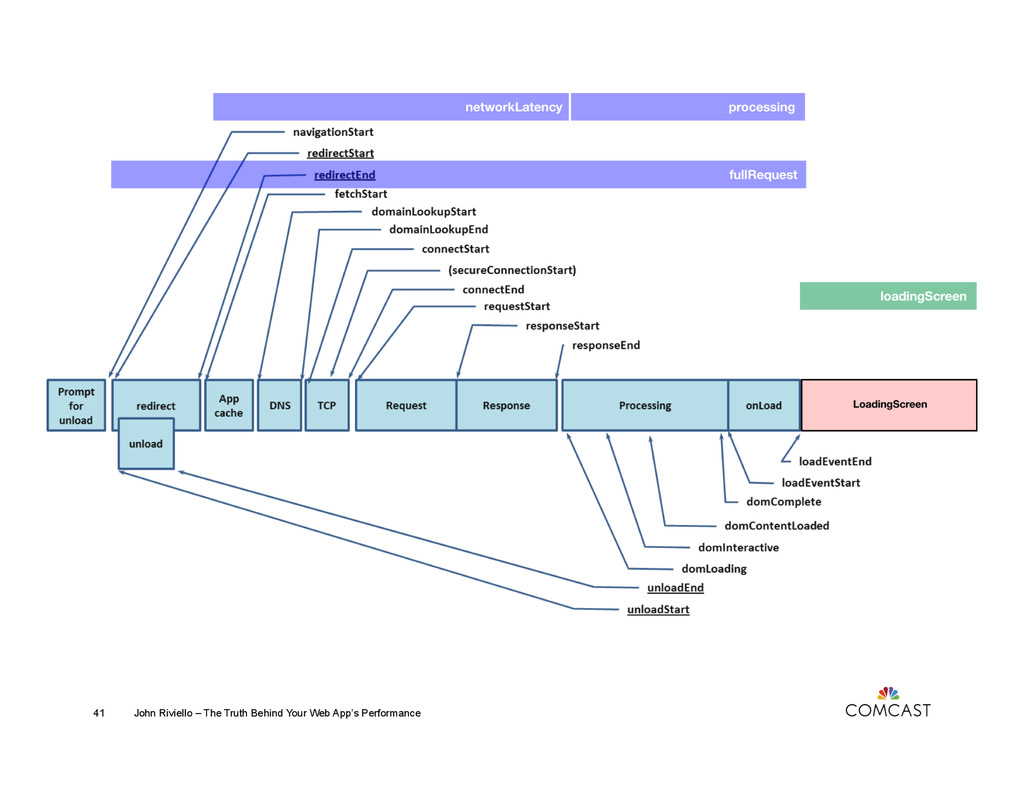
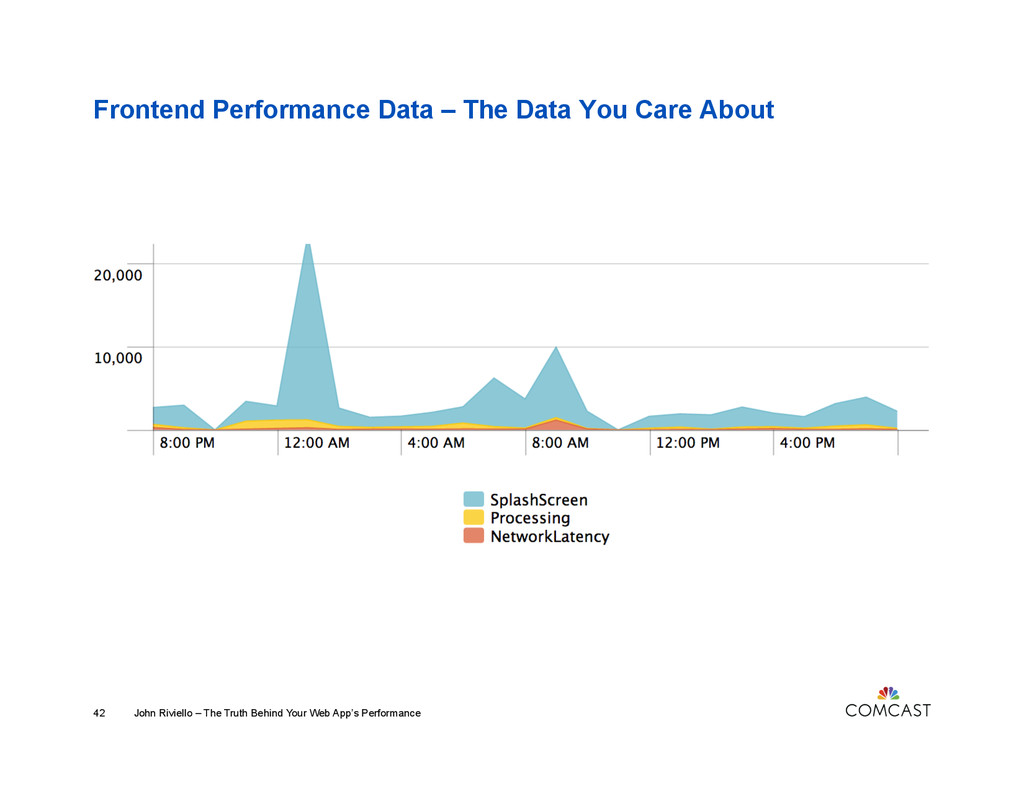
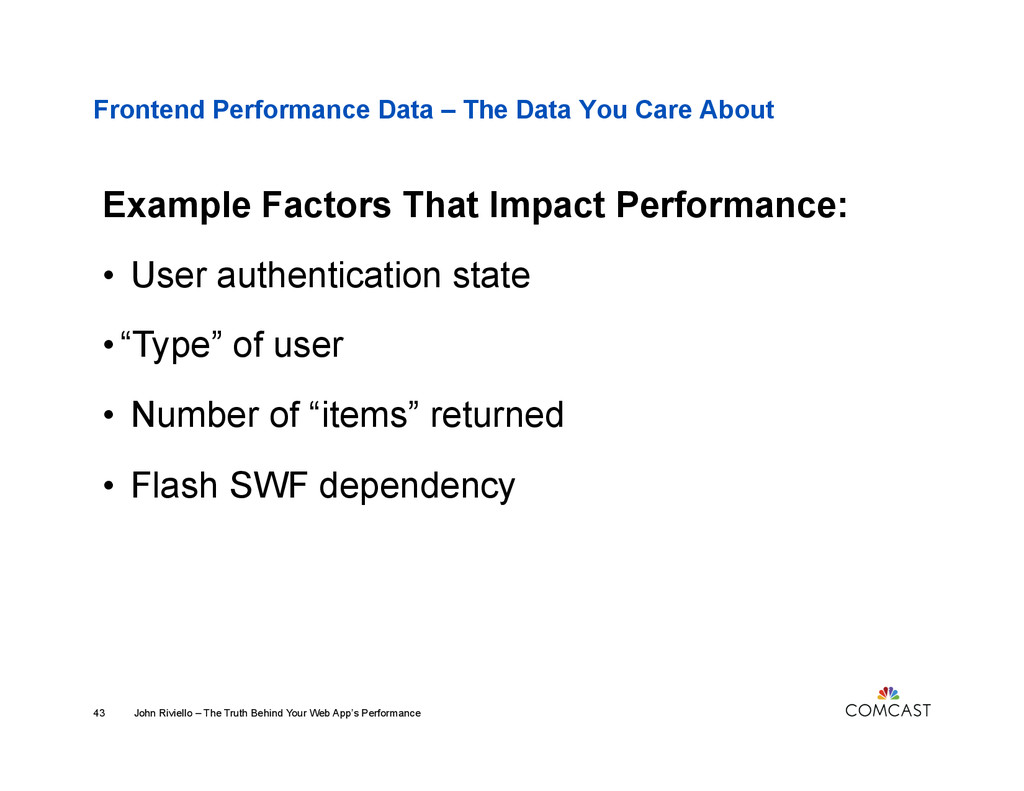
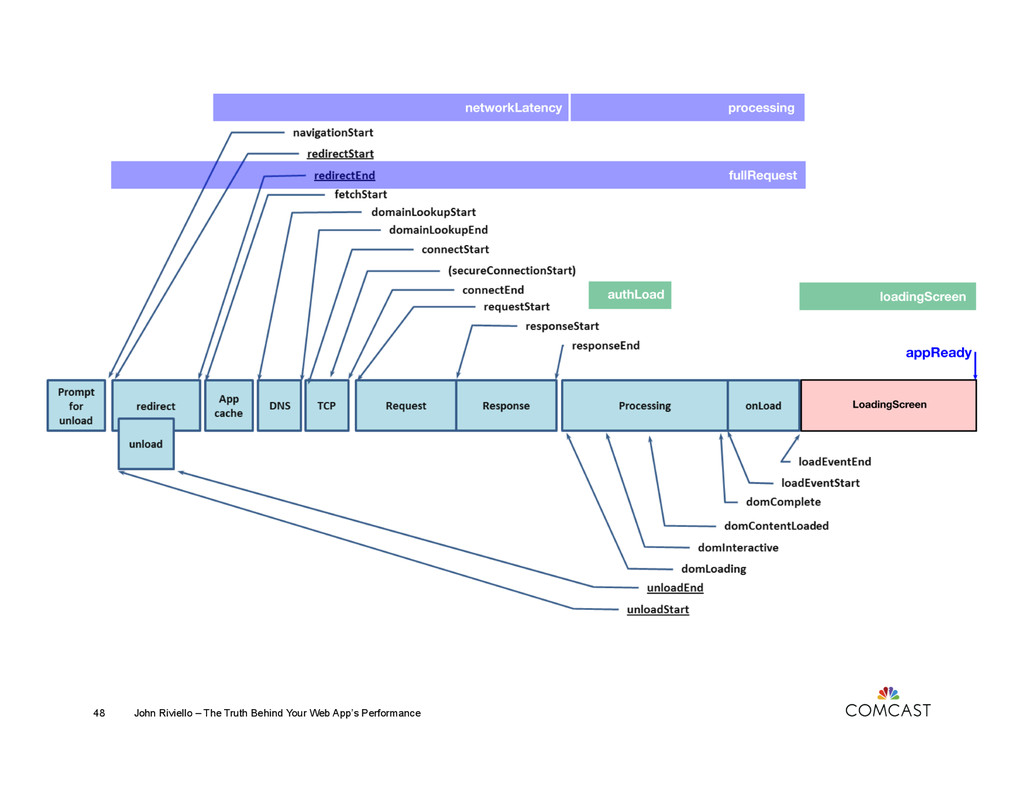
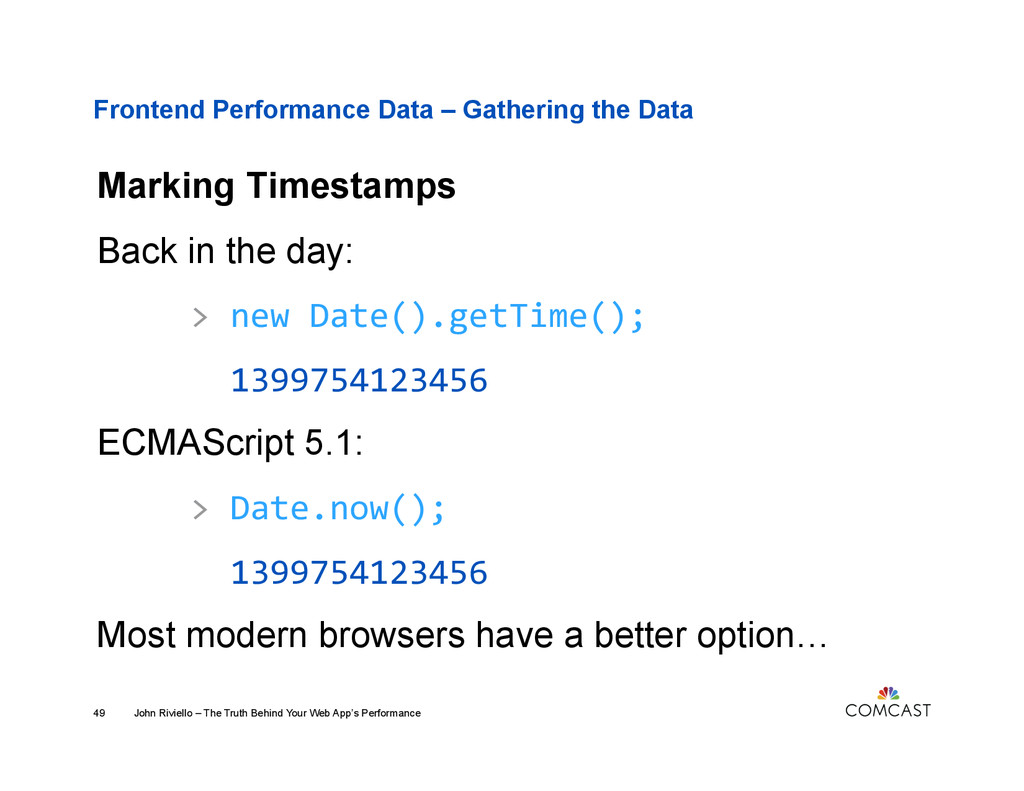
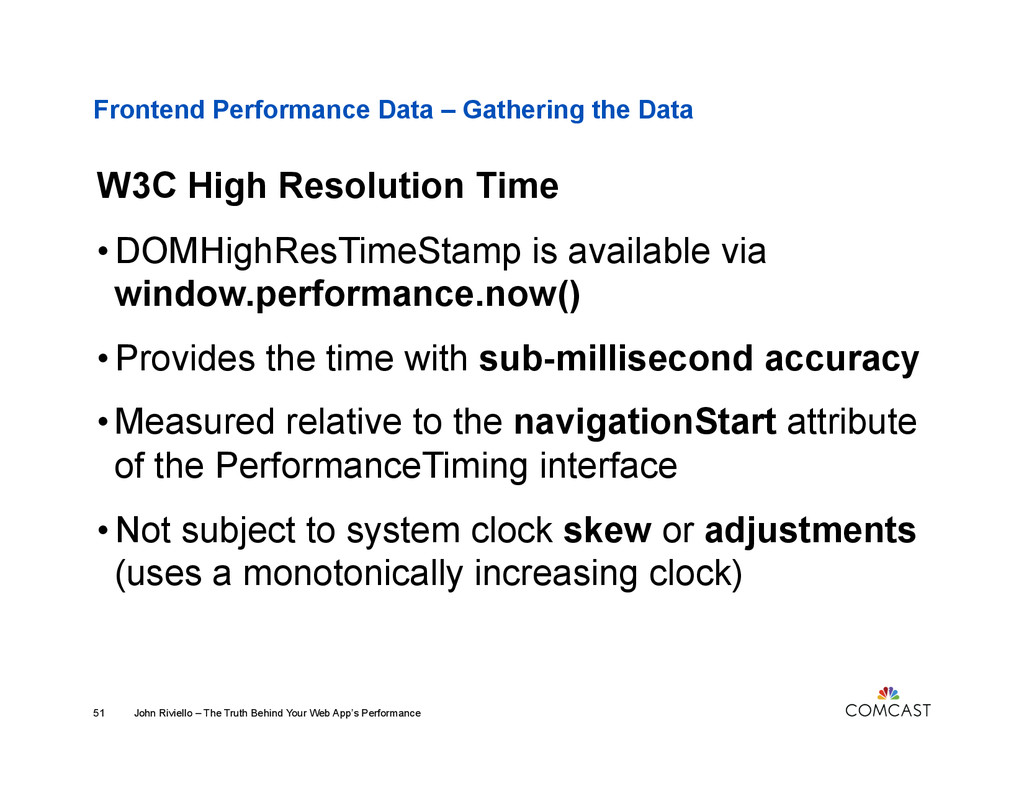
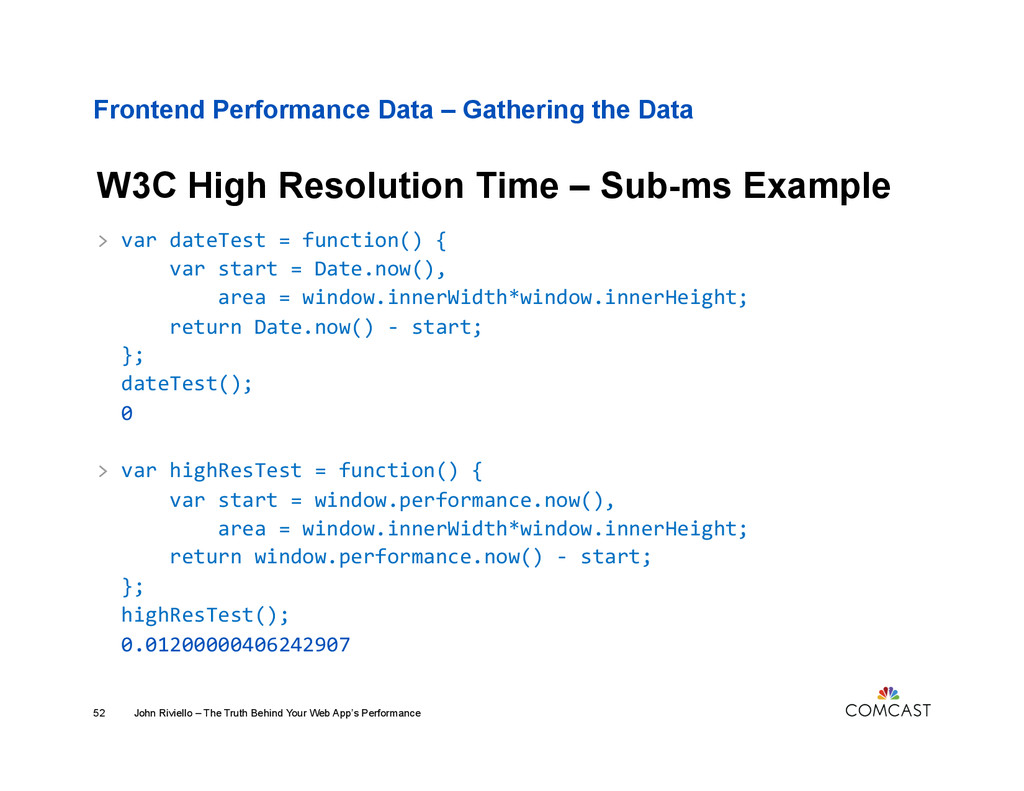
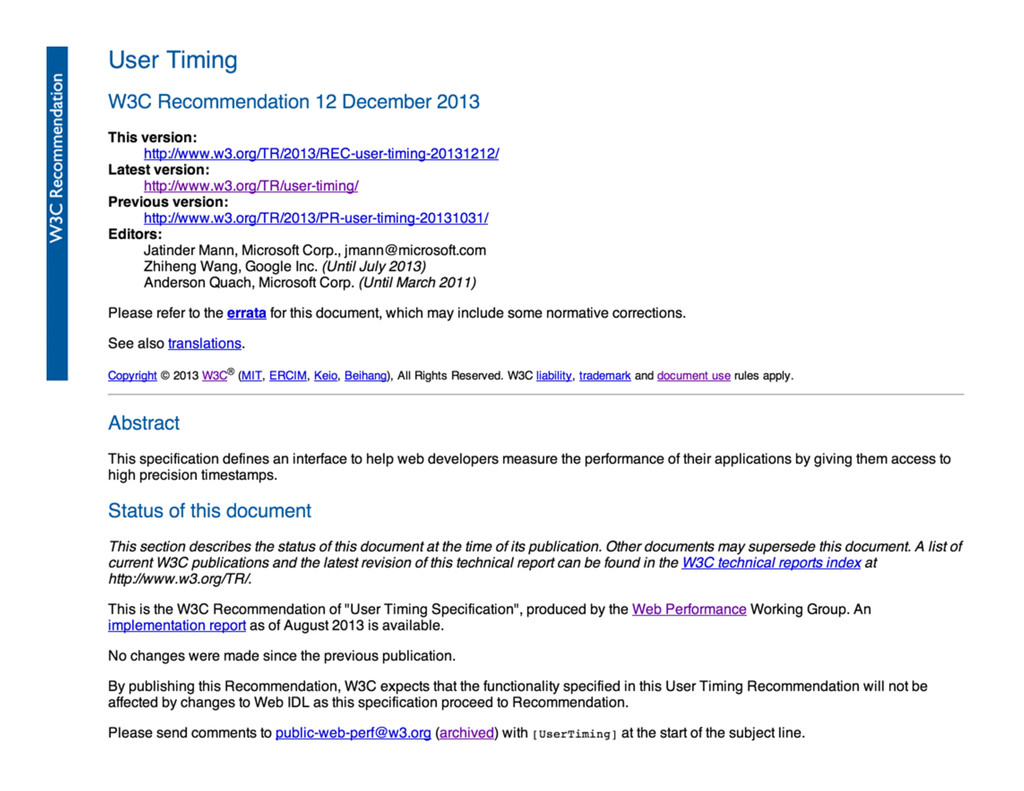
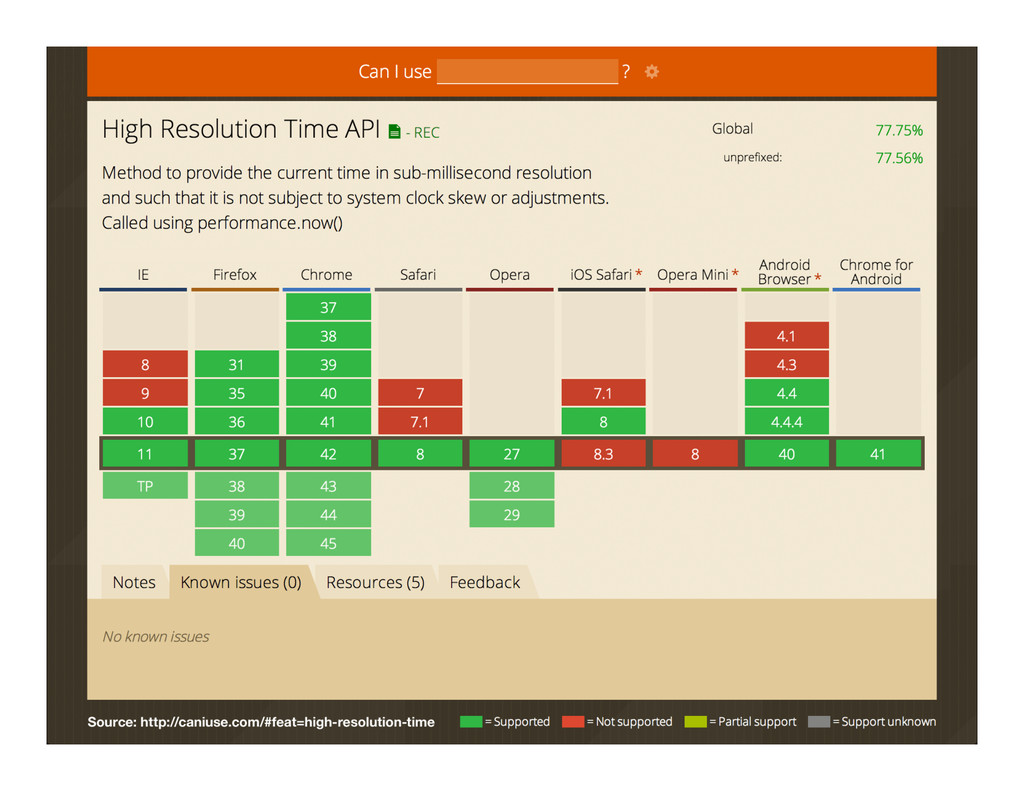
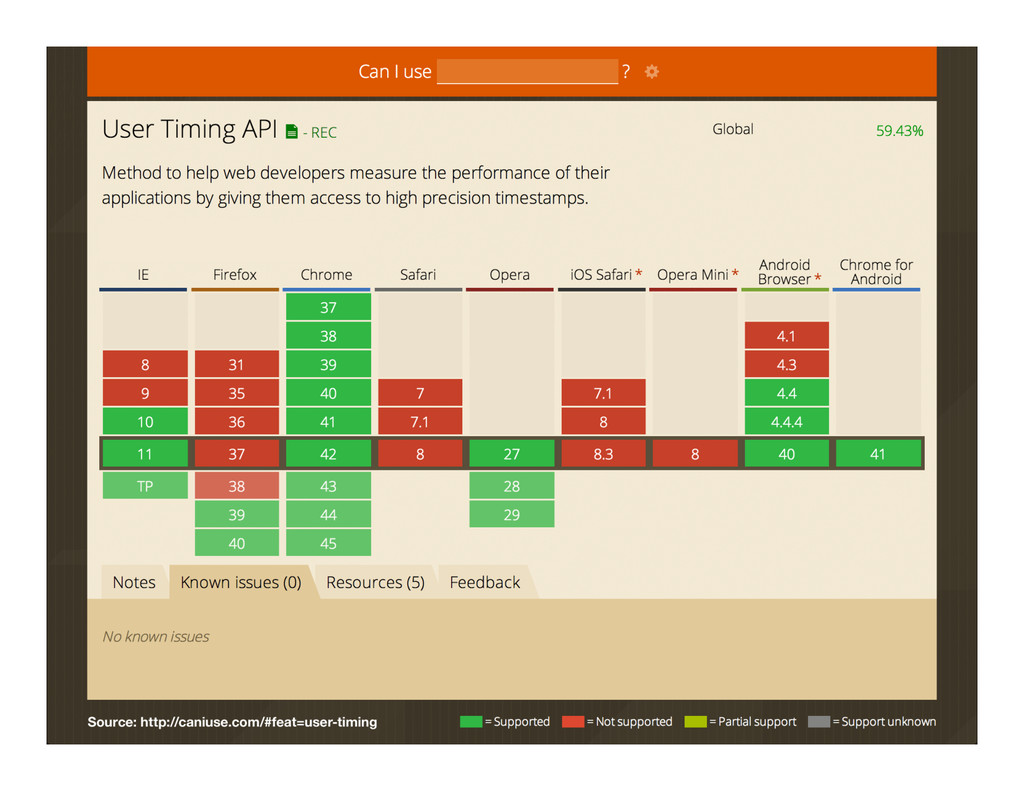
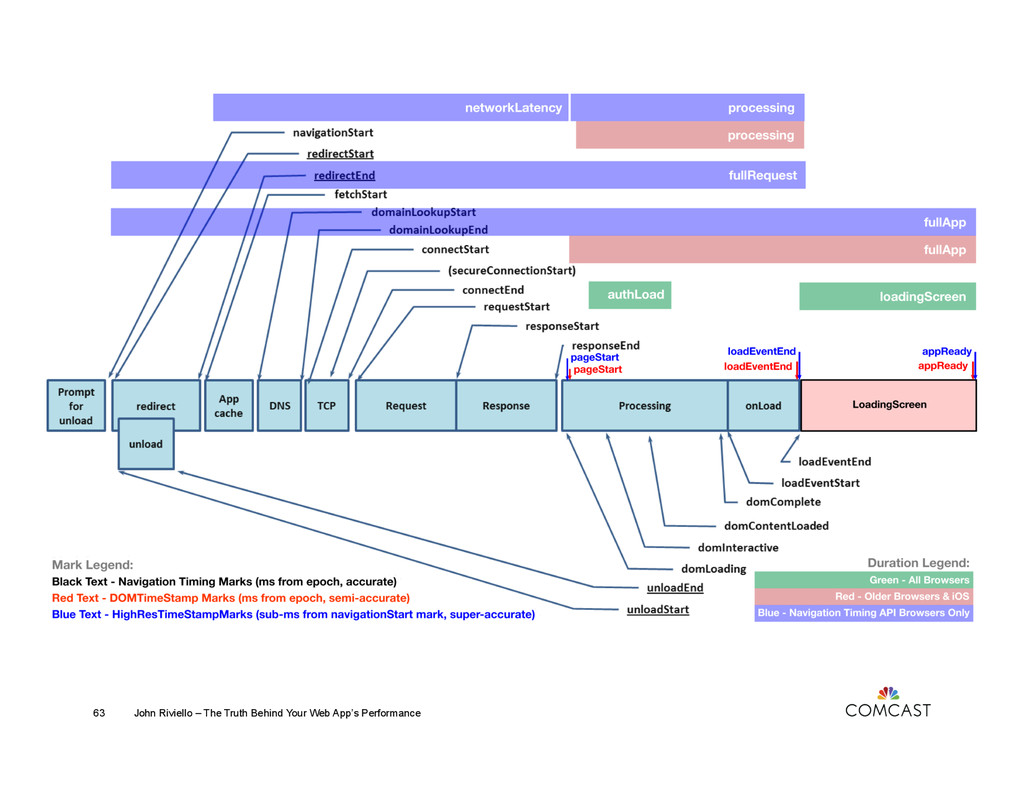
The performance of your web app is obviously important. But how do you know your web app is performing well for all of your users? Out of the box tools provide us metrics, but most only provide an overall view. This case study of building the XFINITY X1 single-page web app will demonstrate what frontend performance data should you be gathering, how to gather it, and how to make sense of all that data. In this talk, we'll walk through the parts of the W3C Navigation Timing, High Resolution Time & User Timing recommendations that you can take advantage of right now to collect important metrics. We'll determine the "types" of users you need to focus on to understand YOUR web app, as well as what other factors could impact those individual users' experience. And we'll make sure "Average Response Time" is never the primary focus of your metrics dashboard.

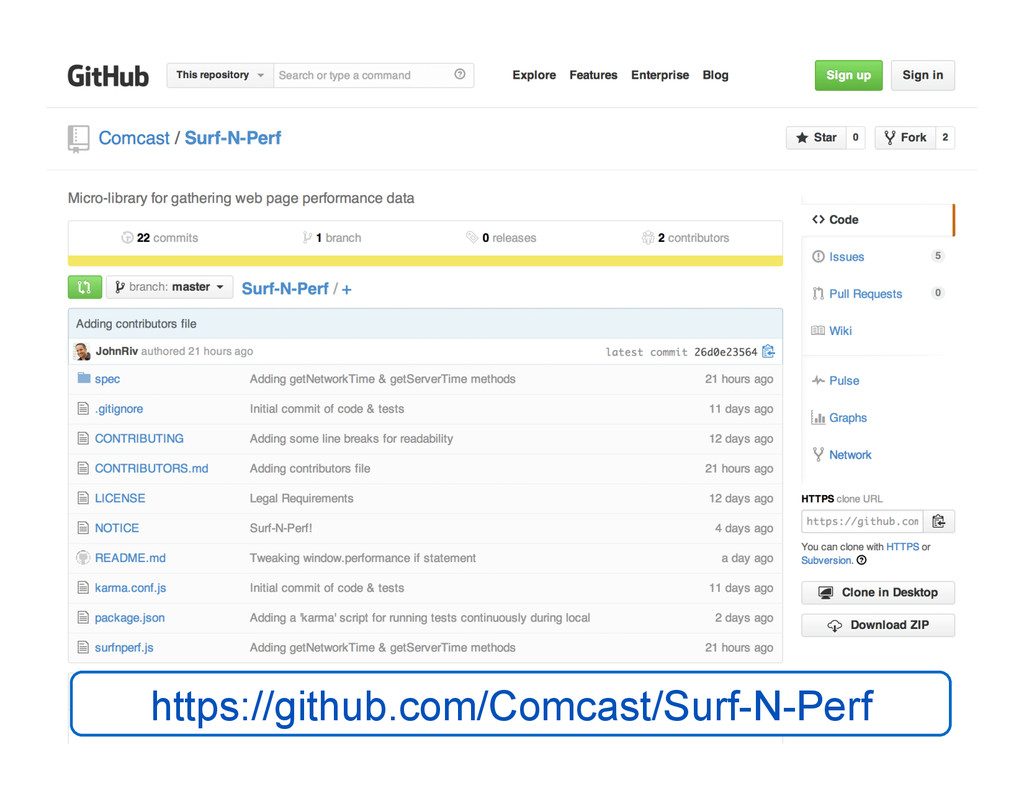
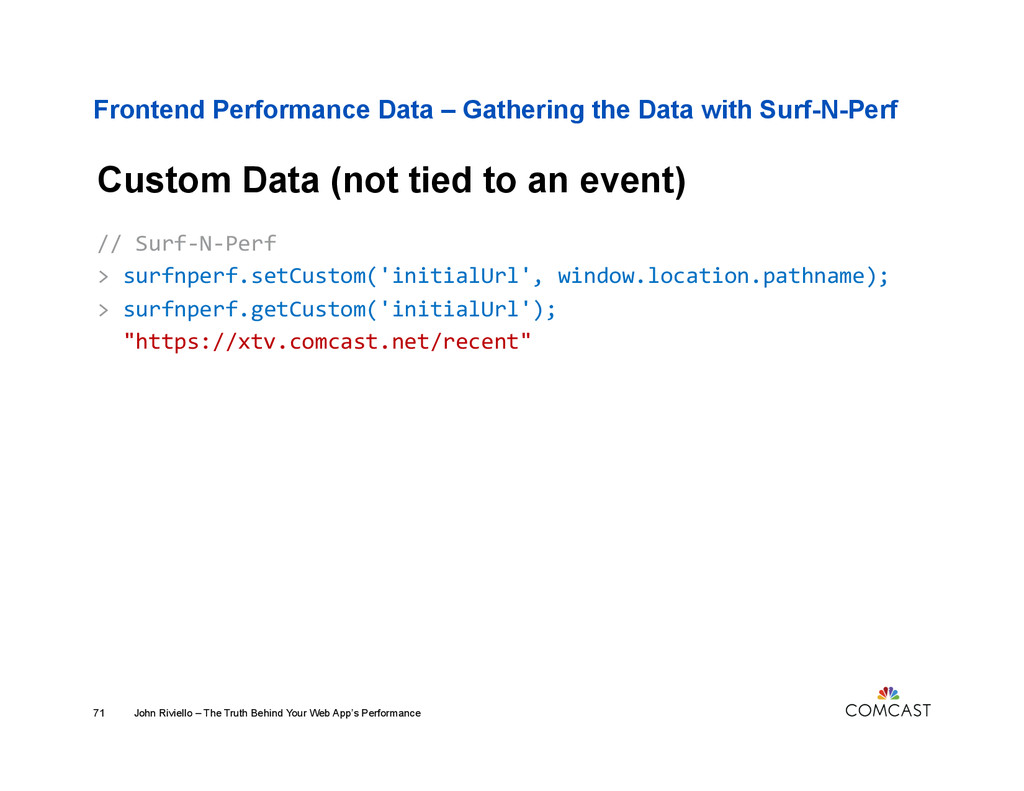
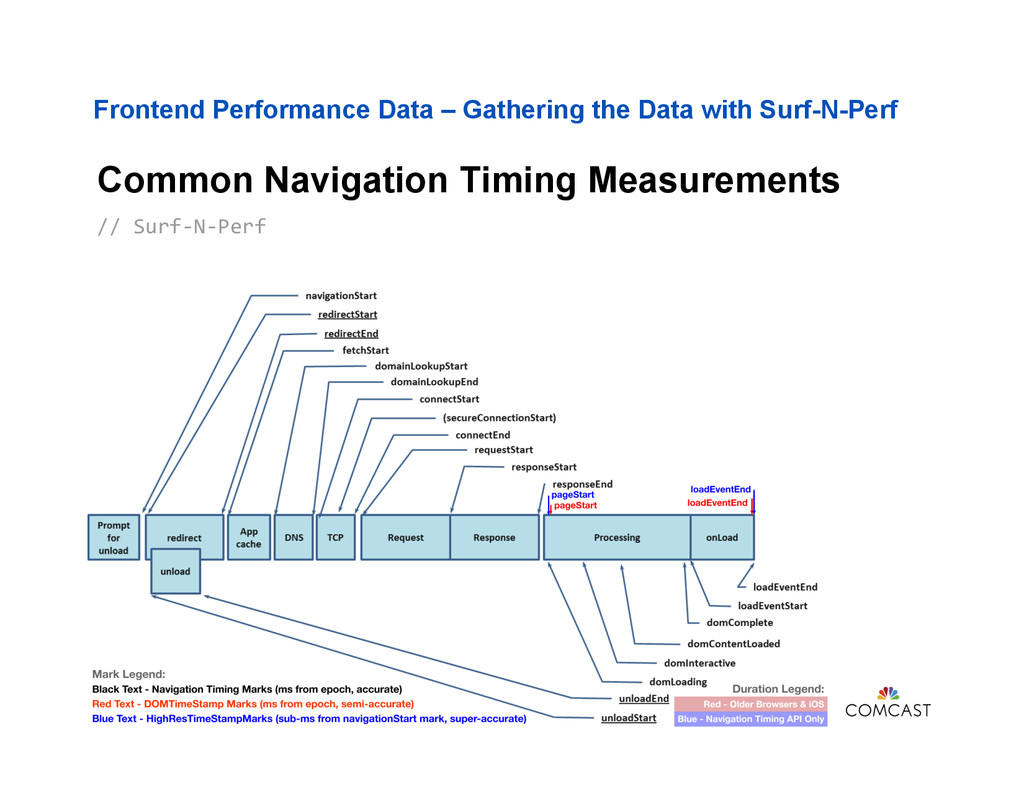
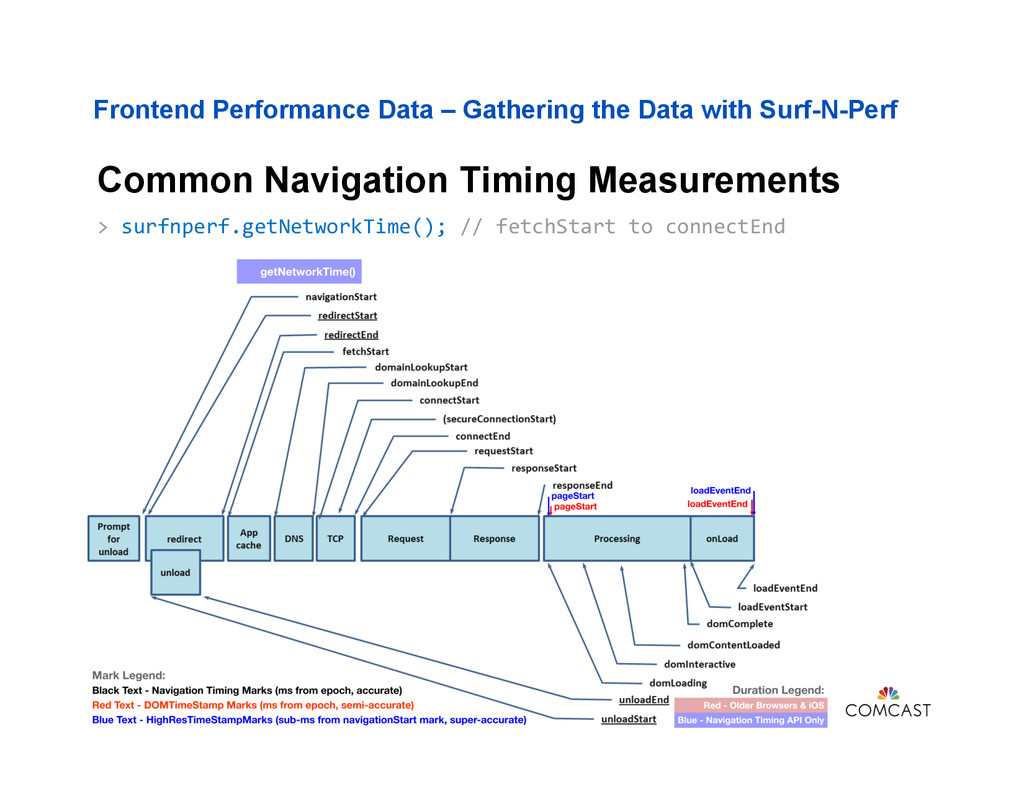
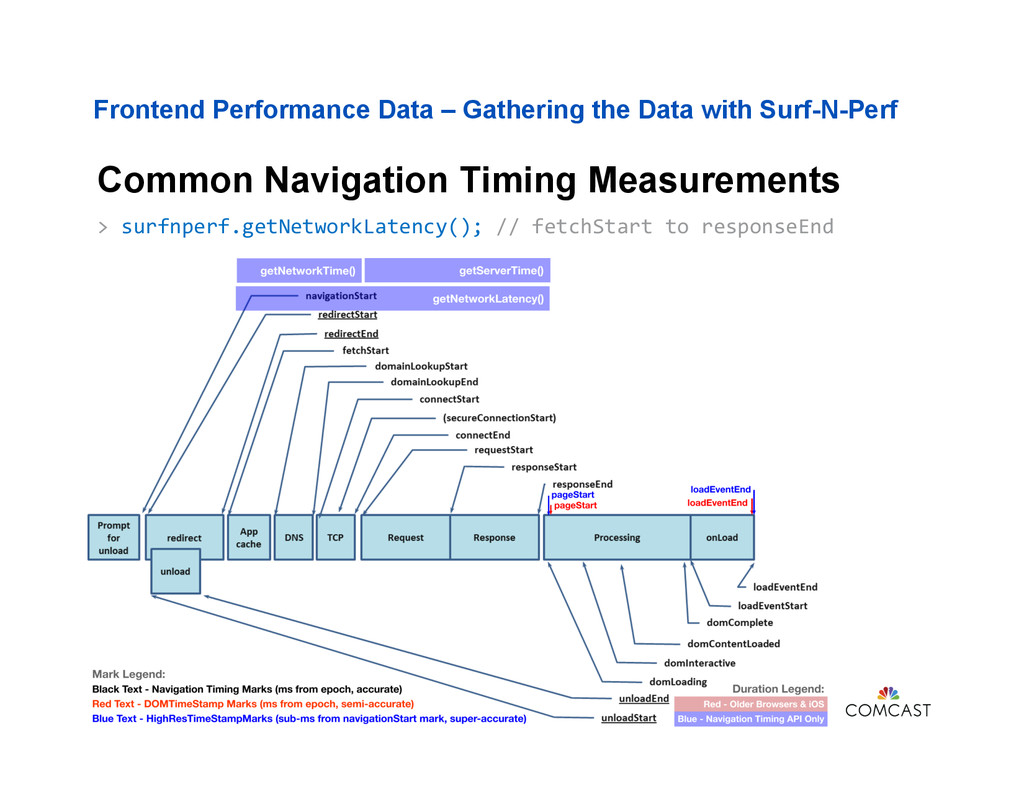
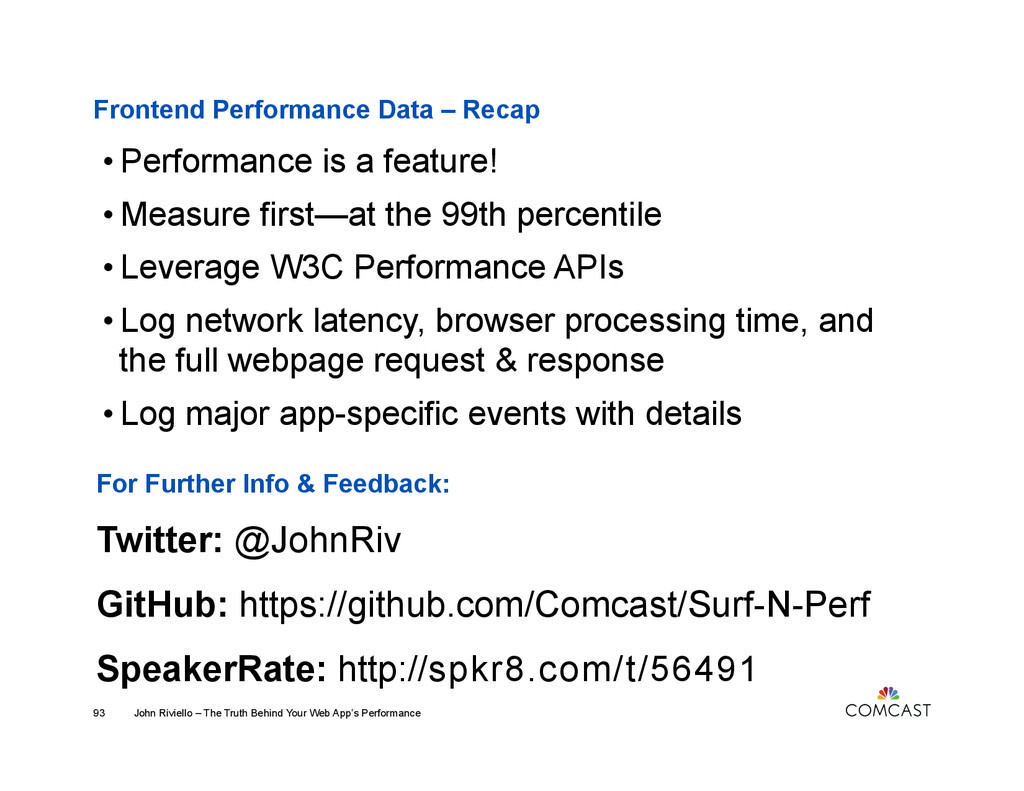
Includes demos of Surf-N-Perf: https://github.com/Comcast/Surf-N-Perf

John Riviello

April 30, 2015
Tweet

More Decks by John Riviello

Other Decks in Programming

Transcript

  1. The Truth About Your
 Web App’s Performance John Riviello -

    @JohnRiv Distinguished Engineer, Comcast Interactive Media University of Illinois Web Conference – April 30, 2015
  2. Frontend Performance Data 1.  What do existing tools provide? 2. 

    What data do you care about? 3.  How do you gather that data? 4.  What do you do with the data? John Riviello – The Truth Behind Your Web App’s Performance 3
  3. 1. Existing Tools 2. The Data You Care About 3.

    Gathering the Data 4. Analyzing the Data
  4. Real User Monitoring "yes, that's a rum filled coconut." by

    Brandon King is licensed under CC BY-NC 2.0 / Color adjusted from original
  5. 1. Existing Tools 2. The Data You Care About 3.

    Gathering the Data 4. Analyzing the Data
  6. Real User Monitoring "yes, that's a rum filled coconut." by

    Brandon King is licensed under CC BY-NC 2.0 / Color adjusted from original
  7. Frontend Performance Data – The Data You Care About John

    Riviello – The Truth Behind Your Web App’s Performance 42
  8. Frontend Performance Data – The Data You Care About Example

    Factors That Impact Performance: John Riviello – The Truth Behind Your Web App’s Performance 43 •  User authentication state • “Type” of user •  Number of “items” returned •  Flash SWF dependency
  9. http://mashable.com/2014/01/31/gmail-slow/ John Riviello – The Truth Behind Your Web App’s

    Performance 45 “Gmail’s People Widget appears to be the cause of the sluggishness, which is, only affecting Gmail on the web Google says… This is noticeable when users open an email conversation with a large number of participants…”
  10. 1. Existing Tools 2. The Data You Care About 3.

    Gathering the Data 4. Analyzing the Data
  11. Frontend Performance Data – Gathering the Data Marking Timestamps John

    Riviello – The Truth Behind Your Web App’s Performance 49 Back in the day: >  new  Date().getTime();        1399754123456   ECMAScript 5.1: >  Date.now();        1399754123456   Most modern browsers have a better option…      
  12. Frontend Performance Data – Gathering the Data W3C High Resolution

    Time John Riviello – The Truth Behind Your Web App’s Performance 51 • DOMHighResTimeStamp is available via window.performance.now() • Provides the time with sub-millisecond accuracy • Measured relative to the navigationStart attribute of the PerformanceTiming interface • Not subject to system clock skew or adjustments (uses a monotonically increasing clock)
  13. Frontend Performance Data – Gathering the Data W3C High Resolution

    Time – Sub-ms Example John Riviello – The Truth Behind Your Web App’s Performance 52 >  var  dateTest  =  function()  {              var  start  =  Date.now(),                      area  =  window.innerWidth*window.innerHeight;              return  Date.now()  -­‐  start;      };      dateTest();      0     >  var  highResTest  =  function()  {              var  start  =  window.performance.now(),                      area  =  window.innerWidth*window.innerHeight;              return  window.performance.now()  -­‐  start;      };      highResTest();      0.01200000406242907  
  14. Frontend Performance Data – Gathering the Data W3C High Resolution

    Time – Monotonic Clock John Riviello – The Truth Behind Your Web App’s Performance 53 Why do we care? “Most systems run a daemon which regularly synchronizes the time. It is common for the clock to be tweaked a few milliseconds every 15-20 minutes. At that rate about 1% of 10 second intervals measured would be inaccurate.” Source: Tony Gentilcore http://gent.ilcore.com/2012/06/better-timer-for-javascript.html
  15. User Timing vs. Surf-N-Perf "Hurricane Earl's Waves" by John Riviello

    is licensed under CC BY-NC-SA 2.0 / Color adjusted from original
  16. Frontend Performance Data – Gathering the Data with Surf-N-Perf Setting

    & Getting a Mark John Riviello – The Truth Behind Your Web App’s Performance 66 //  User  Timing  API   >  window.performance.mark('foo');   >  window.performance.getEntriesByName('foo');      [PerformanceMark                                ]          duration:  0          entryType:  "mark"          name:  "foo"          startTime:  3323.620999988634   >  window.performance.getEntriesByName('foo')[0].startTime;      3323.620999988634     //  Surf-­‐N-­‐Perf   >  surfnperf.mark('foo');   >  surfnperf.getMark('foo');      3323.620999988634  
  17. Frontend Performance Data – Gathering the Data with Surf-N-Perf Navigation

    Timing Mark & User Mark Duration John Riviello – The Truth Behind Your Web App’s Performance 67 //  User  Timing  API   >  window.performance.mark('foo');   >  window.performance.measure('page_load_to_foo',  'loadEventEnd',  'foo');   >  window.performance.getEntriesByName('page_load_to_foo');      [PerformanceMeasure                          ]          duration:  3201.620999988634          entryType:  "measure"          name:  "page_load_to_foo"          startTime:  122   >  window.performance.getEntriesByName('page_load_to_foo')[0].duration;      3201.620999988634     //  Surf-­‐N-­‐Perf   >  surfnperf.mark('foo');   >  surfnperf.duration('loadEventEnd','foo');      3202   >  surfnperf.duration('loadEventEnd','foo',{decimalPlaces:3});      3201.621  
  18. Frontend Performance Data – Gathering the Data with Surf-N-Perf Event

    Duration (i.e. 2 User Marks) John Riviello – The Truth Behind Your Web App’s Performance 68 //  User  Timing  API   >  window.performance.mark('barStart');   >  window.performance.mark('barEnd');   >  window.performance.measure('barEvent',  'barStart',  'barEnd');   >  window.performance.getEntriesByName(’barEvent')[0].duration;      3512.499000004027     //  Surf-­‐N-­‐Perf   >  surfnperf.eventStart('bar');   >  surfnperf.eventEnd('bar');   >  surfnperf.eventDuration('bar');      3512   >  surfnperf.eventDuration('bar',{decimalPlaces:12});      3512.499000004027  
  19. Frontend Performance Data – Gathering the Data with Surf-N-Perf Custom

    Event Data John Riviello – The Truth Behind Your Web App’s Performance 69 //  Surf-­‐N-­‐Perf   >  surfnperf.eventStart('bar');   //  surfnperf.eventEnd(KEY,  CUSTOM_DATA_OBJECT);   >  surfnperf.eventEnd('bar',  {baz:'qux'});   >  surfnperf.getEventData('bar',  'baz');      "qux"  
  20. Frontend Performance Data – Gathering the Data with Surf-N-Perf Tying

    It Together with Backbone.fetch() John Riviello – The Truth Behind Your Web App’s Performance 70 //  Surf-­‐N-­‐Perf   >  var  collection  =  new  Backbone.Collection();      collection.url  =  '/get-­‐data/';        surfnperf.eventStart('getData');      collection.fetch({          success:  function(collection)  {              surfnperf.eventEnd('getData',  {status:'success',  items:  collection.length});          },          error:  function()  {              surfnperf.eventEnd('getData',  {status:'error'});          },      });     >  surfnperf.eventDuration('getData',  {decimalPlaces:2});      1464.75   >  surfnperf.getEventData('getData',  'status');      "success"   >  surfnperf.getEventData('getData',  'items');      33  
  21. Frontend Performance Data – Gathering the Data with Surf-N-Perf Custom

    Data (not tied to an event) John Riviello – The Truth Behind Your Web App’s Performance 71 //  Surf-­‐N-­‐Perf   >  surfnperf.setCustom('initialUrl',  window.location.pathname);   >  surfnperf.getCustom('initialUrl');      "https://xtv.comcast.net/recent"  
  22. Frontend Performance Data – Gathering the Data with Surf-N-Perf Common

    Navigation Timing Measurements John Riviello – The Truth Behind Your Web App’s Performance 72 //  Surf-­‐N-­‐Perf    
  23. Frontend Performance Data – Gathering the Data with Surf-N-Perf Common

    Navigation Timing Measurements John Riviello – The Truth Behind Your Web App’s Performance 73 >  surfnperf.getNetworkTime();  //  fetchStart  to  connectEnd    
  24. Frontend Performance Data – Gathering the Data with Surf-N-Perf Common

    Navigation Timing Measurements John Riviello – The Truth Behind Your Web App’s Performance 74 >  surfnperf.getServerTime();  //  requestStart  to  responseEnd    
  25. Frontend Performance Data – Gathering the Data with Surf-N-Perf Common

    Navigation Timing Measurements John Riviello – The Truth Behind Your Web App’s Performance 75 >  surfnperf.getNetworkLatency();  //  fetchStart  to  responseEnd    
  26. Frontend Performance Data – Gathering the Data with Surf-N-Perf Common

    Navigation Timing Measurements John Riviello – The Truth Behind Your Web App’s Performance 76 >  surfnperf.getProcessingLoadTime();  //  responseEnd  to  loadEventEnd      
  27. Frontend Performance Data – Gathering the Data with Surf-N-Perf Common

    Navigation Timing Measurements John Riviello – The Truth Behind Your Web App’s Performance 77 >  surfnperf.getFullRequestLoadTime();  //  navigationStart  to  loadEventEnd    
  28. Frontend Performance Data – Gathering the Data with Surf-N-Perf Common

    Navigation Timing Measurements John Riviello – The Truth Behind Your Web App’s Performance 78 Important: If you want to use these methods as soon as the page load event fires, you'll have to wrap that in a setTimeout call so that the load event can fire first:   //  Example  using  jQuery  &  Surf-­‐N-­‐Perf   >  $(window).load(function()  {          setTimeout(function()  {              console.log(                  'Network  Time:',  surfnperf.getNetworkTime(),                  'Server  Time:',  surfnperf.getServerTime(),                  'Network  Latency:',  surfnperf.getNetworkLatency(),                  'Processing:',  surfnperf.getProcessingLoadTime(),                  'Full  Request:',  surfnperf.getFullRequestLoadTime()              );          },  0);      });      Network  Time:  1  Server  Time:  215  Network  Latency:  216        Processing:  2399  Full  Request:  2615        
  29. 1. Existing Tools 2. The Data You Care About 3.

    Gathering the Data 4. Analyzing the Data
  30. Frontend Performance Data – Analyzing The Data John Riviello –

    The Truth Behind Your Web App’s Performance 80
  31. Frontend Performance Data – Analyzing The Data John Riviello –

    The Truth Behind Your Web App’s Performance 83
  32. Frontend Performance Data – Analyzing The Data John Riviello –

    The Truth Behind Your Web App’s Performance 84
  33. Frontend Performance Data – Analyzing The Data John Riviello –

    The Truth Behind Your Web App’s Performance 85
  34. Frontend Performance Data – Analyzing The Data John Riviello –

    The Truth Behind Your Web App’s Performance 86
  35. Frontend Performance Data – Analyzing The Data John Riviello –

    The Truth Behind Your Web App’s Performance 87
  36. Frontend Performance Data – Analyzing The Data John Riviello –

    The Truth Behind Your Web App’s Performance 88
  37. Frontend Performance Data – Analyzing The Data John Riviello –

    The Truth Behind Your Web App’s Performance 89
  38. Frontend Performance Data – Analyzing The Data John Riviello –

    The Truth Behind Your Web App’s Performance 90
  39. Frontend Performance Data – Analyzing The Data John Riviello –

    The Truth Behind Your Web App’s Performance 91
  40. Frontend Performance Data – Recap John Riviello – The Truth

    Behind Your Web App’s Performance 93 • Performance is a feature! • Measure first—at the 99th percentile • Leverage W3C Performance APIs • Log network latency, browser processing time, and the full webpage request & response • Log major app-specific events with details For Further Info & Feedback: Twitter: @JohnRiv GitHub: https://github.com/Comcast/Surf-N-Perf SpeakerRate: http://spkr8.com/t/56491