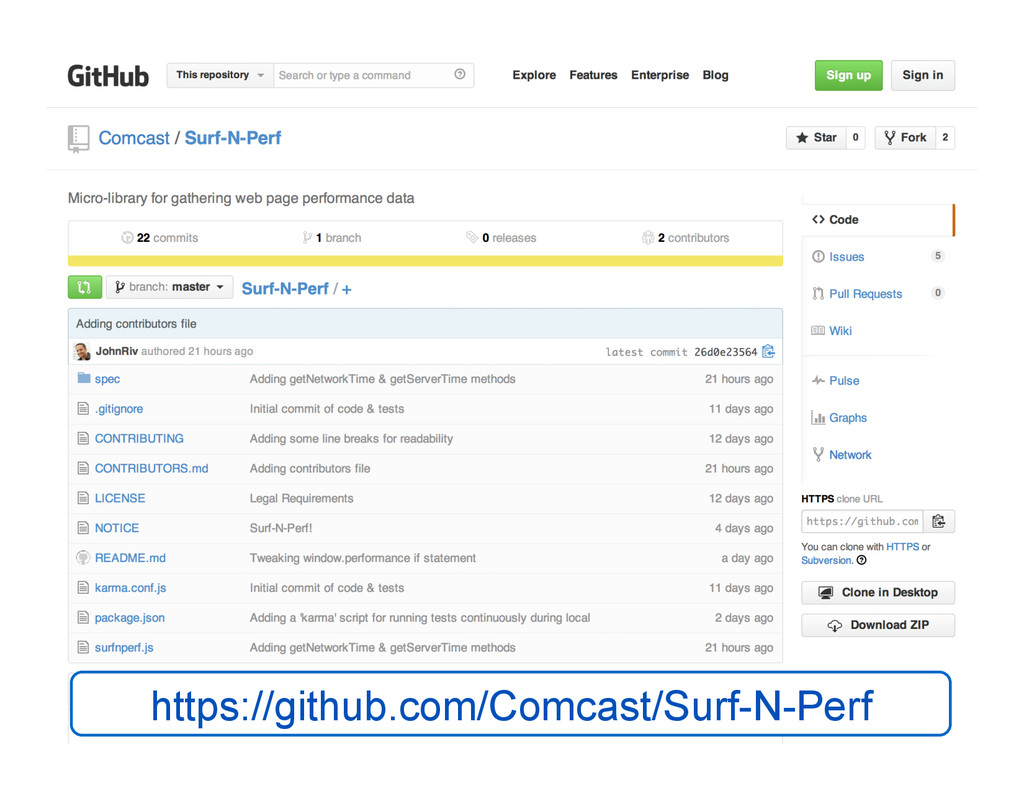
From JSConf US 2014, where I announced the release of Surf-N-Perf, our micro-library for gathering web page performance data (https://github.com/Comcast/Surf-N-Perf)
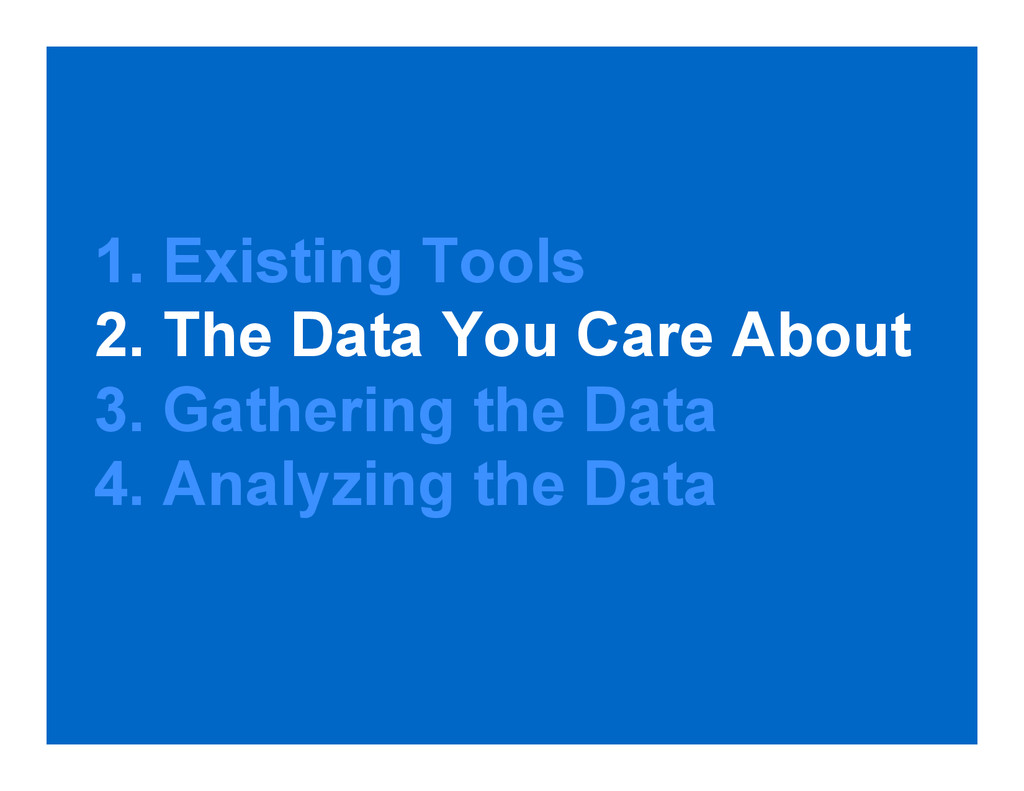
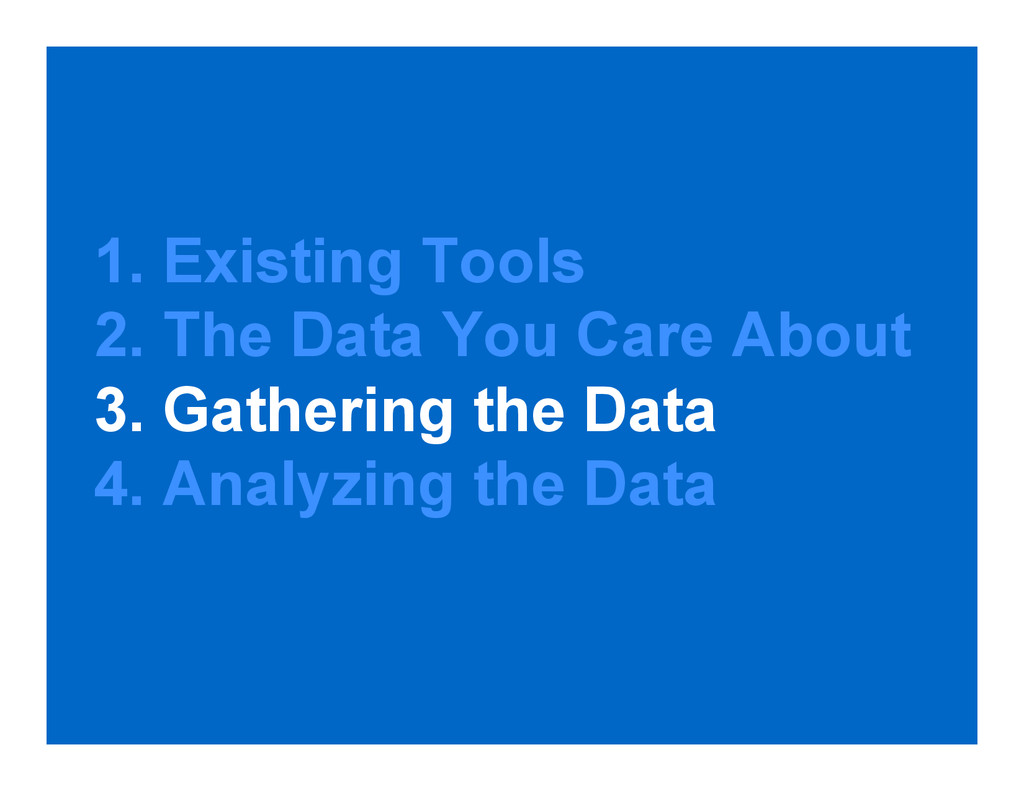
What data do you care about? 3. How do you gather that data? 4. What do you do with the data? John Riviello – The Truth Behind Your Web App’s Performance 3
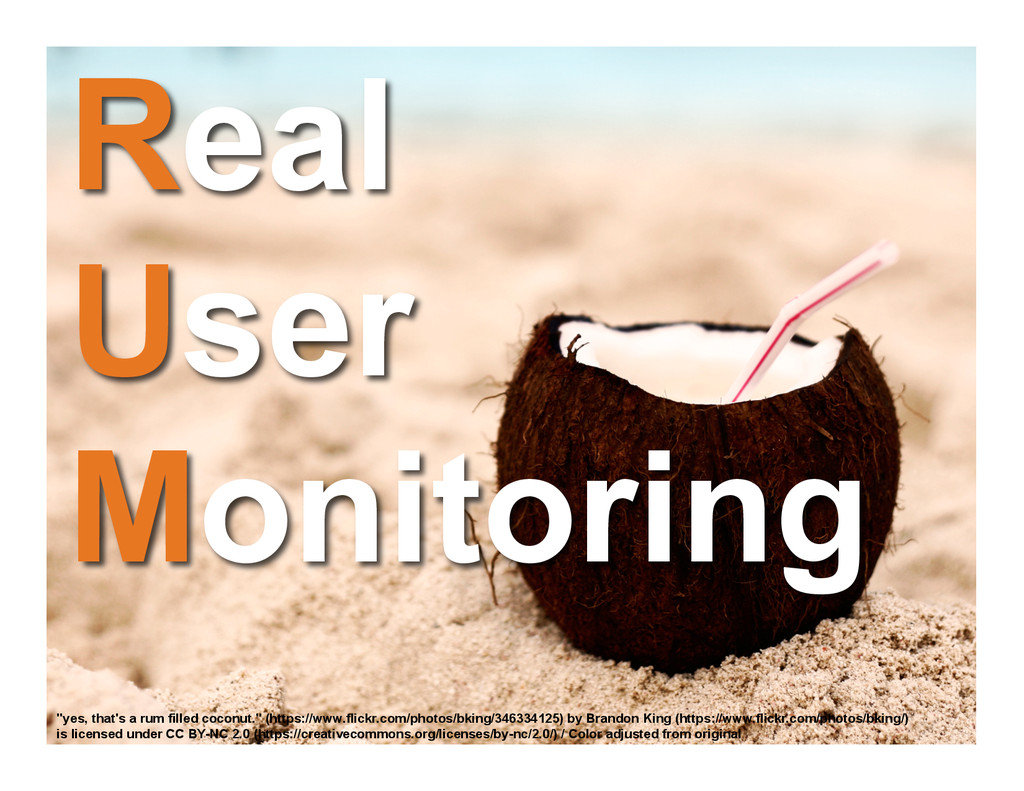
by Brandon King (https://www.flickr.com/photos/bking/) is licensed under CC BY-NC 2.0 (https://creativecommons.org/licenses/by-nc/2.0/) / Color adjusted from original
by Brandon King (https://www.flickr.com/photos/bking/) is licensed under CC BY-NC 2.0 (https://creativecommons.org/licenses/by-nc/2.0/) / Color adjusted from original
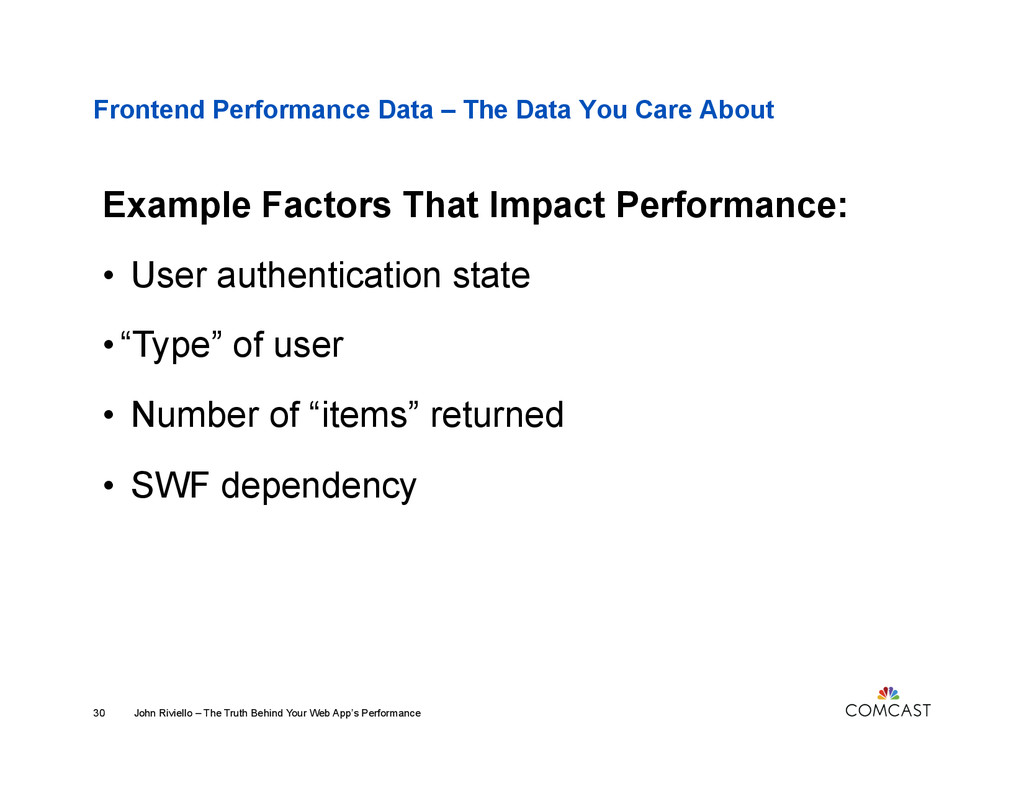
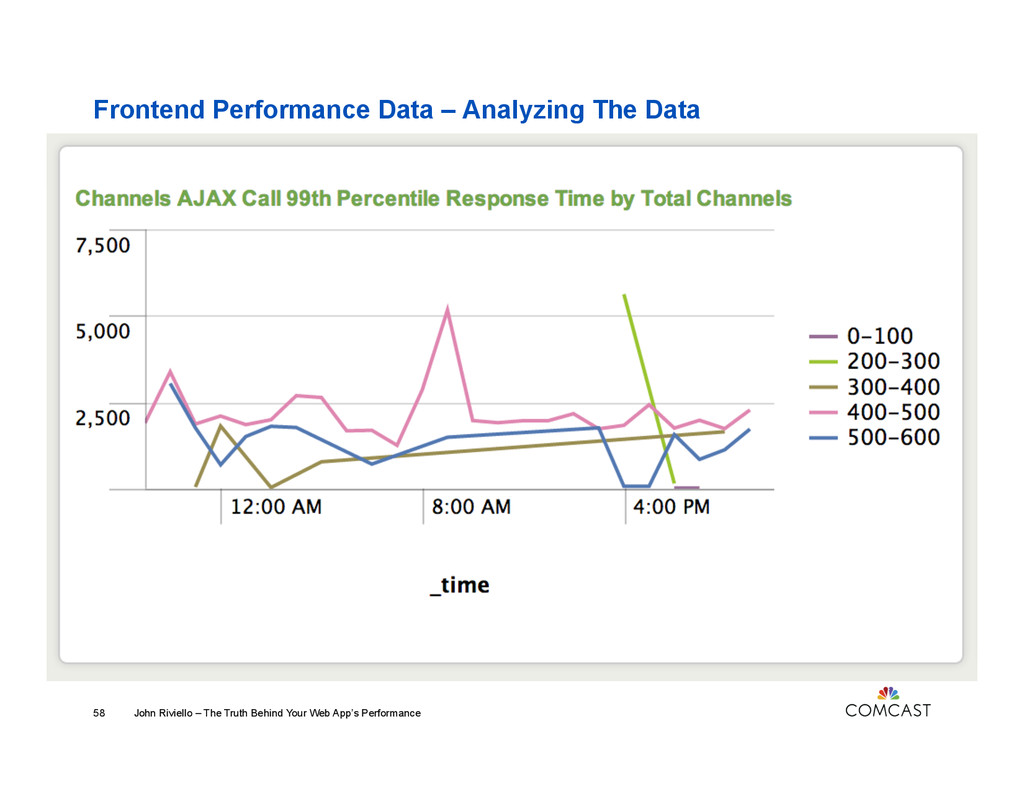
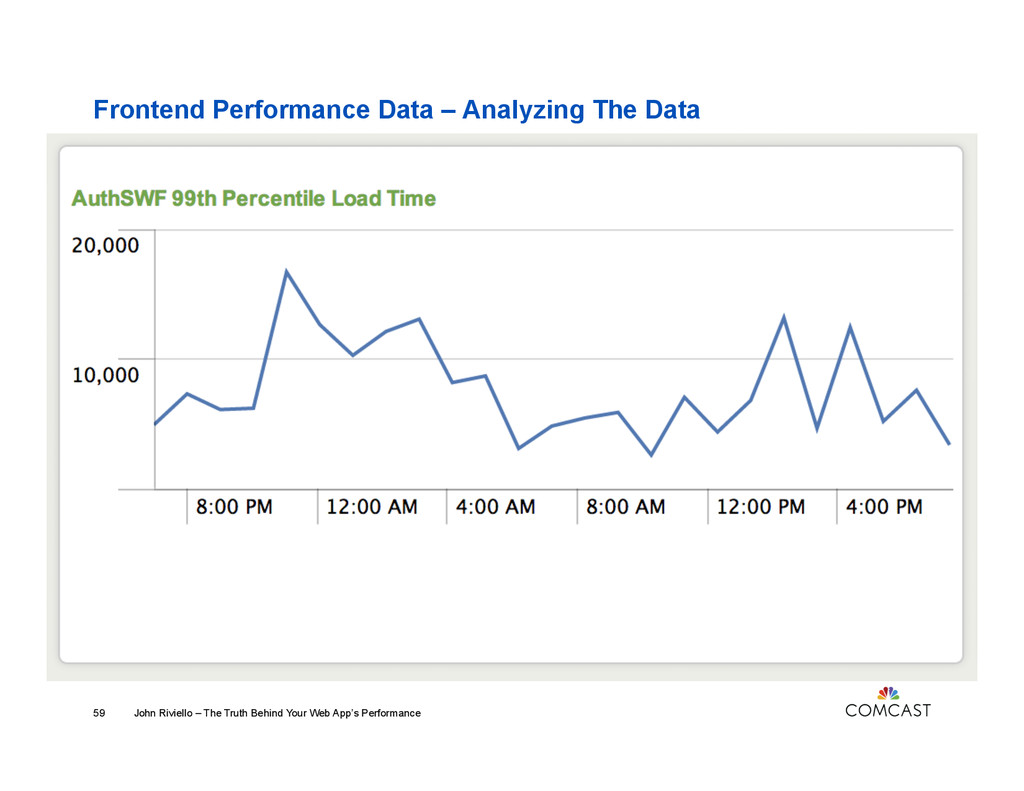
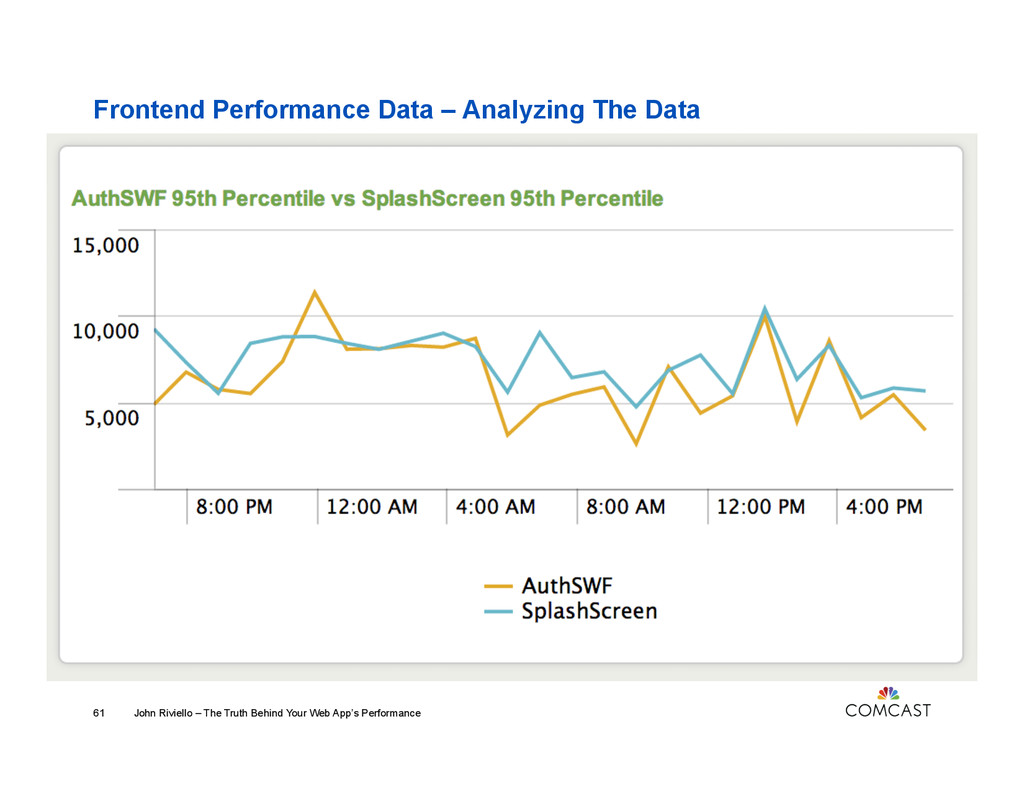
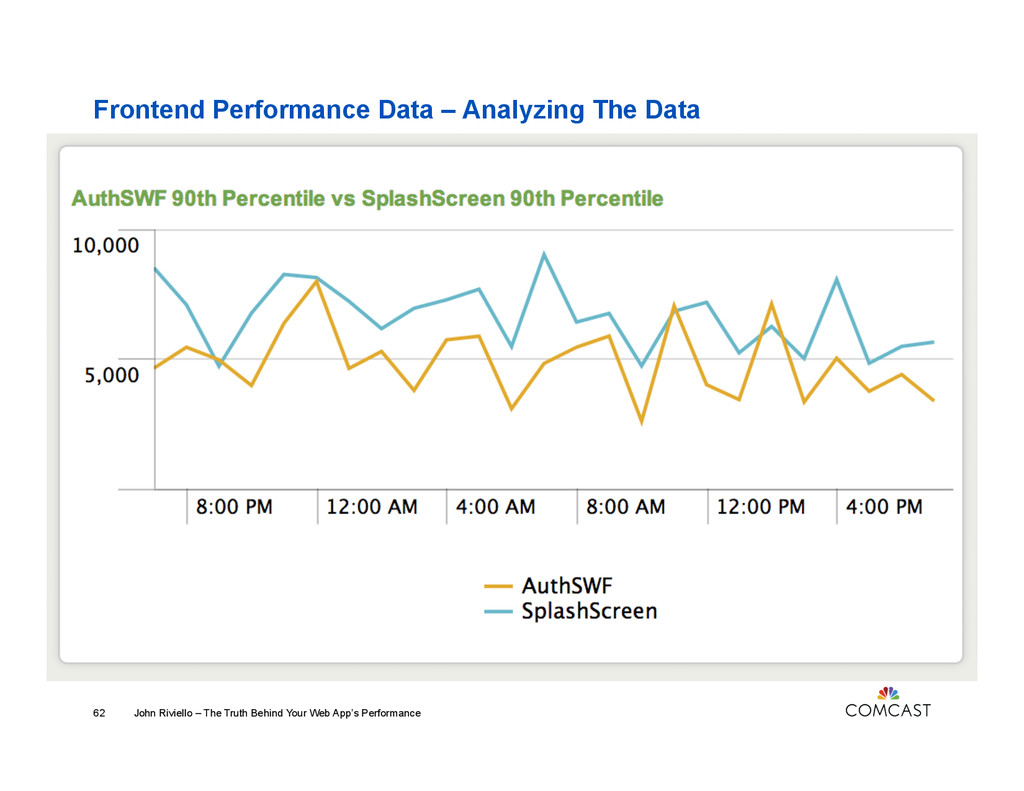
Factors That Impact Performance: John Riviello – The Truth Behind Your Web App’s Performance 30 • User authentication state • “Type” of user • Number of “items” returned • SWF dependency
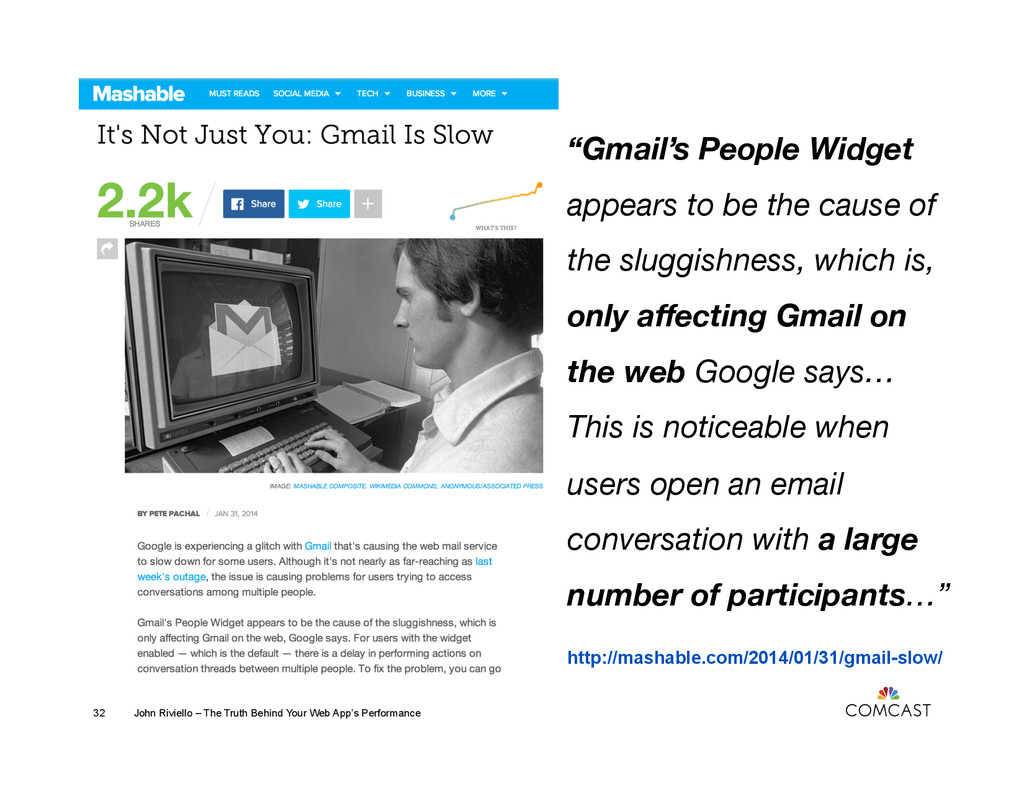
Performance 32 “Gmail’s People Widget appears to be the cause of the sluggishness, which is, only affecting Gmail on the web Google says… This is noticeable when users open an email conversation with a large number of participants…”
Riviello – The Truth Behind Your Web App’s Performance 36 Back in the day: > new Date().getTime(); 1399754123456 ECMAScript 5.1: > Date.now(); 1399754123456 Most modern browsers have a better option…
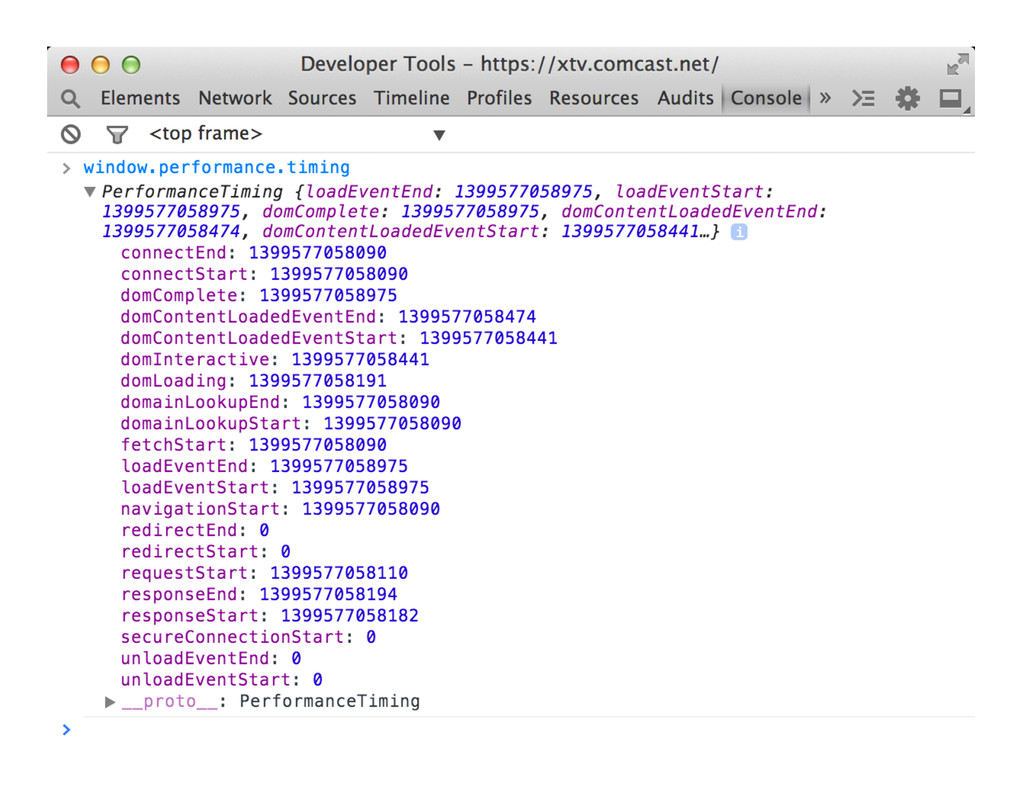
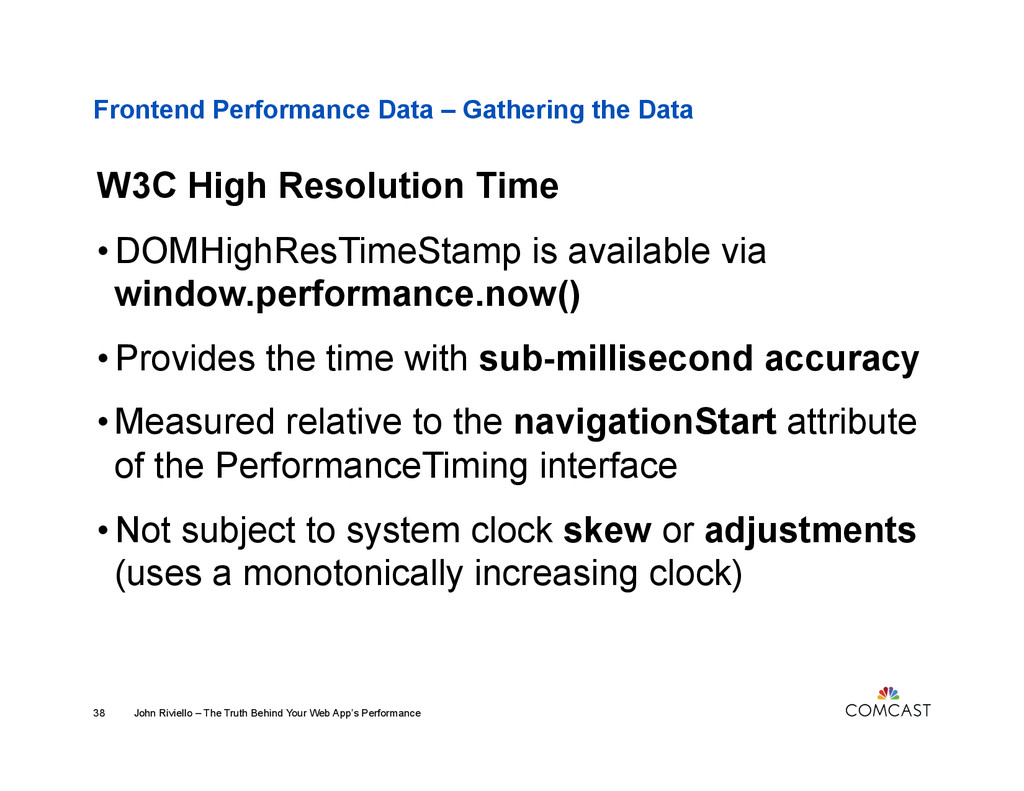
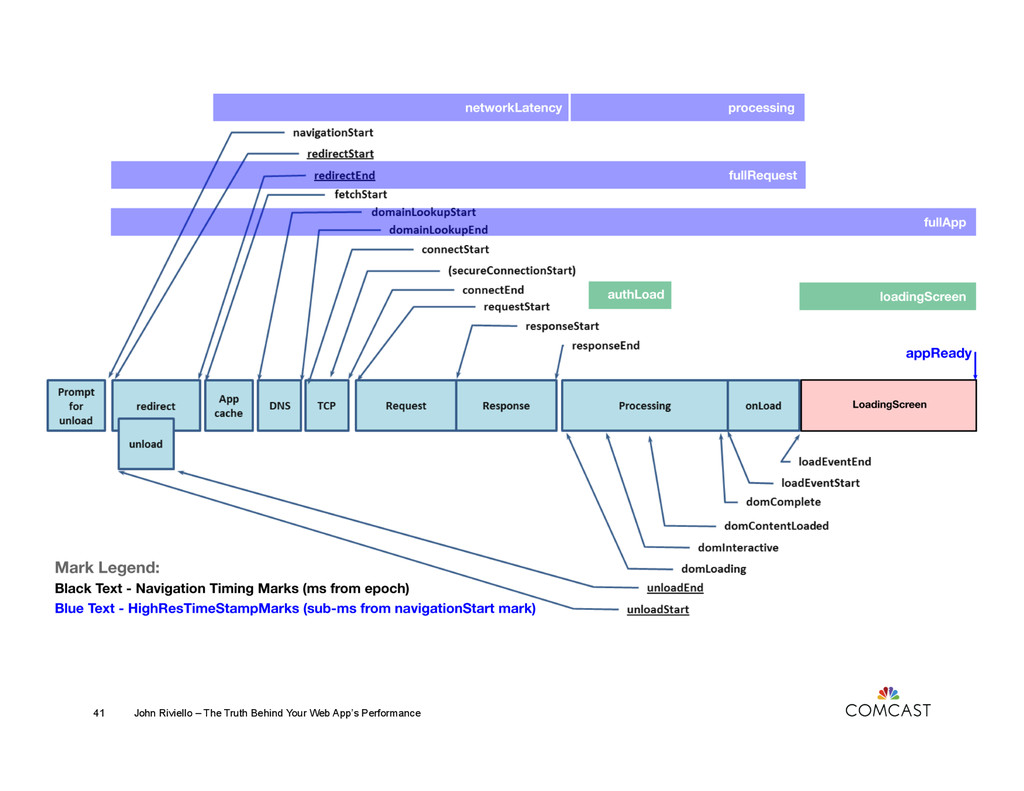
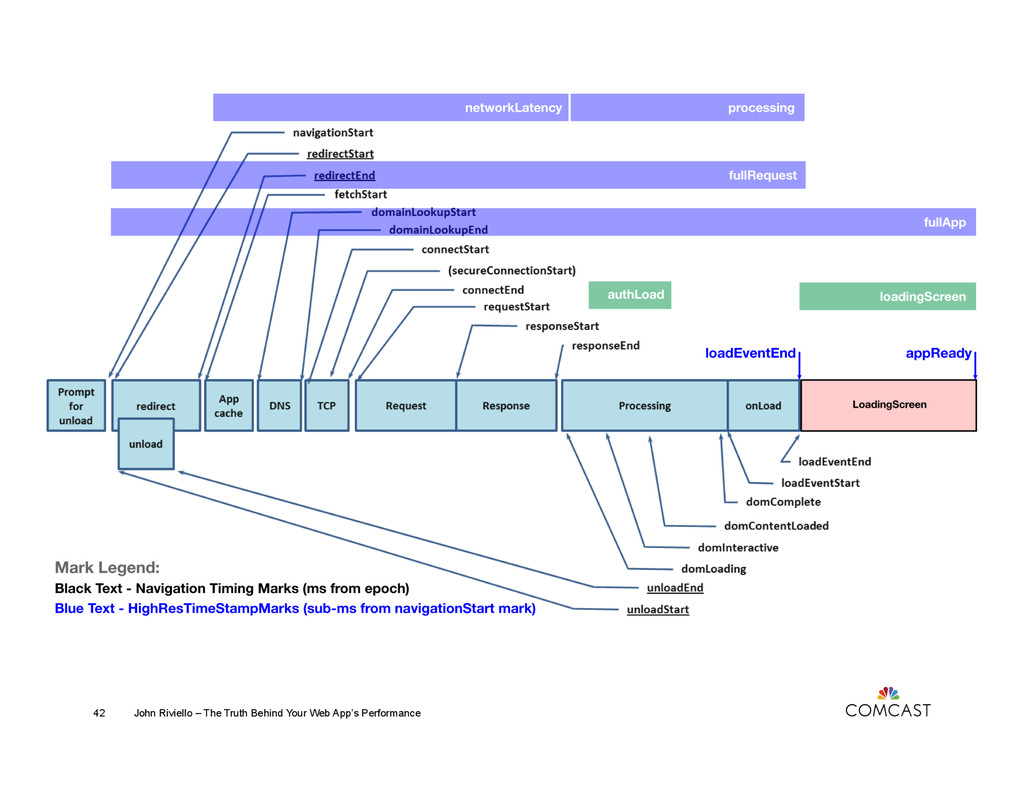
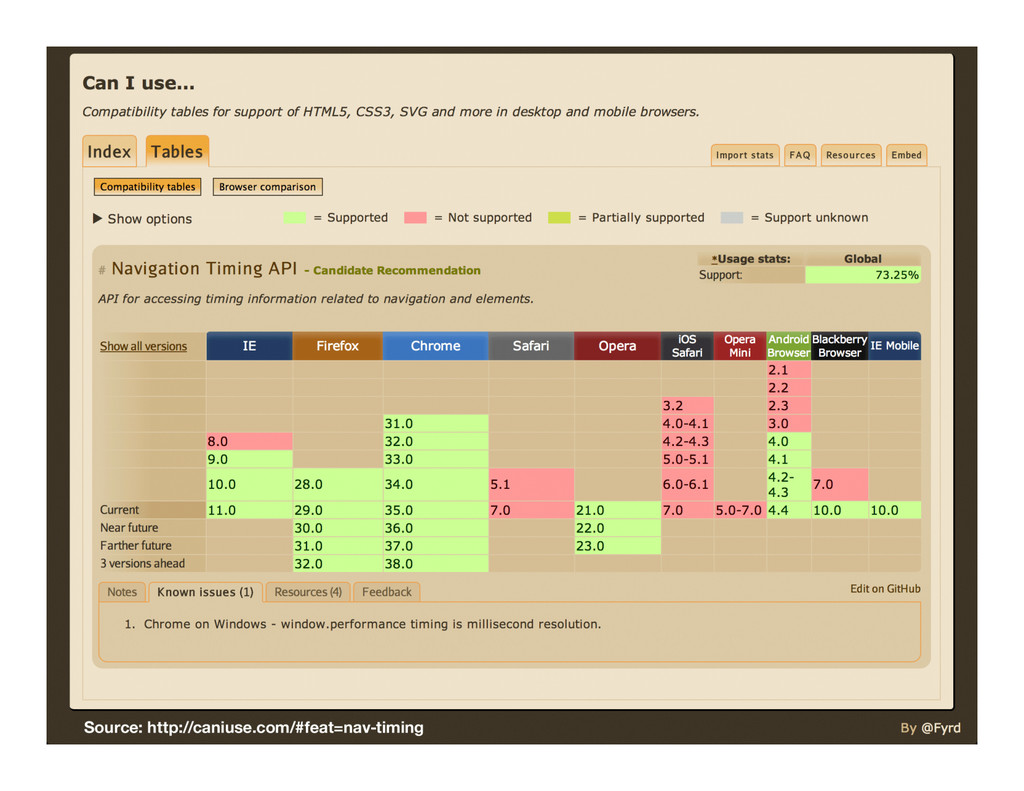
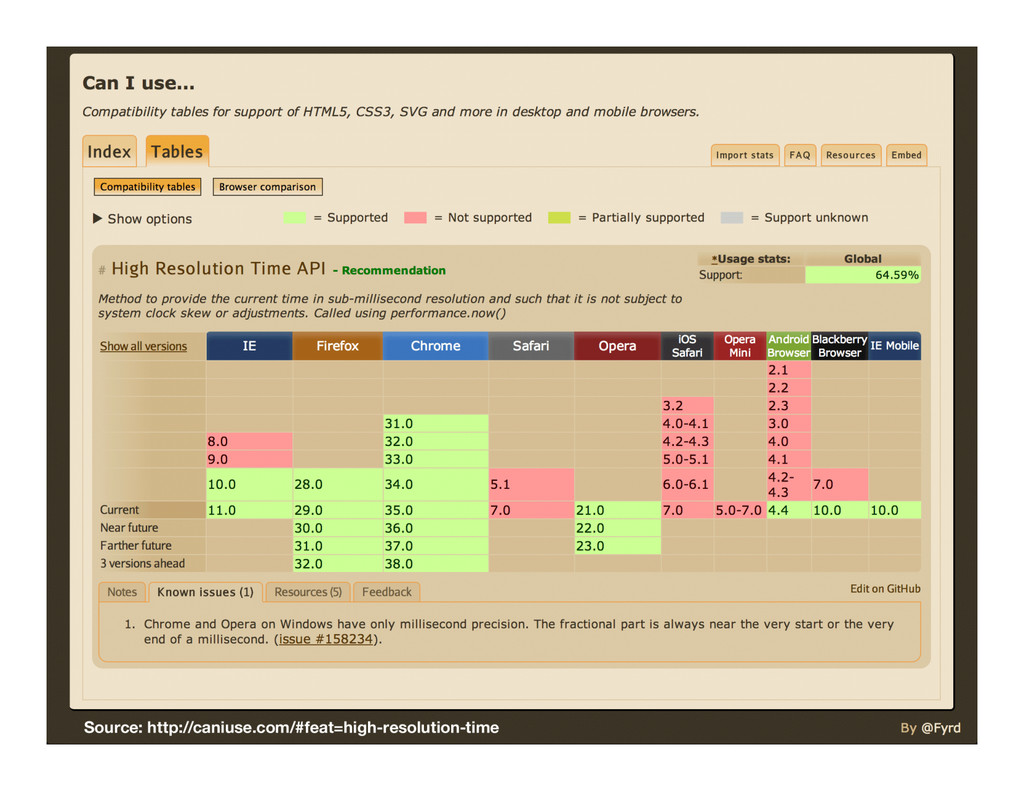
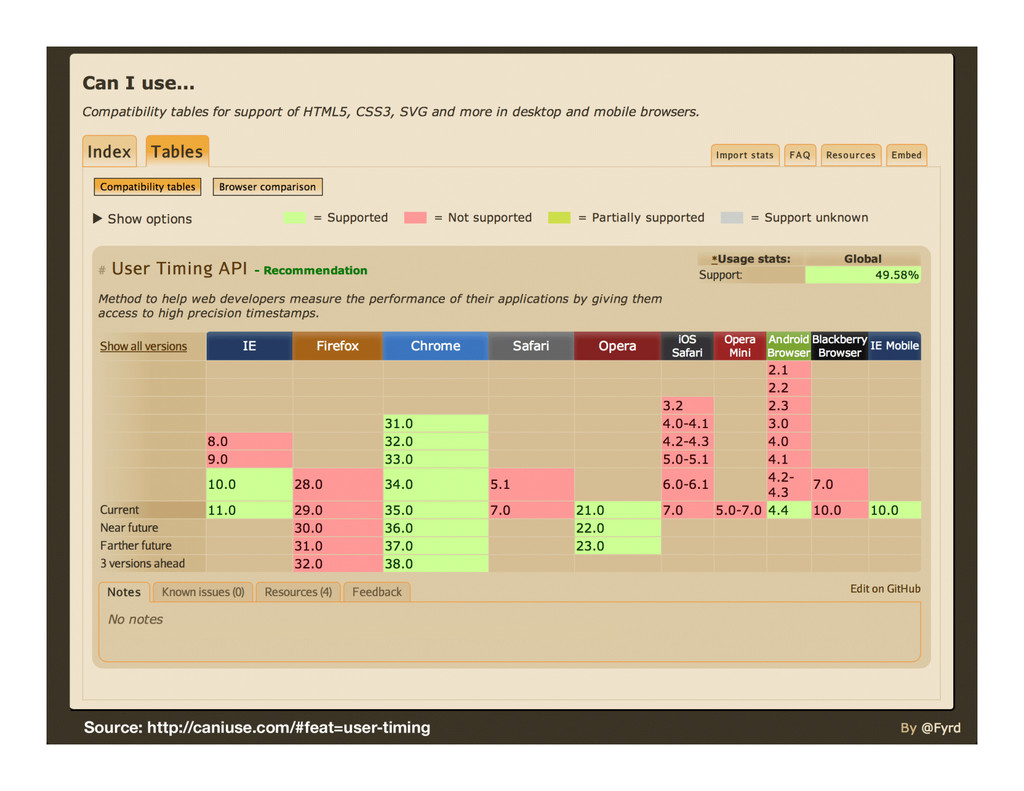
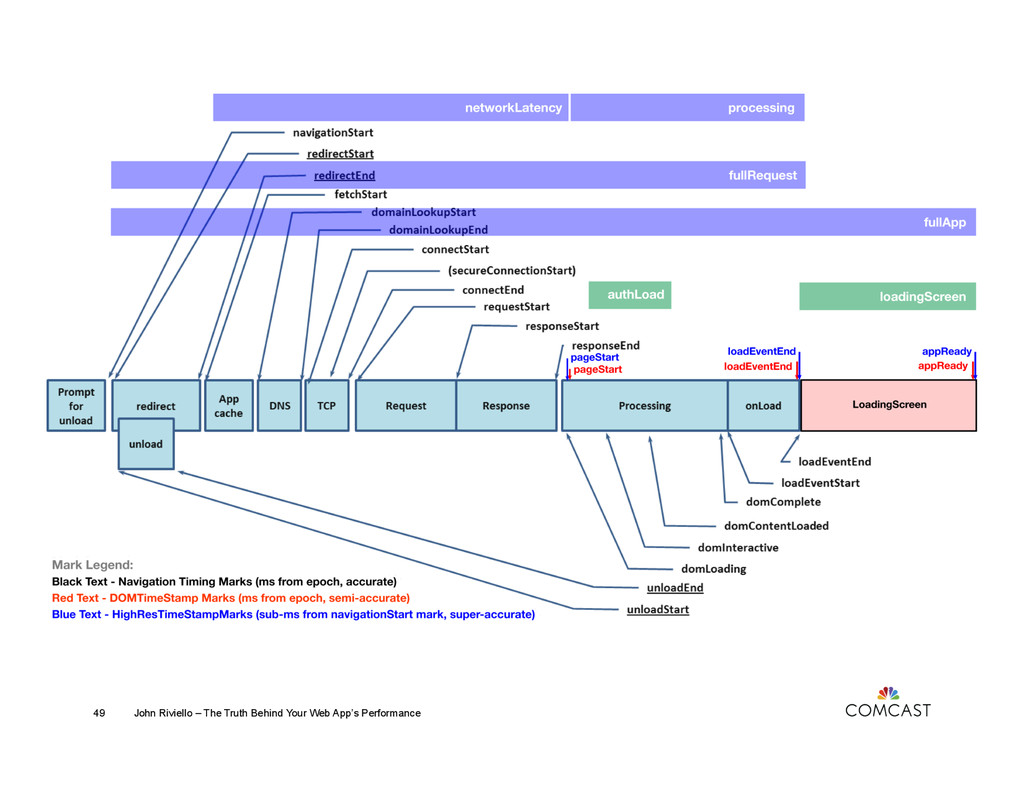
Time John Riviello – The Truth Behind Your Web App’s Performance 38 • DOMHighResTimeStamp is available via window.performance.now() • Provides the time with sub-millisecond accuracy • Measured relative to the navigationStart attribute of the PerformanceTiming interface • Not subject to system clock skew or adjustments (uses a monotonically increasing clock)
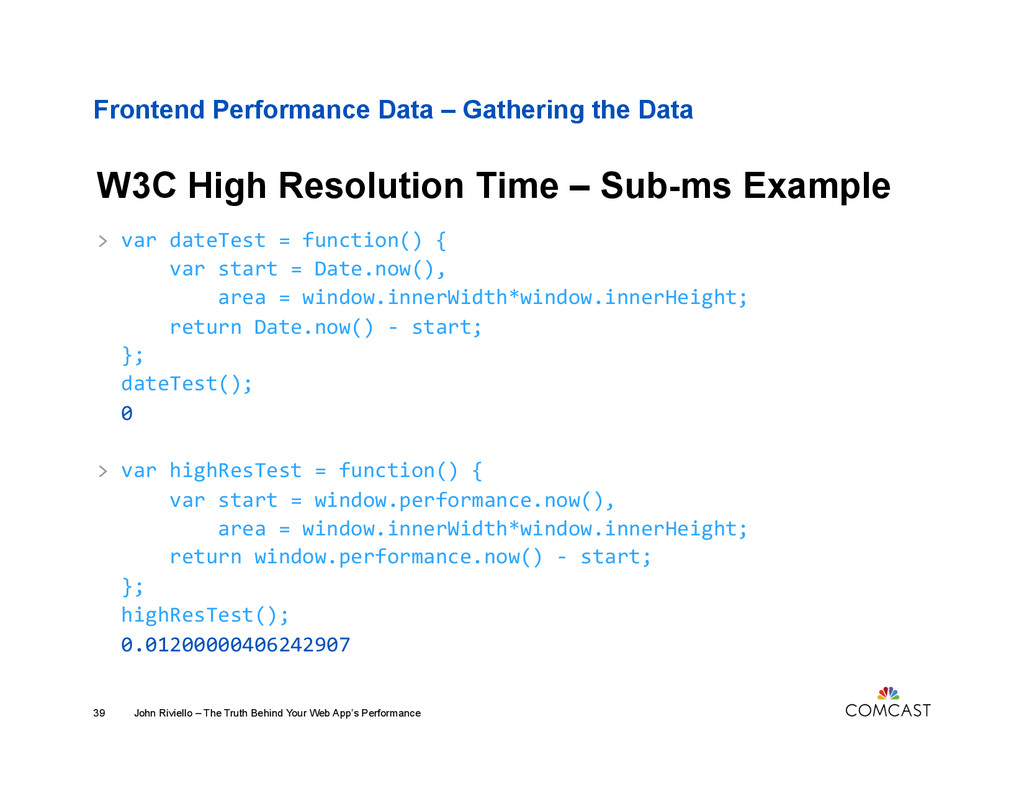
Time – Sub-ms Example John Riviello – The Truth Behind Your Web App’s Performance 39 > var dateTest = function() { var start = Date.now(), area = window.innerWidth*window.innerHeight; return Date.now() -‐ start; }; dateTest(); 0 > var highResTest = function() { var start = window.performance.now(), area = window.innerWidth*window.innerHeight; return window.performance.now() -‐ start; }; highResTest(); 0.01200000406242907
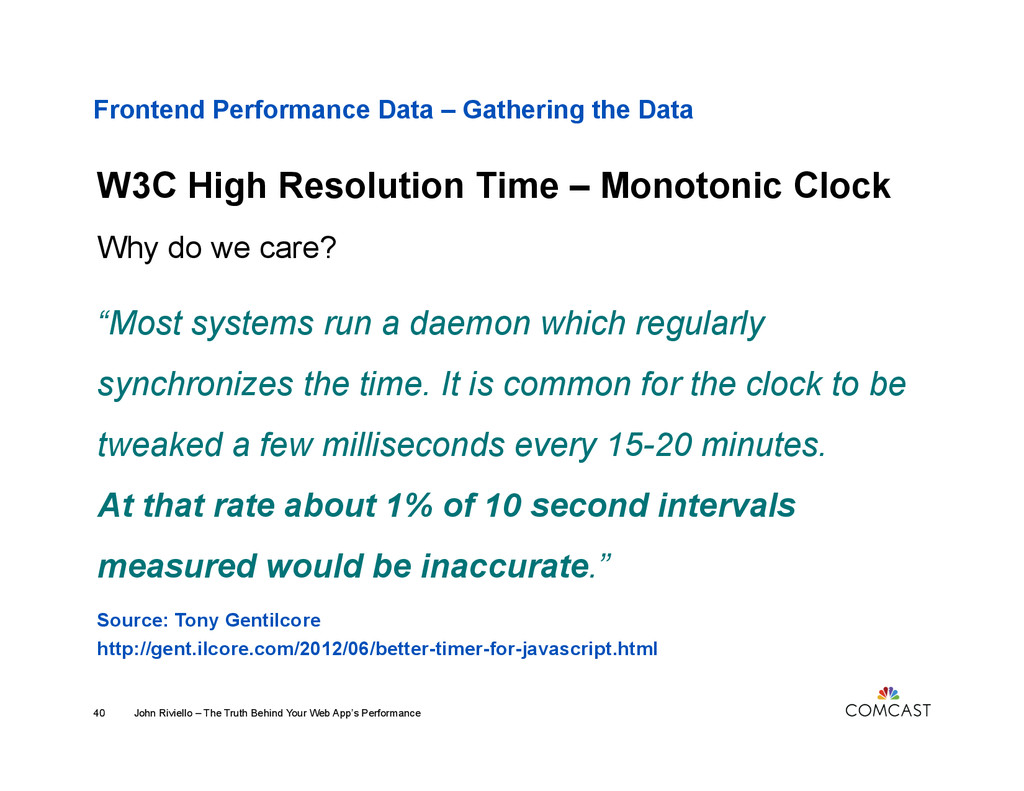
Time – Monotonic Clock John Riviello – The Truth Behind Your Web App’s Performance 40 Why do we care? “Most systems run a daemon which regularly synchronizes the time. It is common for the clock to be tweaked a few milliseconds every 15-20 minutes. At that rate about 1% of 10 second intervals measured would be inaccurate.” Source: Tony Gentilcore http://gent.ilcore.com/2012/06/better-timer-for-javascript.html
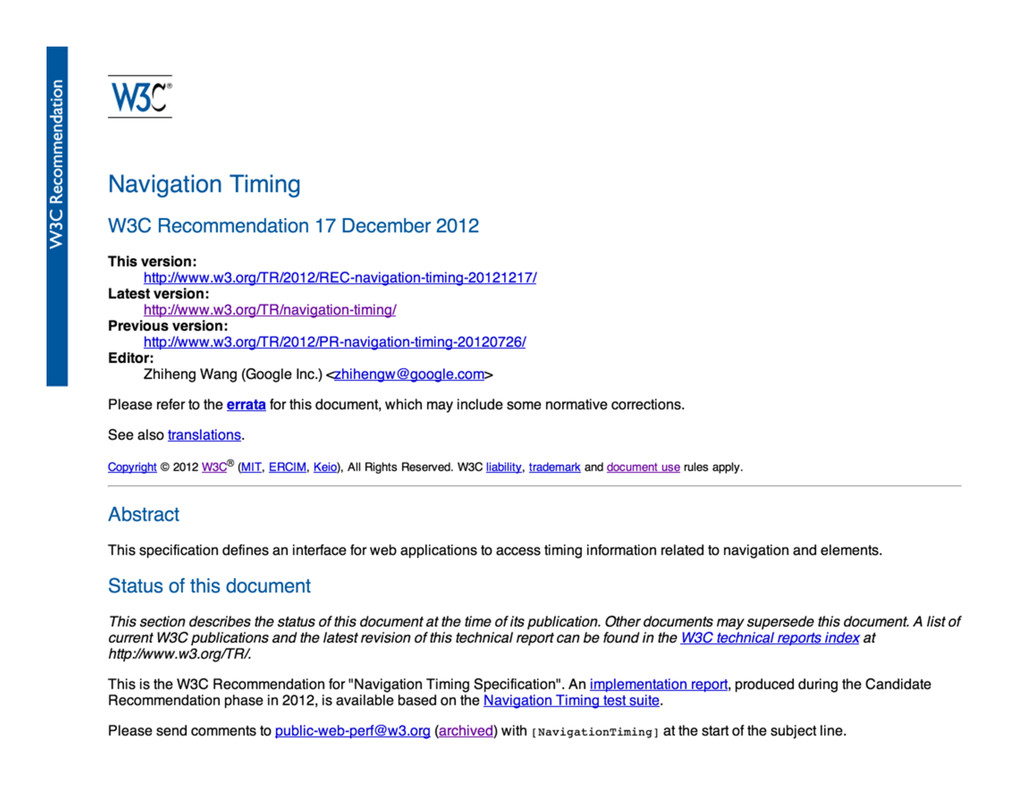
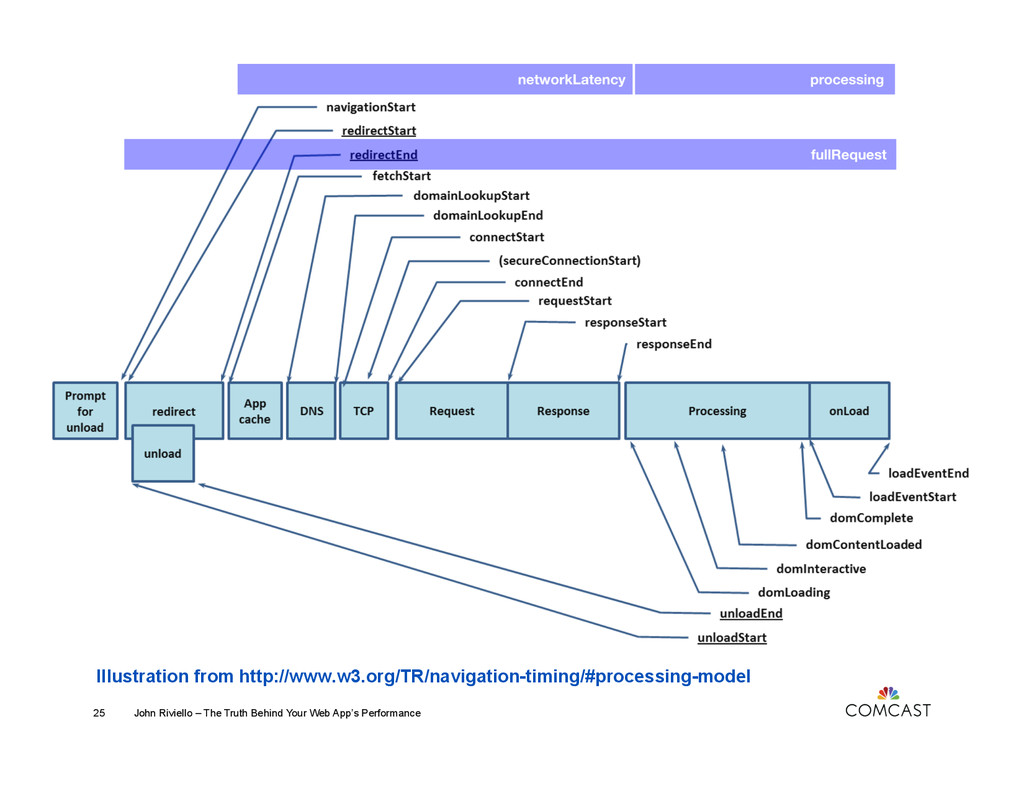
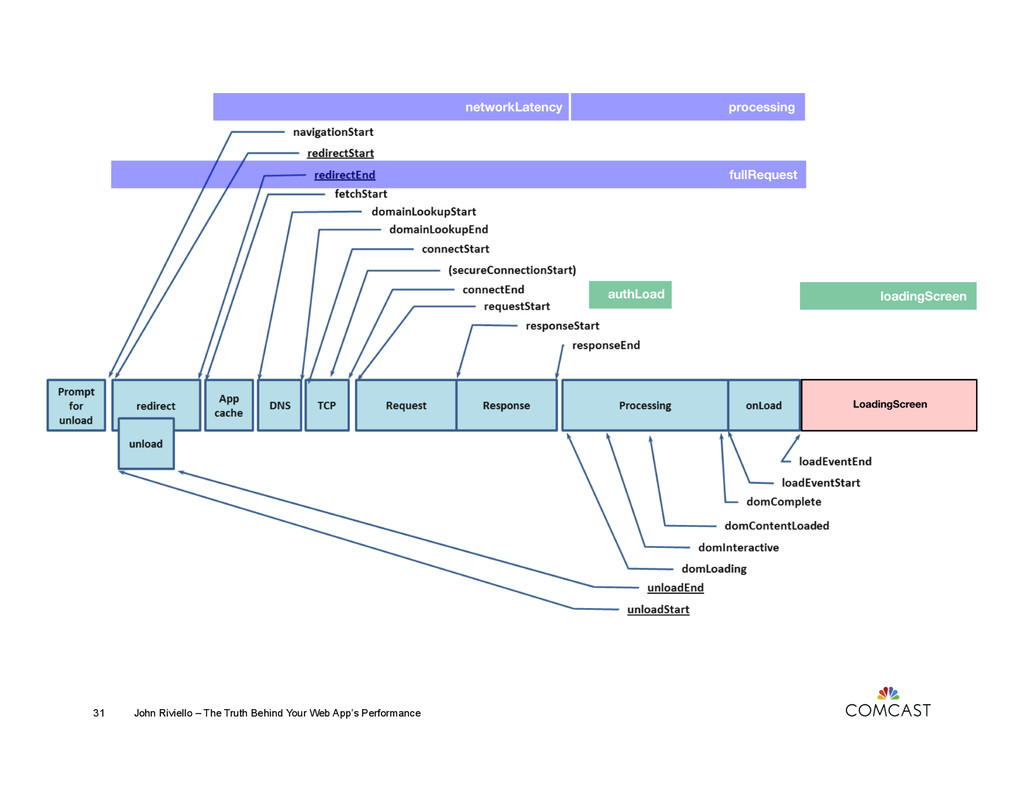
Behind Your Web App’s Performance 66 • Measure first—at the 99th percentile • Log Network Latency, Processing Time, and Full Webpage Request • Log major app-specific events with details • Leverage W3C Performance APIs For Further Info: Twitter: @JohnRiv GitHub: https://github.com/Comcast/Surf-N-Perf