Upgrade to Pro — share decks privately, control downloads, hide ads and more …

Elixir Performance Tuning

Avatar for Josh Price Josh Price
September 05, 2018

Elixir Performance Tuning

Quick overview of some of the tools useful for profiling, measuring and improving the performance of Elixir programs.

Avatar for Josh Price

Josh Price

September 05, 2018
Tweet

More Decks by Josh Price

Other Decks in Programming

Transcript

  1. The real problem is that programmers have spent far too

    much time worrying about efficiency in the wrong places and at the wrong times; premature optimization is the root of all evil (or at least most of it) in programming. -- Donald Knuth
  2. Class Solving • Need to allocate students into classes with

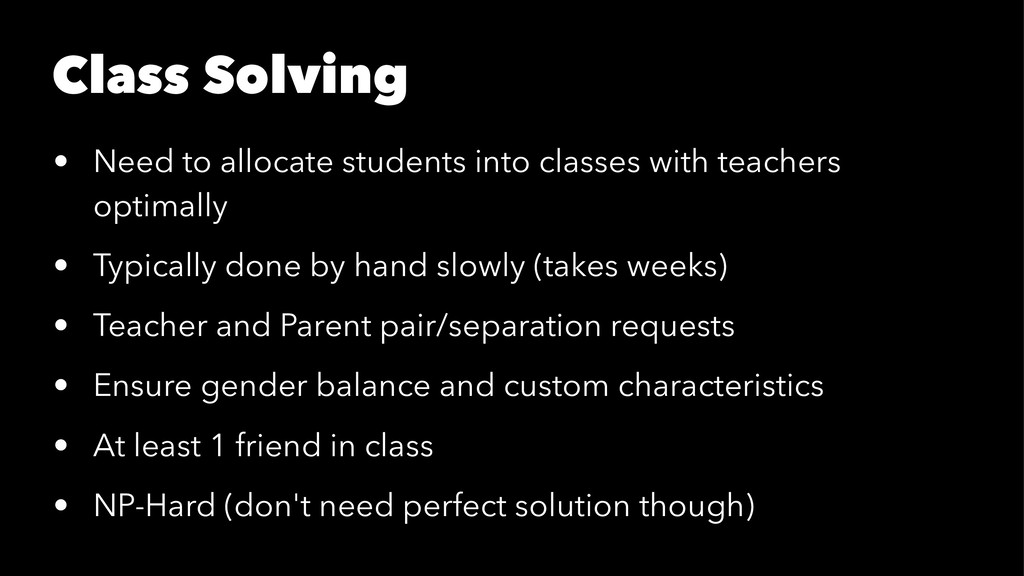
    teachers optimally • Typically done by hand slowly (takes weeks) • Teacher and Parent pair/separation requests • Ensure gender balance and custom characteristics • At least 1 friend in class • NP-Hard (don't need perfect solution though)
  3. Some Background • Solving classes for students is very CPU

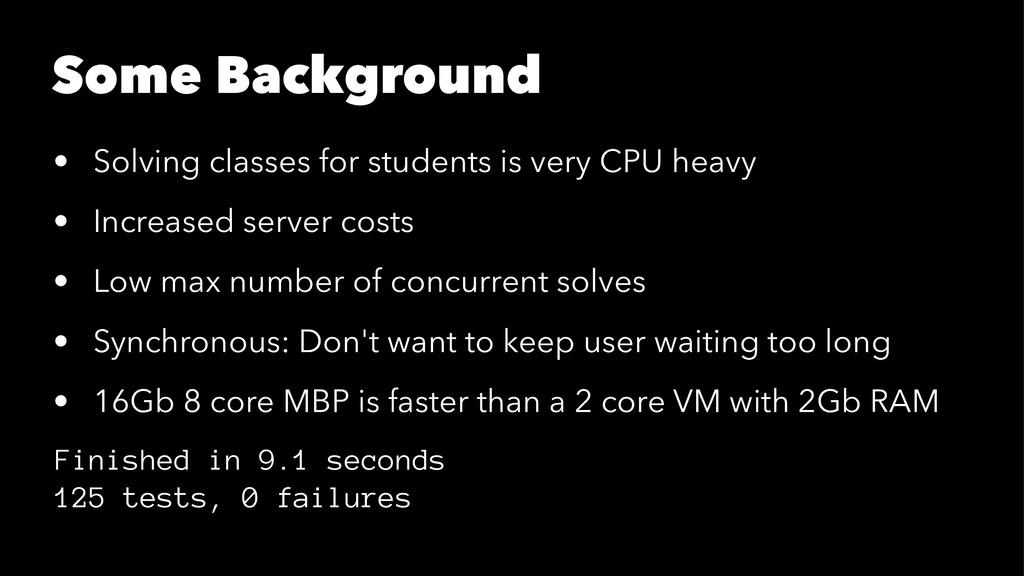
    heavy • Increased server costs • Low max number of concurrent solves • Synchronous: Don't want to keep user waiting too long • 16Gb 8 core MBP is faster than a 2 core VM with 2Gb RAM Finished in 9.1 seconds 125 tests, 0 failures
  4. Possible Problem Areas • Wrong data structure • Wrong algorithm

    • Doing the same thing more than once • Throwing away results you could use again • All of the above
  5. Strategies 1. ~Change the whole algorithm (not yet too risky)~

    2. Find the slow bits by profiling 3. Isolate and optimise 4. Measure improvements 5. Test (make sure it works!) 6. Repeat 2-5 until fast enough
  6. Profiling code • Needed for finding the bottlenecks in your

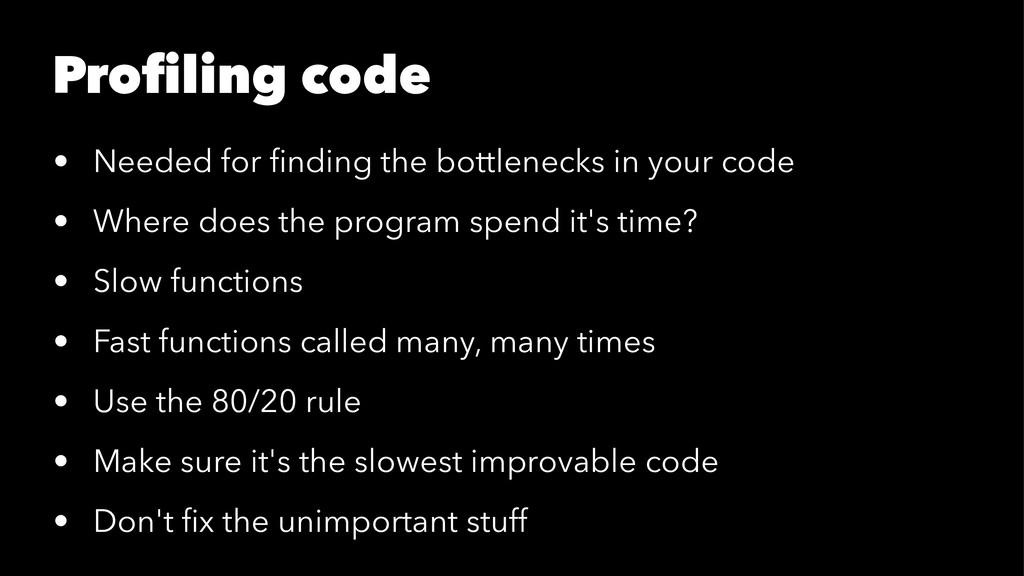
    code • Where does the program spend it's time? • Slow functions • Fast functions called many, many times • Use the 80/20 rule • Make sure it's the slowest improvable code • Don't fix the unimportant stuff
  7. cprof • Nested function call counts across whole program •

    Useful to see what functions are called a lot • Good overview of your modules • No timing info
  8. mix profile.cprof mix profile.cprof -e "[1, 2, 3] |> Enum.reverse

    |> Enum.map(&Integer.to_string/1)" Warmup... CNT Total 9 Enum 6 <-- Enum."-map/2-lists^map/1-0-"/2 4 Enum.reverse/1 1 Enum.map/2 1 :erlang 2 <-- :erlang.trace_pattern/3 2 :elixir_compiler_3 1 <-- anonymous fn/0 in :elixir_compiler_3.__FILE__/1 1 Profile done over 16880 matching functions
  9. --matching <Mod.fun/arity> mix profile.cprof --matching Enum -e "[1, 2, 3]

    |> Enum.reverse |> Enum.map(&Integer.to_string/1)" Warmup... CNT Total 6 Enum 6 <-- Enum."-map/2-lists^map/1-0-"/2 4 Enum.reverse/1 1 Enum.map/2 1 Profile done over 399 matching functions
  10. eprof • Time taken for function calls with counts •

    More info than cprof • Sorted by total time • Start at the bottom of the list
  11. mix profile.eprof mix profile.eprof -e "[1, 2, 3] |> Enum.reverse

    |> Enum.map(&Integer.to_string/1)" Warmup... Profile results of #PID<0.143.0> # CALLS % TIME µS/CALL Total 13 100.0 17 1.31 :lists.reverse/2 1 0.00 0 0.00 :erlang.make_fun/3 1 5.88 1 1.00 Enum.map/2 1 5.88 1 1.00 anonymous fn/0 in :elixir_compiler_1.__FILE__/1 1 5.88 1 1.00 :erlang.apply/2 1 11.76 2 2.00 :erlang.integer_to_binary/1 3 17.65 3 1.00 Enum."-map/2-lists^map/1-0-"/2 4 23.53 4 1.00 Enum.reverse/1 1 29.41 5 5.00 Profile done over 8 matching functions
  12. --matching Enum mix profile.eprof --matching Enum -e "[1, 2, 3]

    |> Enum.reverse |> Enum.map(&Integer.to_string/1)" Warmup... Profile results of #PID<0.143.0> # CALLS % TIME µS/CALL Total 6 100.0 7 1.17 Enum.map/2 1 14.29 1 1.00 Enum."-map/2-lists^map/1-0-"/2 4 42.86 3 0.75 Enum.reverse/1 1 42.86 3 3.00 Profile done over 3 matching functions
  13. fprof • Nested Time taken for function calls with counts

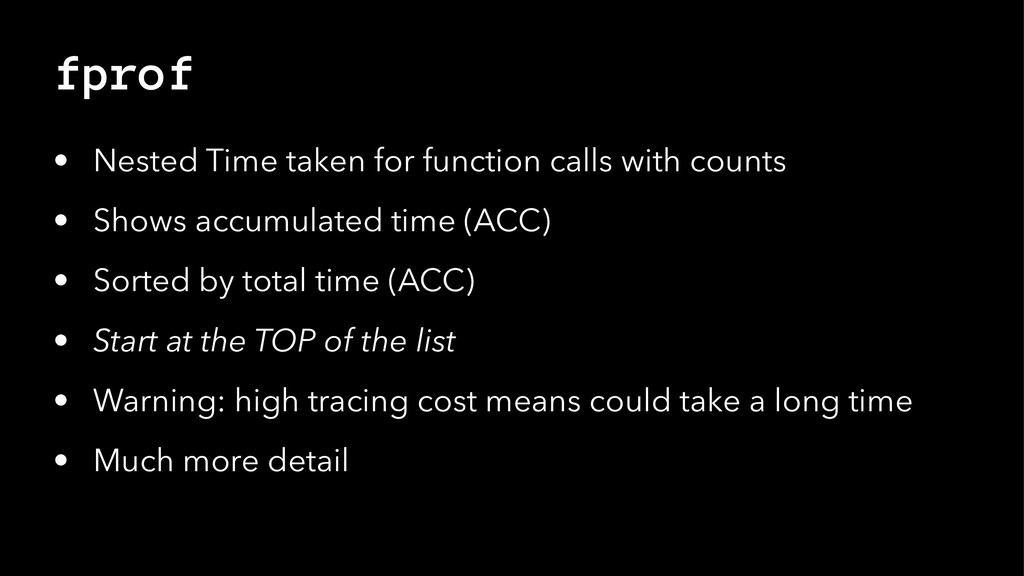
    • Shows accumulated time (ACC) • Sorted by total time (ACC) • Start at the TOP of the list • Warning: high tracing cost means could take a long time • Much more detail
  14. mix profile.fprof mix profile.fprof -e "[1, 2, 3] |> Enum.reverse

    |> Enum.map(&Integer.to_string/1)" Warmup... CNT ACC (ms) OWN (ms) Total 14 0.043 0.043 :fprof.apply_start_stop/4 0 0.043 0.007 anonymous fn/0 in :elixir_compiler_1.__FILE__/1 1 0.032 0.005 Enum.map/2 1 0.020 0.002 Enum."-map/2-lists^map/1-0-"/2 4 0.018 0.015 Enum.reverse/1 1 0.005 0.004 :fprof."-apply_start_stop/4-after$^1/0-0-"/3 1 0.004 0.004 :erlang.integer_to_binary/1 3 0.003 0.003 :erlang.make_fun/3 1 0.002 0.002 :lists.reverse/2 1 0.001 0.001 :undefined 0 0.000 0.000 :suspend 1 0.000 0.000
  15. --callers graph mix profile.fprof --callers -e "[1, 2, 3] |>

    Enum.reverse |> Enum.map(&Integer.to_string/1)" Warmup... CNT ACC (ms) OWN (ms) Total 14 0.043 0.043 anonymous fn/0 in :elixir_compiler_1.__FILE__/1 1 0.021 0.001 Enum.map/2 1 0.021 0.001 <-- Enum."-map/2-lists^map/1-0-"/2 1 0.020 0.011 Enum.map/2 1 0.020 0.011 Enum."-map/2-lists^map/1-0-"/2 3 0.000 0.006 Enum."-map/2-lists^map/1-0-"/2 4 0.020 0.017 <-- :erlang.integer_to_binary/1 3 0.003 0.003 Enum."-map/2-lists^map/1-0-"/2 3 0.000 0.006 anonymous fn/0 in :elixir_compiler_1.__FILE__/1 1 0.005 0.004 Enum.reverse/1 1 0.005 0.004 <-- :lists.reverse/2 1 0.001 0.001 Enum."-map/2-lists^map/1-0-"/2 3 0.003 0.003 :erlang.integer_to_binary/1 3 0.003 0.003 <-- Enum.reverse/1 1 0.001 0.001 :lists.reverse/2 1 0.001 0.001 <--
  16. Measuring with Microbenchmarks • Benchee https://github.com/PragTob/benchee list = Enum.to_list(1..10_000) map_fun

    = fn(i) -> [i, i * i] end Benchee.run(%{ "flat_map" => fn -> Enum.flat_map(list, map_fun) end, "map.flatten" => fn -> list |> Enum.map(map_fun) |> List.flatten end }, time: 10, memory_time: 2)
  17. mix run samples/run.exs Operating System: Linux" CPU Information: Intel(R) Core(TM)

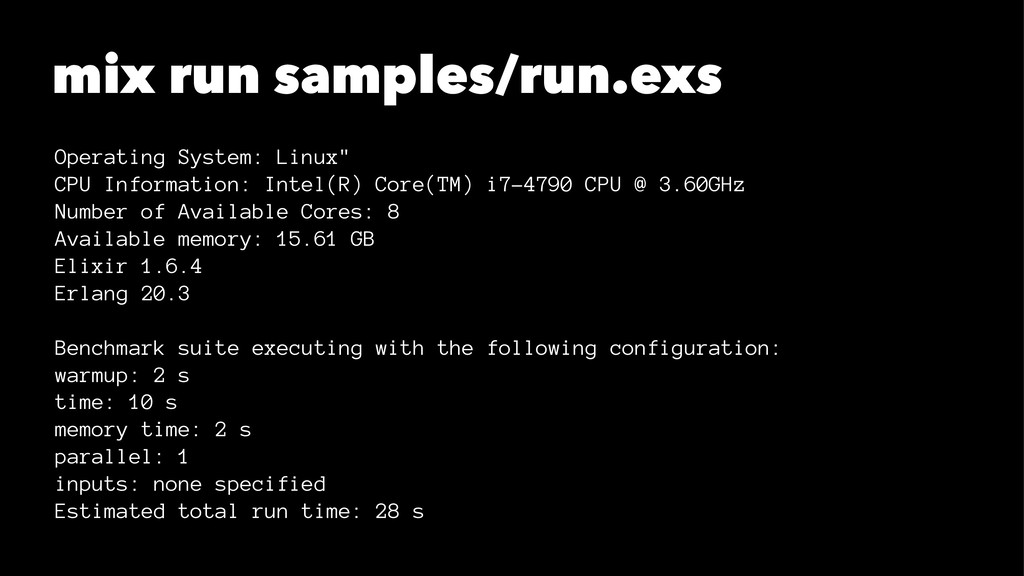
    i7-4790 CPU @ 3.60GHz Number of Available Cores: 8 Available memory: 15.61 GB Elixir 1.6.4 Erlang 20.3 Benchmark suite executing with the following configuration: warmup: 2 s time: 10 s memory time: 2 s parallel: 1 inputs: none specified Estimated total run time: 28 s
  18. mix run samples/run.exs Benchmarking flat_map... Benchmarking map.flatten... Name ips average

    deviation median 99th % flat_map 2.31 K 433.25 μs ±8.64% 428 μs 729 μs map.flatten 1.22 K 822.22 μs ±16.43% 787 μs 1203 μs Comparison: flat_map 2.31 K map.flatten 1.22 K - 1.90x slower Memory usage statistics: Name Memory usage flat_map 625.54 KB map.flatten 781.85 KB - 1.25x memory usage
  19. Reminders • Only optimize as last resort • Good tests

    stop you breaking things • Only work on the slowest code • Measure!