Upgrade to Pro — share decks privately, control downloads, hide ads and more …

Flare Rate Evolution Revealed by Kepler

Flare Rate Evolution Revealed by Kepler

A talk given for the Kepler/K2 Science Conference at NASA Ames (June 2017)

James Davenport

June 22, 2017
Tweet

More Decks by James Davenport

Other Decks in Science

Transcript

  1. Flare Rate Evolution! Revealed by Kepler! James R. A. Davenport!

    jradavenport! Student Collaborators: Riley Clarke, Zachery Laycock! DIRAC Fellow - University of Washington! NSF Astronomy & Astrophysics Fellow - Western Washington University!
  2. @jradavenport! See KeplerSciCon contributions: superflare & starspots – Notsu, Ikuta,

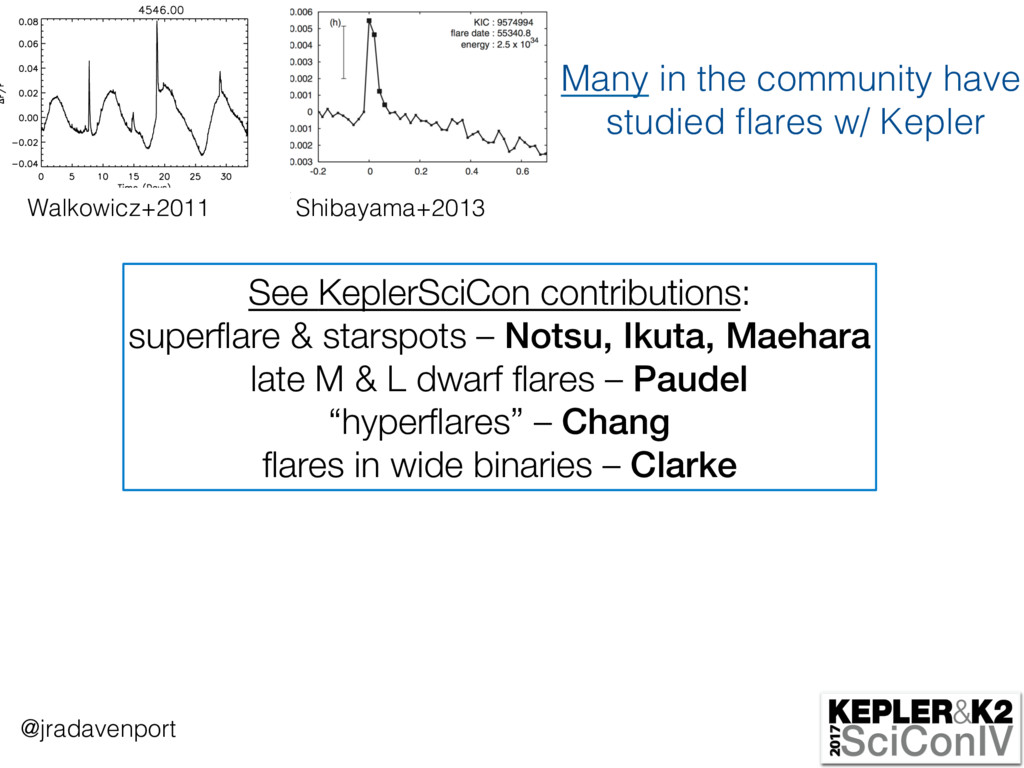
    Maehara! late M & L dwarf flares – Paudel! “hyperflares” – Chang! flares in wide binaries – Clarke! Shibayama+2013! Many in the community have studied flares w/ Kepler! (b) Example light curves of four flaring K dwarfs. M dwarf (top) and K dwarf (bottom) light curves from Quarter 1. The effective temperature of the star is listed above each plot. bed in the previous section. Figure5 as a function of Kepler magnitude, ld overplotted. As three red filled K5, and M0 dwarfs would intersect placed at a distance of 200 pc. At ly more luminous stars are brighter erefore, although the emission from er contrast with their photospheres, aller flares on them compared with nce because of their relatively lower e associated with the same mag- at produce starspots, one might a correlation between the pho- tometric variability of the light curve due to spots and the presence of flares. We quantify the bulk variability as “variability range,” the range between the 5th and the 95th percentile amplitude in the light curve (discussed in further detail in Basri et al. 2011). In the center panel of Figure 6, we show the relationship between the median EWphot for the K dwarfs (black asterisks) and M dwarfs (red diamonds) and the photometric range in millimagnitudes. The flanking pan- els show the histograms of the range (at top) and EWphot (at right) for the K and M dwarfs (solid black and red dashed lines, respectively). As flares were measured with the bulk photomet- ric variability removed from the light curve, the trend between range and EWphot indicates that flares with larger relative en- ergy (as measured by EWphot ) do take place on stars with greater 4 Walkowicz+2011!
  3. Stellar Age vs. Magnetic Activity! Lyra (2005)! log Ca II

    Flux log age (yrs) ACTIVE!! inactive! More Flares Fewer Flares @jradavenport!
  4. Large Flare Samples! •  6107 unique flares for GJ 1243

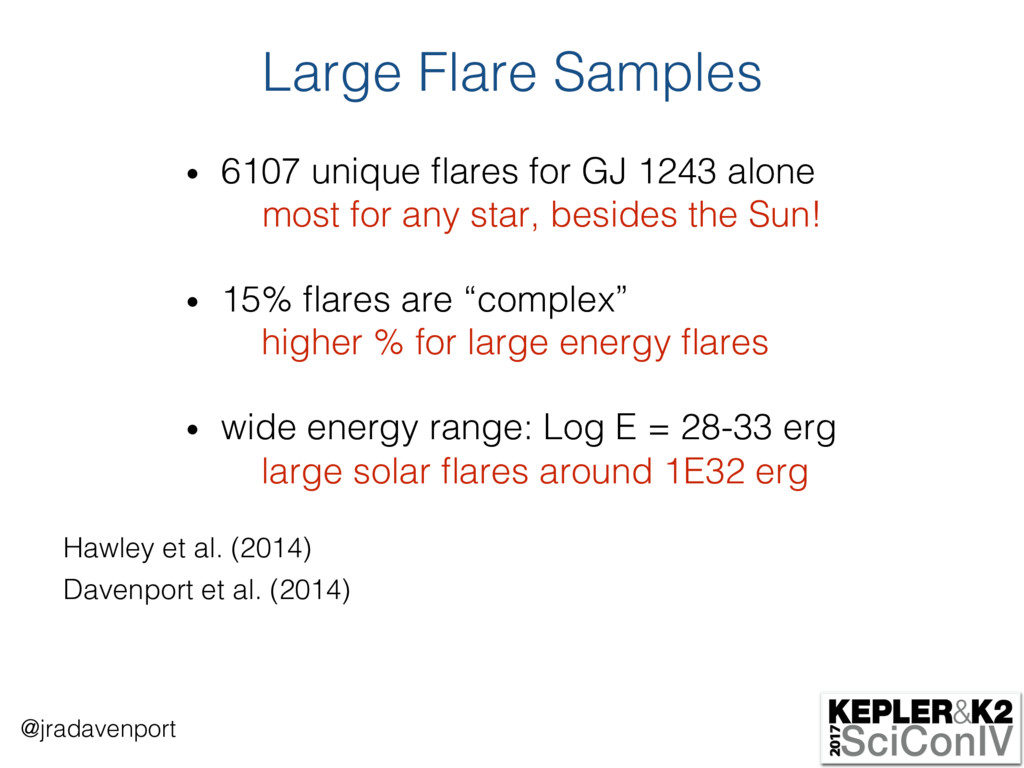
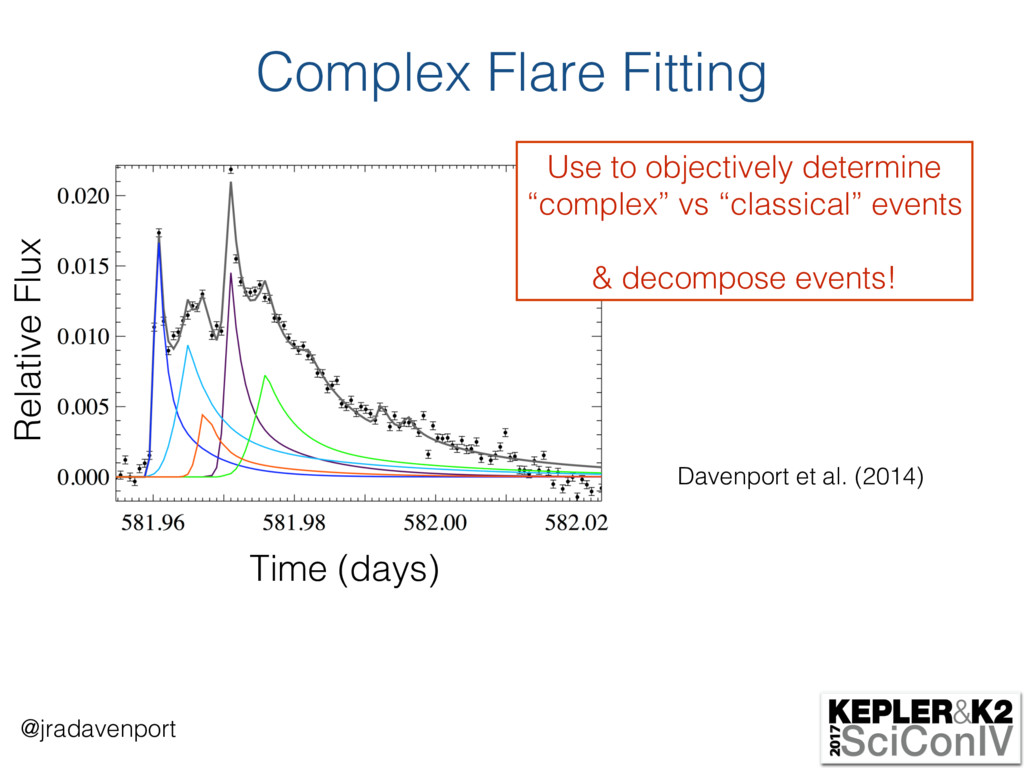
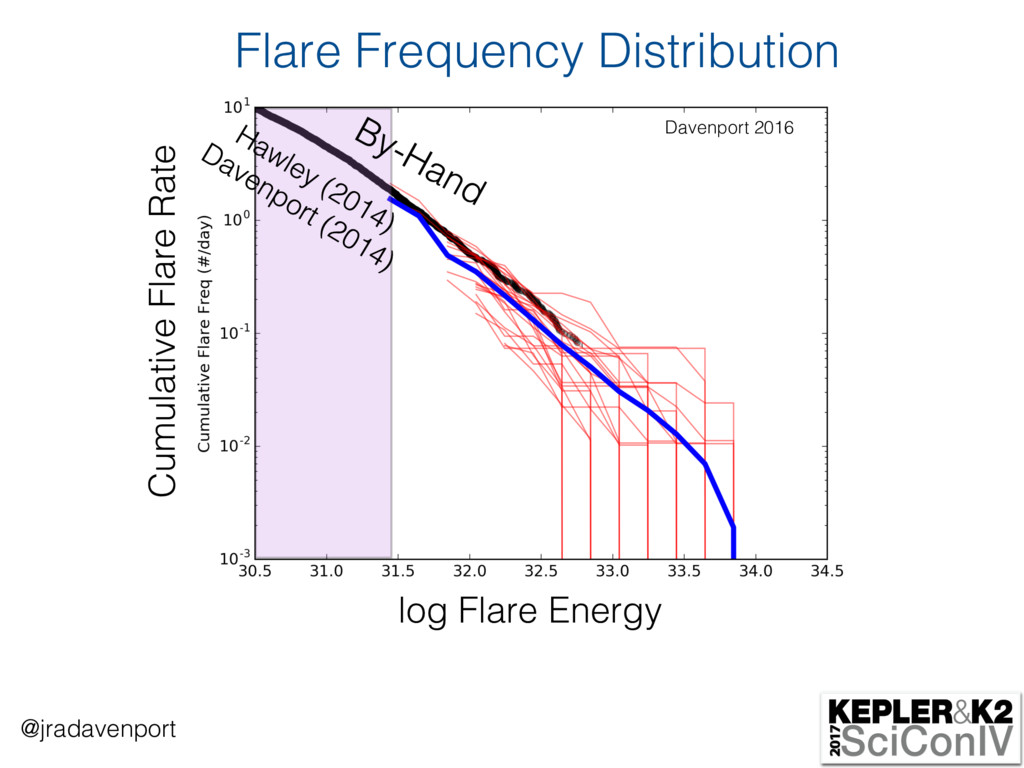
    alone! most for any star, besides the Sun!! •  15% flares are “complex”! higher % for large energy flares! •  wide energy range: Log E = 28-33 erg! large solar flares around 1E32 erg! Hawley et al. (2014)! Davenport et al. (2014)! @jradavenport!
  5. Flare Template: Study Morphology! 885 “clean” flares from GJ 1243!

    Time (FWHM)! @jradavenport! Davenport et al. (2014)!
  6. Complex Flare Fitting! Use to objectively determine ! “complex” vs

    “classical” events! ! & decompose events!! Time (days)! Relative Flux! @jradavenport! Davenport et al. (2014)!
  7. 3 steps to find flares in Kepler:! @jradavenport! 1.  Detrend

    ! 2.  Detect! 3.  Distrust! – iterative removal of “noise”! – find “significant” peaks! – artificial flare injection and recovery!
  8. Cumulative Flare Rate! Davenport 2016 ! log Flare Energy! 68%

    Completeness Test Limit! individual quarters ! of data! Flare Frequency Distribution! @jradavenport!
  9. Flare Activity vs. Rossby Number! β = –1! Rosat =

    0.03 ! G8–M4! Rossby Number! Davenport 2016 ! @jradavenport!
  10. Add terms for mass and age Fit with powerlaw flare

    rate slope! specific flare rate! *Age from gyrochronology model! @jradavenport!
  11. log flare rate (#/day)! Lbol-corrected! Flare Rate vs. (Mass, Age)!

    Davenport et al. (2017 in prep)! @jradavenport!
  12. Activity Cycles from Flares?! Solar Max! Solar Min! Veronig et

    al. (2002)! Flare rate varies by an order of magnitude between active/quiet Sun!! @jradavenport!
  13. The “ghost” of Jupiter K2 C0 Pointing Forward, Looking Back

    K2 “Observing” Earth with a Full Frame Image, a unique public outreach opportunity James Davenport & Erin Ryan Please give us data J @jradavenport!
  14. Summary! Kepler, a revolution for flare studies! Flares evolve like

    other ! B activity metrics! Flare rates do change ! with stellar age!! Flare rate models ! now available!! @jradavenport!