Upgrade to Pro — share decks privately, control downloads, hide ads and more …

Mapping Tools - Analysis and Visualization of Spatial Data

Mapping Tools - Analysis and Visualization of Spatial Data

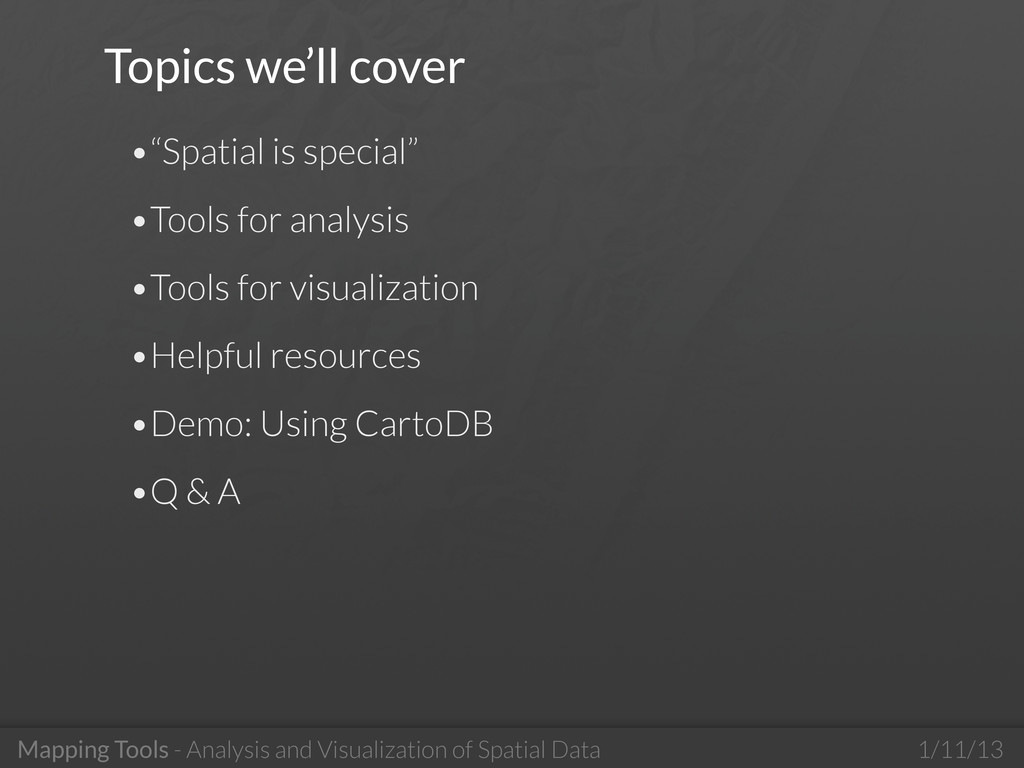
Brief introduction and overview of some existing mapping tools, leading up to a demo of CartoDB. Presented to Penn State's Hacking Science group January 11, 2013.

(Download as PDF to access embedded hyperlinks)

Gist for CartoDB demo: https://gist.github.com/4541842

Joshua Stevens

January 11, 2013
Tweet

More Decks by Joshua Stevens

Other Decks in Education

Transcript

  1. Hands on session:
    Mapping Tools - Analysis and Visualization of Spatial Data
    Hacking Science
    Joshua Stevens
    Dept. of Geography

    View Slide

  2. Mapping Tools - Analysis and Visualization of Spatial Data 1/11/13
    Topics we’ll cover
    •“Spatial is special”
    •Tools for analysis
    •Tools for visualization
    •Helpful resources
    •Demo: Using CartoDB
    •Q & A

    View Slide

  3. “Spatial is special.”
    Every geographer. Ever.

    View Slide

  4. Mapping Tools - Analysis and Visualization of Spatial Data 1/11/13
    What makes spatial data special?
    •“Where?” is relative
    •Distance isn’t so simple
    •Earth isn’t a flat, rectangular surface
    •Scale
    •Topology
    •Modifiable Areal Unit Problem
    •Spatial autocorrelation
    •No perfect spatial data model

    View Slide

  5. Tools for Analysis

    View Slide

  6. Mapping Tools - Analysis and Visualization of Spatial Data 1/11/13
    Esri ArcGIS
    rockware.com
    www.esri.com

    View Slide

  7. Mapping Tools - Analysis and Visualization of Spatial Data 1/11/13
    Esri ArcGIS
    •De facto standard GIS
    •10.1 installed in campus labs
    •1-year licenses for students
    •Supports vector and raster analysis
    •Hundreds of tools
    •Model builder
    •Python
    •Many training and certification options

    View Slide

  8. Mapping Tools - Analysis and Visualization of Spatial Data 1/11/13
    Esri ArcGIS Online
    www.arcgis.com/home/webmap/viewer.html

    View Slide

  9. Mapping Tools - Analysis and Visualization of Spatial Data 1/11/13
    Quantum GIS (QGIS)

    View Slide

  10. Mapping Tools - Analysis and Visualization of Spatial Data 1/11/13
    Quantum GIS (QGIS)
    It’s open source!
    Go get it. Right now.
    www.qgis.org

    View Slide

  11. Mapping Tools - Analysis and Visualization of Spatial Data 1/11/13
    Quantum GIS (QGIS)
    •Actively developed
    •Supports GRASS, PostgreSQL/PostGIS, OSM...
    •Great vector and raster tools
    •Easy to make your own / DL from others
    •Scriptable: Python

    View Slide

  12. Mapping Tools - Analysis and Visualization of Spatial Data 1/11/13
    PostGIS for PostgreSQL
    •“Spatially enabled PostgreSQL”
    •Immensely powerful (and fast!)
    •No direct GUI
    SELECT ST_Extent(geom) FROM places WHERE
    place = 'STATE COLLEGE';
    www.postgis.org

    View Slide

  13. Mapping Tools - Analysis and Visualization of Spatial Data 1/11/13
    R (with spatial packages)
    •A stats favorite
    •Great for analysis, so-
    so visualization
    •Point patterns, trends,
    interpolation
    •Recommended
    packages:
    statisfaction.wordpress.com
    ggplot2, maps, splancs, spatstat, mapproj
    www.cran.r-project.org
    www.rstudio.com

    View Slide

  14. Mapping Tools - Analysis and Visualization of Spatial Data 1/11/13
    CartoDB
    www.cartodb.com

    View Slide

  15. Mapping Tools - Analysis and Visualization of Spatial Data 1/11/13
    CartoDB
    •Analysis, visualization, and sharing
    •Load data -> PostGIS -> Style -> Share
    •Developer APIs: CartoDB.js & SQL API
    •Support for D3, Leaflet, R
    FREE for .edu

    View Slide

  16. Tools for Visualization

    View Slide

  17. Mapping Tools - Analysis and Visualization of Spatial Data 1/11/13
    TileMill
    www.mapbox.com/tilemill

    View Slide

  18. Mapping Tools - Analysis and Visualization of Spatial Data 1/11/13
    TileMill
    •CartoCSS for styling
    •Smart selectors
    •Shapefiles, PostGIS, SQLite, GeoJSON, CSV...
    •Interaction
    •Embed on web / mobile, export tiles, PDF, SVG, PNG
    •Publish on MapBox
    •Open source

    View Slide

  19. Mapping Tools - Analysis and Visualization of Spatial Data 1/11/13
    MapBox
    www.mapbox.com

    View Slide

  20. Mapping Tools - Analysis and Visualization of Spatial Data 1/11/13
    MapBox
    •Cloud-based map design
    •Add public layers, base
    maps
    •Load your data from
    TileMill
    •Embed or share
    •Free account limited to
    3,000 map views
    •Use in Leaflet via Wax.js

    View Slide

  21. Mapping Tools - Analysis and Visualization of Spatial Data 1/11/13
    Leaflet
    www.leafletjs.com

    View Slide

  22. Mapping Tools - Analysis and Visualization of Spatial Data 1/11/13
    Leaflet
    •Displays tiles, adds interactivity, markers
    •Very efficient, works well on mobile devices
    •Your tiles can be almost anything
    A Map of Thrones?! That’s Westeros....tiled in Leaflet

    View Slide

  23. Mapping Tools - Analysis and Visualization of Spatial Data 1/11/13
    D3
    www.d3js.org

    View Slide

  24. Mapping Tools - Analysis and Visualization of Spatial Data 1/11/13
    D3
    •Data Driven Documents
    •JavaScript for HTML+SVG styled with CSS
    •Huge (and growing) set of examples
    •Impressive geographic capability
    •Not for noobs, requires JS proficiency
    •Can use alongside other tools: MapBox, Leaflet,
    CartoDB, Google Maps...

    View Slide

  25. Mapping Tools - Analysis and Visualization of Spatial Data 1/11/13
    For an in-depth comparison of these and numerous other
    tools, please see:
    Donohue RG, TR Wallace, RE Roth, and TMA
    Buckingham. 2012. Keeping pace with emerging web
    mapping technologies. North American Cartographic
    Information Society (NACIS). Portland, OR: October
    17-19.

    View Slide

  26. Helpful Resources

    View Slide

  27. Mapping Tools - Analysis and Visualization of Spatial Data 1/11/13
    ColorBrewer
    www.colorbrewer2.org

    View Slide

  28. Mapping Tools - Analysis and Visualization of Spatial Data 1/11/13
    MapShaper
    http://mapshaper.com/test/MapShaper.swf

    View Slide

  29. Mapping Tools - Analysis and Visualization of Spatial Data 1/11/13
    GeoCommons
    www.geocommons.com

    View Slide

  30. Demo: CartoDB

    View Slide

  31. Mapping Tools - Analysis and Visualization of Spatial Data 1/11/13
    Questions?
    Joshua Stevens | [email protected] | @jscarto
    Slides available online at: bit.ly/USMVsI

    View Slide