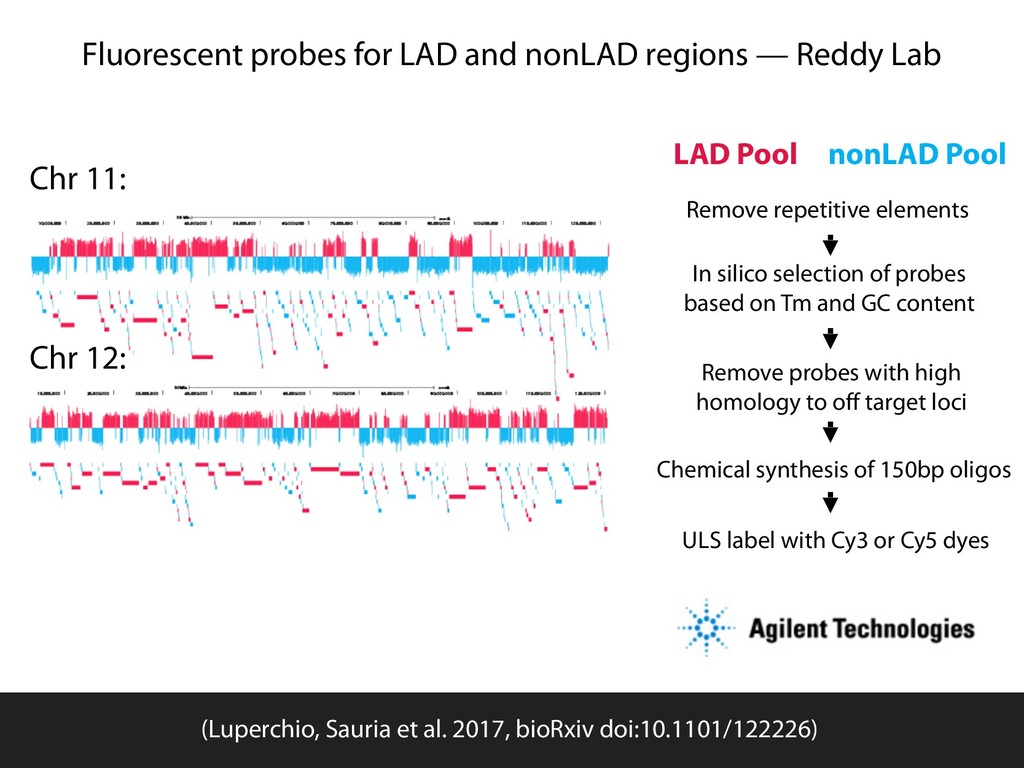
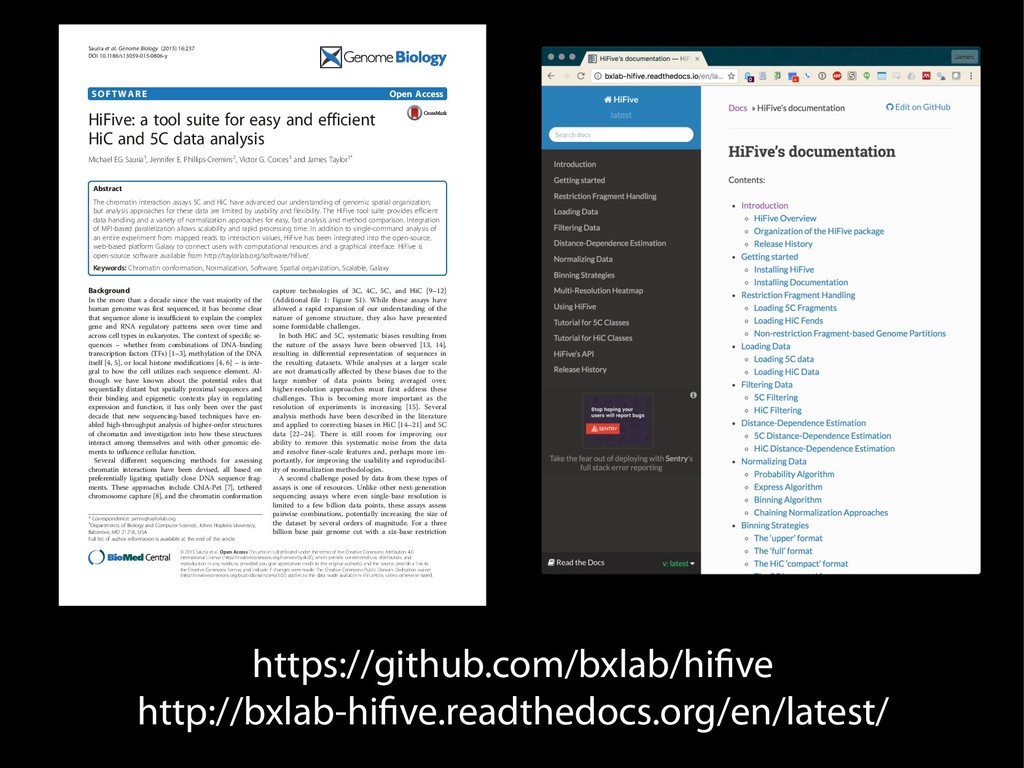
Sauria. Chromosome conformation paints: Teresa Luperchio and Karen Reddy HiFive available from github.com/bxlab/hifive, or . Our lab: Enis Afgan, Dannon Baker, Boris Brenerman, Min Hyung Cho, Dave Clements, Peter DeFord, Sam Guerler, Nathan Roach, Michael E. G. Sauria, German Uritskiy Other collaborators: Anton Nekrutenko and the group, Craig Stewart and the group Ross Hardison and the VISION group Jennifer Phillips-Cremins and Victor Corces (sub-TADS and HiFive) Johnston, Kim, Hilser, and DiRuggiero labs (JHU Biology) Battle, Langmead, Leek, Schatz, Timp lab (JHU Genomics Collective) NHGRI (HG005133, HG004909, HG005542, HG005573, HG006620) NIDDK (DK065806) and NSF (DBI 0543285, DBI 0850103) funded by the National Science Foundation Award #ACI-1445604 install with bioconda
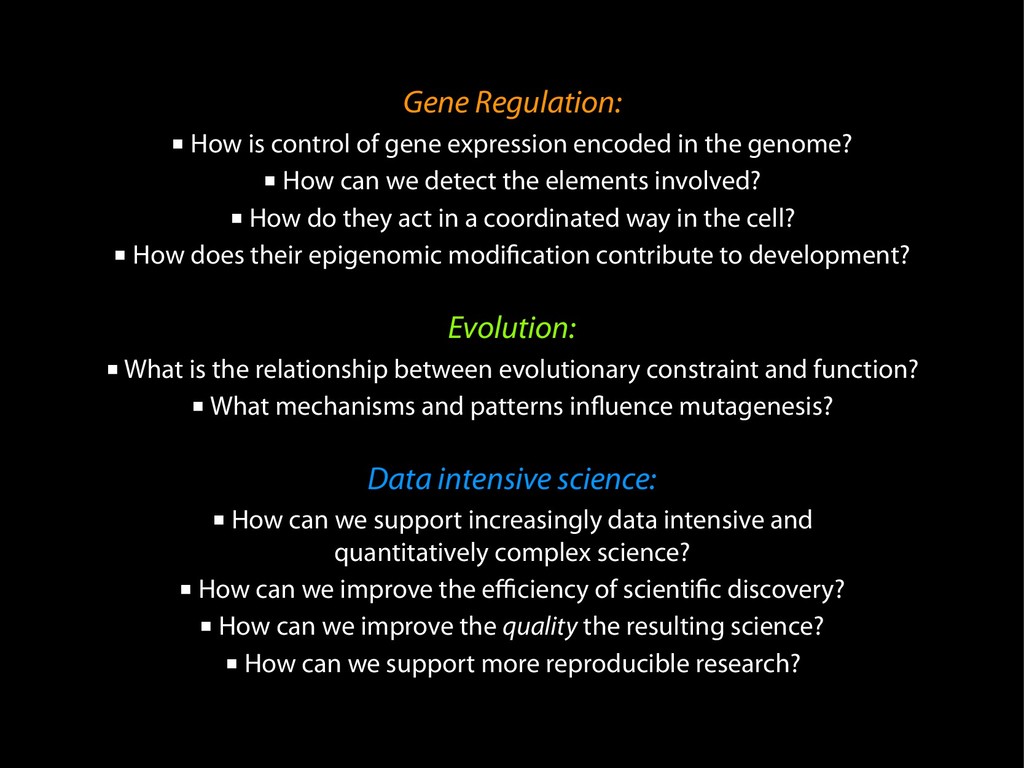
in the genome? ▪ How can we detect the elements involved? ▪ How do they act in a coordinated way in the cell? ▪ How does their epigenomic modification contribute to development? Evolution: ▪ What is the relationship between evolutionary constraint and function? ▪ What mechanisms and patterns influence mutagenesis? Data intensive science: ▪ How can we support increasingly data intensive and quantitatively complex science? ▪ How can we improve the efficiency of scientific discovery? ▪ How can we improve the quality the resulting science? ▪ How can we support more reproducible research?
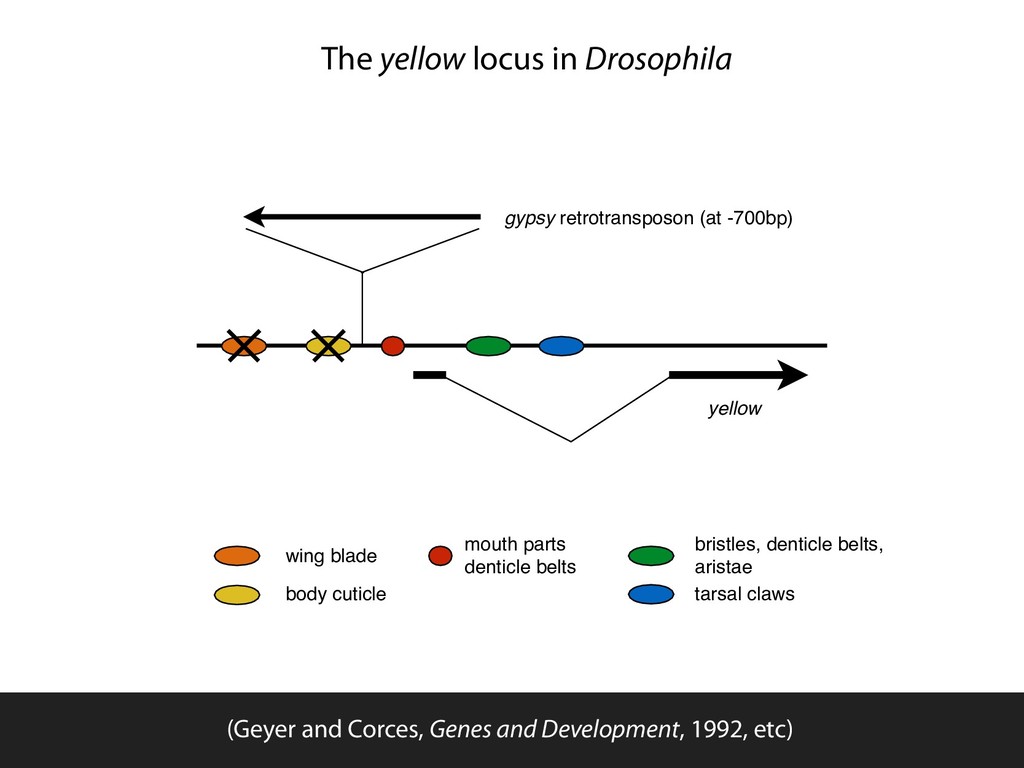
parts denticle belts bristles, denticle belts, aristae tarsal claws The yellow locus in Drosophila (Geyer and Corces, Genes and Development, 1992, etc)
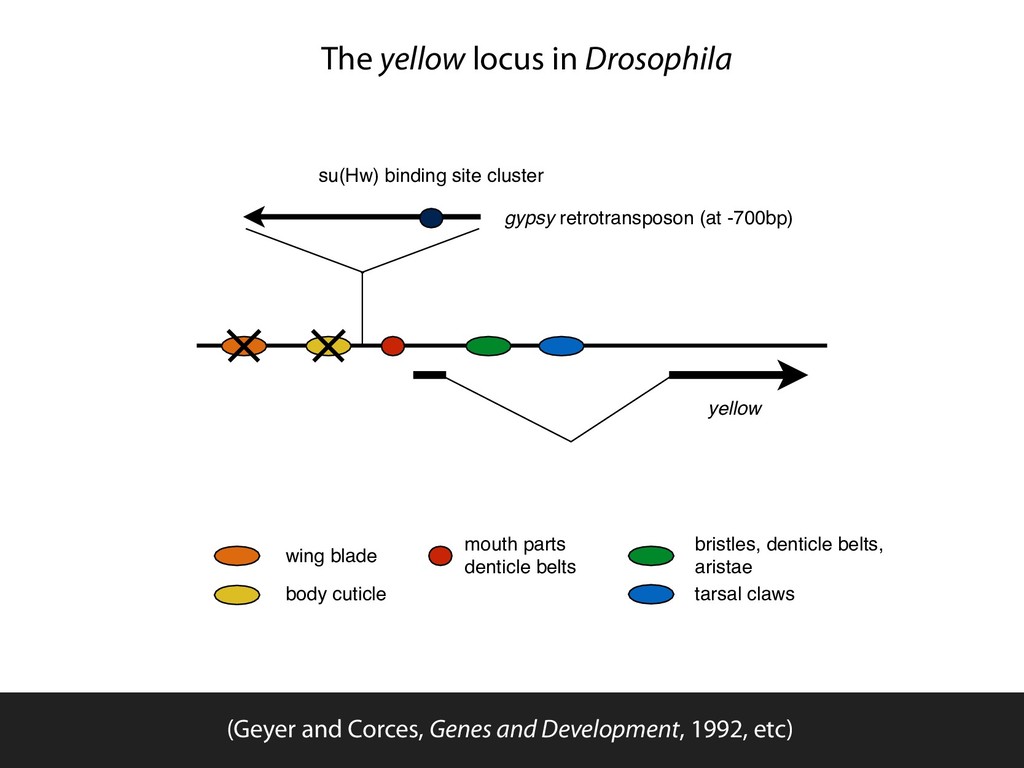
blade body cuticle mouth parts denticle belts bristles, denticle belts, aristae tarsal claws The yellow locus in Drosophila (Geyer and Corces, Genes and Development, 1992, etc)
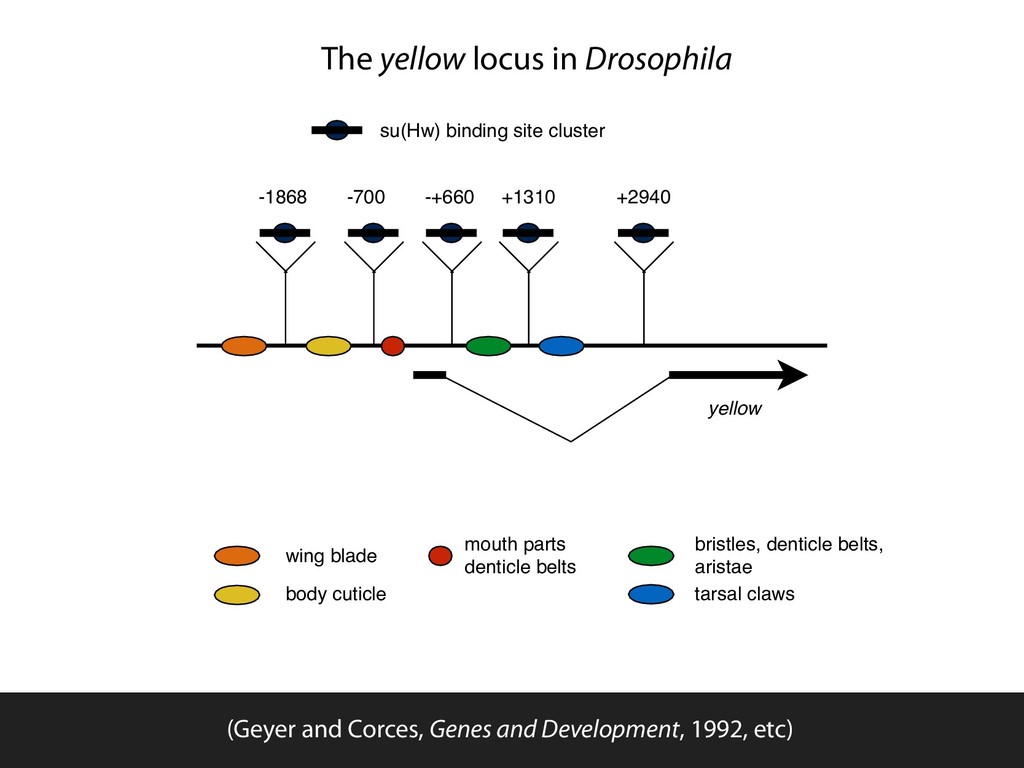
wing blade body cuticle mouth parts denticle belts bristles, denticle belts, aristae tarsal claws The yellow locus in Drosophila (Geyer and Corces, Genes and Development, 1992, etc)
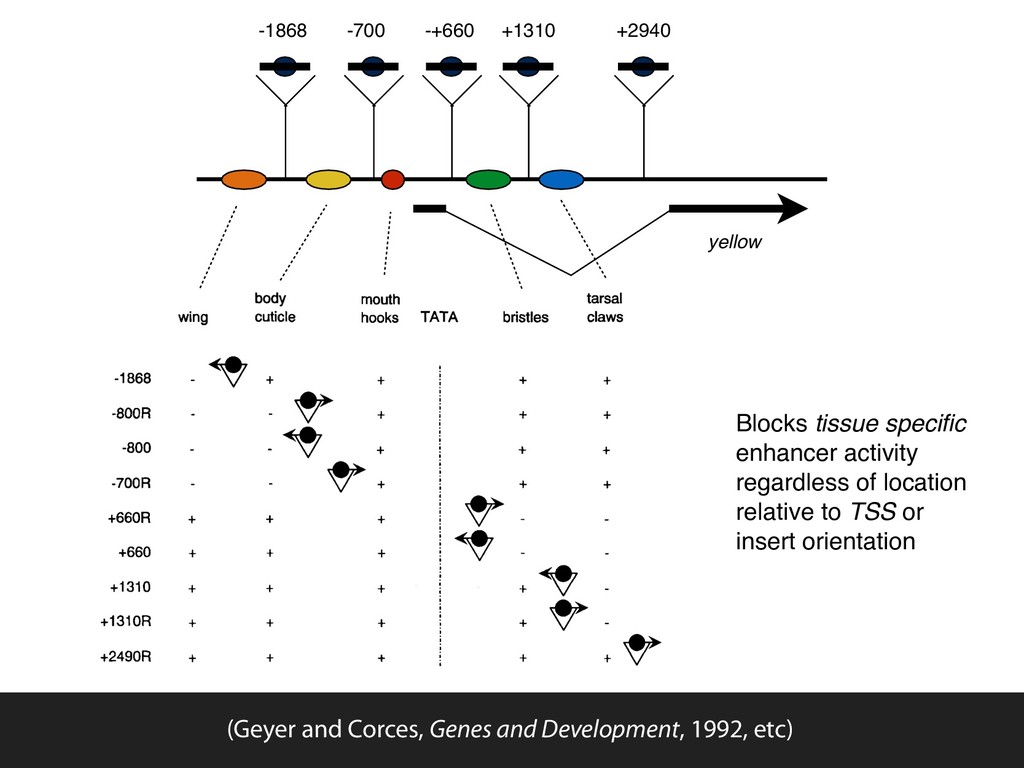
+660R +660 +1310 +1310R +2490R body mouth wing cuticle hooks TATA ~ ' + + t + i " + i + i + + + + + + I ! = + + + i i + + + , t J + + + i bristles tarsal claws Figure 2. Summary of y phenotypes in trans- formed lines. (Top) The relative location with respect to the TATA box of different tissue- specific enhancers responsible for the expres- sion of the y gene in various tissues. Numbers at left indicate the location of the insertion site of the su(Hw)-binding region into the y gene in the various plasmids used for germ- line transformation. Each lane summarizes information on transformed lines obtained with each plasmid. The position of the in- serted sequences relative to various y enhanc- ers is indicated diagrammatically by a triangle that represents the su(Hw)-binding region; the solid circles represent the su(Hw) protein; the arrow indicates the orientation of the in- serted sequences relative to the y gene. The coloration of each tissue is indicated by + (wild type) or - (mutant) signs. required to produce the observed phenotype in these transformants, we analyzed the effect of mutations in The alleles used in this experiment were su(Hw) v, a null allele caused by a deletion of most of the su(Hw) gene, Cold Spring Harbor Laboratory Press on November 1, 2015 - Published by genesdev.cshlp.org Downloaded from yellow -1868 -+660 +1310 +2940 -700 Blocks tissue specific enhancer activity regardless of location relative to TSS or insert orientation (Geyer and Corces, Genes and Development, 1992, etc)
domains. It is conceivable that these domains not only block inappropriate enhancers but also facilitate interaction between distant enhancers and the target promoter. References and Notes 1. A. C. Bell, G. Felsenfeld, Curr. Opin. Genet. Dev. 9, 191 (1999). 2. T. I. Gerasimova, V. G. Corces, Curr. Opin. Genet. Dev. 6, 185 (1996). 3. P. K. Geyer, Curr. Opin. Genet. Dev. 7, 242 (1997). 4. R. Kellum, S. C. Elgin, Curr. Biol. 8, R521 (1998). 5. J. Mihaly et al., Cell. Mol. Life Sci. 54, 60 (1998). 6. A. C. Bell, G. Felsenfeld, Nature 405, 482 (2000). 7. A. T. Hark et al., Nature 405, 486 (2000). 8. J. Zhou, M. Levine, Cell 99, 567 (1999). 9. K. C. Scott, A. D. Taubman, P. K. Geyer, Genetics 153, 787 (1999). 10. K. Hagstrom, M. Muller, P. Schedl, Genes Dev. 10, 3202 (1996). 11. R. R. Roseman, V. Pirrotta, P. K. Geyer, EMBO J. 12, 435 (1993). 12. H. Cai, M. Levine, Nature 376, 533 (1995). 13. , EMBO J. 16, 1732 (1997). 14. J. Kim, B. Shen, C. Rosen, D. Dorsett, Mol. Cell. Biol. 16, 3381 (1996). 15. P. K. Geyer, V. G. Corces, Genes Dev. 6, 1865 (1992). 16. T. I. Gerasimova, D. A. Gdula, D. V. Gerasimov, O. Simonova, V. G. Corces, Cell 82, 587 (1995). 17. S. Small, R. Kraut, T. Hoey, R. Warrior, M. Levine, Genes Dev. 5, 827 (1991). 18. H. N. Cai, D. N. Arnosti, M. Levine, Proc. Natl. Acad. Sci. U.S.A. 93, 9309 (1996). 25. B. Shen, J. Kim, D. Dorsett, Mol. Cell. Biol. 14, 5645 (1994). 26. C. Spana, V. G. Corces, Genes Dev. 4, 1505 (1990). 27. R. Kellum, P. Schedl, Cell 64, 941 (1991). 28. N. Saitoh et al., EMBO J. 19, 2315 (2000). 29. J. Zhou, H. Ashe, C. Burks, M. Levine, Development 126, 3057 (1999). 30. D. Tautz, C. Pfeifle, Chromosoma 98, 81 (1989). 31. We thank V. Corces for female mod(mdg4)u1 stock and M. Levine, V. Pirrotta, and G. Felsenfeld for discussion, communication of unpublished results, and reading of the manuscript. Supported by NIH grant 5RO158458-02 (H.N.C.). 4 October 2000; accepted 15 December 2000 Loss of Insulator Activity by Paired Su(Hw) Chromatin Insulators Ekaterina Muravyova,1 Anton Golovnin,1,2,3 Elena Gracheva,1 Aleksander Parshikov,1 Tatiana Belenkaya,1 Vincenzo Pirrotta,3* Pavel Georgiev1 Chromatin insulators are regulatory elements that block the action of tran- scriptional enhancers when interposed between enhancer and promoter. The Drosophila Suppressor of Hairy wing [Su(Hw)] protein binds the Su(Hw) insu- lator and prevents enhancer-promoter interaction by a mechanism that is not understood. We show that when two copies of the Su(Hw) insulator element, instead of a single one, are inserted between enhancer and promoter, insulator activity is neutralized and the enhancer-promoter interaction may instead be facilitated. This paradoxical phenomenon could be explained by interactions between protein complexes bound at the insulators. The Drosophila gypsy retrotransposon con- tains a chromatin insulator that consists of cluster of 12 binding sites for the Su(Hw) zinc-finger protein (1–6). In the presence of Su(Hw) protein binding, the insulator blocks the activity of an enhancer separated from the promoter by an Su(Hw) binding region. However, this insulator action fails in certain genetic rearrangements that introduce more than one gypsy retrotransposon in the region of the yellow gene (7). The loss of insulator activity might result from intrachromosomal pairing between the two gypsy retrotrans- posons, causing chromatin to fold and allow- ing the enhancer to contact the promoter. Alternatively, interaction between the pro- Fig. 4. Insulator-mediated loop formation. (A) A suHw insulator (S) may interact with other nuclear sites/insulators (I), separating the en- hancer (E) and the promoter (P) into distinct domains and blocking their interaction. (B) In- teractions between two tandem suHw insula- tors fail to sequester the enhancer and may even facilitate enhancer-promoter interaction by “looping out” the intervening DNA. (C) En- hancer blocking may be strengthened by the preferred interactions between two suHw insu- lators flanking the enhancer. www.sciencemag.org SCIENCE VOL 291 19 JANUARY 2001 49 245, R339 (1983). 14. F. K. Stephan, G. Becker, Physiol. Behav. 46, 731 (1989). 15. K.-A. Stokkan, S. Yamazaki, H. Tei, Y. Sakaki, M. Menaker, unpublished data. 16. Serum concentrations of corticosterone were measured with a commercial radioimmunoassay kit (Coat-A- Count, Diagnostic Products, Los Angeles). One rat showed 207.9 and 41.0 ng/ml and another showed 105.8 and 68.9 ng/ml at 3 hours after lights were turned on (“prefeeding”) and 9.5 hours after lights were turned on (“basal”), respectively. The difference between our results and those reported in (13) may be due to the fact that our animals were just weaned and growing rapidly, so that any restrictions in food access may be stressful. Aging markedly reduces the prefeeding corti- costerone secretion in rats exposed to RF [S. Honma et al., Am. J. Physiol. 271, R1514 (1996)]. as intraperitoneal injections for 7 days. Control ani- mals received 0.2 ml of DMSO. 18. On the seventh day of treatment, the serum level of corticosterone, 30 min after injection, was 581 Ϯ 174 (SEM) ng/ml (n ϭ 6) and 39 Ϯ 17 ng/ml (n ϭ 6) in animals receiving corticosterone and DMSO injec- tions, respectively. 19. A. Balsalobre et al., Science 289, 2344 (2000). 20. Both ad lib feeding and food access restricted to the light period are probably highly abnormal for rats in the field. 21. S.-I. Inouye, H. Kawamura, Proc. Natl. Acad. Sci. U.S.A. 76, 5962 (1979). 22. S. Yamazaki, M. C. Kerbeshian, C. G. Hocker, G. D. Block, M. Menaker, J. Neurosci. 18, 10709 (1998). 23. R. Y. Moore, D. C. Klein, Brain Res. 71, 17 (1974). 25. J. D. Plautz, M. Kaneko, J. C. Hall, S. A. Kay, Science 278, 1632 (1997). 26. D. Whitmore, N. S. Foulkes, P. Sassone-Corsi, Nature 404, 87 (2000). 27. F. Damiola et al., Genes Dev. 14, 2950 (2000). 28. We thank M. Quigg for measuring corticosterone concentrations and K. M. Greene and S. C. Miller for technical assistance. This work was supported in part by the NSF Center for Biological Timing, NIH grant MH 56647 (to M.M.); by travel grant 130173/410 from the Norwegian Research Council (to K.-A.S.); and by a research grant from the Japanese Ministry of Education, Science, Sports and Culture and the Japa- nese Ministry of Health and Welfare (to H.T.). 26 September 2000; accepted 13 December 2000 Effects of cis Arrangement of Chromatin Insulators on Enhancer-Blocking Activity Haini N. Cai* and Ping Shen Chromatin boundary elements or insulators are believed to regulate gene activity in complex genetic loci by organizing specialized chromatin structures. Here, we report that the enhancer-blocking activity of the Drosophila suHw insulator is sensitive to insulator copy number and position. Two tandem copies of suHw were ineffective in blocking various enhancers from a downstream promoter. Moreover, an enhancer was blocked more effectively from a pro- moter by two flanking suHw insulators than by a single intervening one. Thus, insulators may modulate enhancer-promoter interactions by interacting with each other and facilitating the formation of chromatin loop domains. Insulators regulate gene activity in diverse or- ganisms (1–8). The defining feature of insula- tors as a class of regulatory elements is their ability to block enhancer-promoter interactions when positioned interveningly. One of the best characterized insulators is suHw, a 340–base pair (bp) element from the Drosophila gypsy retrotransposon. It protects transgenes from chromosomal position effects and blocks vari- ous enhancer-promoter interactions (9–13). SUHW, a zinc-finger DNA binding protein, and MOD(MDG4), a BTB domain protein, are essential for suHw function (13–16). Using divergently transcribed reporter genes in trans- genic Drosophila embryos, we have shown that skipped stripe 2 enhancer, directs reporter ex- pression in a composite pattern of broad dorsal activation and dominant ventral repression of the E2 stripe (Fig. 1, A and D) (13, 17, 18). A single 340-bp suHw insulator element in the VS2 transgene partially blocked the upstream VRE enhancer (Fig. 1, B and D). Two tandem suHw elements (arranged as direct repeats) were inserted between VRE and E2, resulting in VSS2. Instead of enhanced blockage, VSS2 em- bryos exhibited a loss of suHw insulator activ- ity (Fig. 1, C and D). This was observed in most VSS2 embryos (Fig. 1D) and in all 10 indepen- dent VSS2 lines, indicating that it is unlikely to be caused by chromosomal position effects. (Fig. 2, B and H), whereas two tandem suHw elements (NSSH) did not block the NEE en- hancer (Fig. 2, C and H). A second group of transgenes uses a twist mesoderm enhancer (PE) and an evenskipped stripe 3 enhancer (E3) (13). Both enhancers are active when separated by the L spacer (PL3) (Fig. 2, D and H). Insertion of a suHw element in the PS3 trans- gene blocked the upstream PE enhancer (Fig. 2, E and H), whereas two tandem suHw elements (PSS3) did not block the PE enhancer (Fig. 2, F and H). Replacing one of the two suHw ele- ments in PSS3 with a spacer of comparable size (A) restored the enhancer-blocking activity of the remaining suHw in PSA3 embryos (Fig. 2G), indicating that loss of insulator activity with two suHw elements is not due to the spacing change but to the presence of the addi- tional insulator. Genomic PCR with individual NSH, NSSH, PS3, and PSS3 lines indicated that the transgenes were structurally intact (Fig. 2I). These results suggest that the loss of insulator activity with tandemly arranged suHw is inde- pendent of the enhancer tested. The enhancer-blocking activity of suHw may require its interaction with other sites (or insulators) within the nucleus. A second suHw nearby may compete dominantly for the existing suHw and affect the neighboring en- hancer-promoter interactions, depending on the cis arrangement of these elements. To test this hypothesis, we constructed the SVS2 transgene in which the VRE enhancer is flanked by two suHw elements. In contrast to the loss of insu- on October 24, 2016 http://science.sciencemag.org/ Downloaded from of suHw were ineffective in blocking various enhancers from a downstream promoter. Moreover, an enhancer was blocked more effectively from a pro- moter by two flanking suHw insulators than by a single intervening one. Thus, insulators may modulate enhancer-promoter interactions by interacting with each other and facilitating the formation of chromatin loop domains. Insulators regulate gene activity in diverse or- ganisms (1–8). The defining feature of insula- tors as a class of regulatory elements is their ability to block enhancer-promoter interactions when positioned interveningly. One of the best characterized insulators is suHw, a 340–base pair (bp) element from the Drosophila gypsy retrotransposon. It protects transgenes from chromosomal position effects and blocks vari- ous enhancer-promoter interactions (9–13). SUHW, a zinc-finger DNA binding protein, and MOD(MDG4), a BTB domain protein, are essential for suHw function (13–16). Using divergently transcribed reporter genes in trans- genic Drosophila embryos, we have shown that an enhancer blocked from the downstream pro- moter by suHw is fully competent to activate an upstream promoter (12). To probe the insulator mechanism, we test- ed the effect of suHw copy number on its insulator strength in Drosophila embryos. The zerknullt enhancer VRE (ventral repression el- ement) has been shown to be partially blocked by suHw (12). In blastoderm embryos, the V2 transgene containing VRE and E2, an even- skipped stripe 2 enhancer, directs reporter ex- pression in a composite pattern of broad dorsal activation and dominant ventral repression of the E2 stripe (Fig. 1, A and D) (13, 17, 18). A single 340-bp suHw insulator element in the VS2 transgene partially blocked the upstream VRE enhancer (Fig. 1, B and D). Two tandem suHw elements (arranged as direct repeats) were inserted between VRE and E2, resulting in VSS2. Instead of enhanced blockage, VSS2 em- bryos exhibited a loss of suHw insulator activ- ity (Fig. 1, C and D). This was observed in most VSS2 embryos (Fig. 1D) and in all 10 indepen- dent VSS2 lines, indicating that it is unlikely to be caused by chromosomal position effects. Genomic polymerase chain reaction (PCR) analysis of independent VS2 and VSS2 lines further verified the structural integrity of the transgenes in vivo (Fig. 1E) (19). To determine whether the loss of insulator function in VSS2 embryos is enhancer-specific, we constructed transgenes using a rhomboid neuroectodermal enhancer (NEE) and a hairy stripe 1 enhancer (H1) (13). The NLH embryos containing NEE and H1 enhancers separated by a 1.4-kb neutral spacer (L) exhibited a compos- ite lacZ pattern directed by both enhancers (Fig. 2, A and H). A single suHw element in the NSH transgene blocked the upstream NEE enhancer (A) restored the enhancer-blocking activity of the remaining suHw in PSA3 embryos (Fig. 2G), indicating that loss of insulator activity with two suHw elements is not due to the spacing change but to the presence of the addi- tional insulator. Genomic PCR with individual NSH, NSSH, PS3, and PSS3 lines indicated that the transgenes were structurally intact (Fig. 2I). These results suggest that the loss of insulator activity with tandemly arranged suHw is inde- pendent of the enhancer tested. The enhancer-blocking activity of suHw may require its interaction with other sites (or insulators) within the nucleus. A second suHw nearby may compete dominantly for the existing suHw and affect the neighboring en- hancer-promoter interactions, depending on the cis arrangement of these elements. To test this hypothesis, we constructed the SVS2 transgene in which the VRE enhancer is flanked by two suHw elements. In contrast to the loss of insu- lator function seen in VSS2 embryos, the VRE enhancer is more effectively blocked in SVS2 embryos than in VS2 embryos (Fig. 3, A, B, and D). Thus, it is the tandem arrangement rather than physical proximity that causes the loss of insulator activity. VRE-mediated dorsal activa- tion of the divergently transcribed miniwhite is also diminished in SVS2 embryos (19), indicat- ing that VRE is blocked from promoters on either side. suHw-mediated blockage of VRE is significantly reduced in SVS2/mod(mdg4)u1 embryos (Fig. 3C), indicating that a MOD- (MDG4)-mediated complex is required for the enhanced insulator activity (13, 16, 20). VSS2, Department of Cellular Biology, University of Georgia, Athens, GA 30602, USA. *To whom correspondence should be addressed. www.sciencemag.org SCIENCE VOL 291 19 JANUARY 2001 493
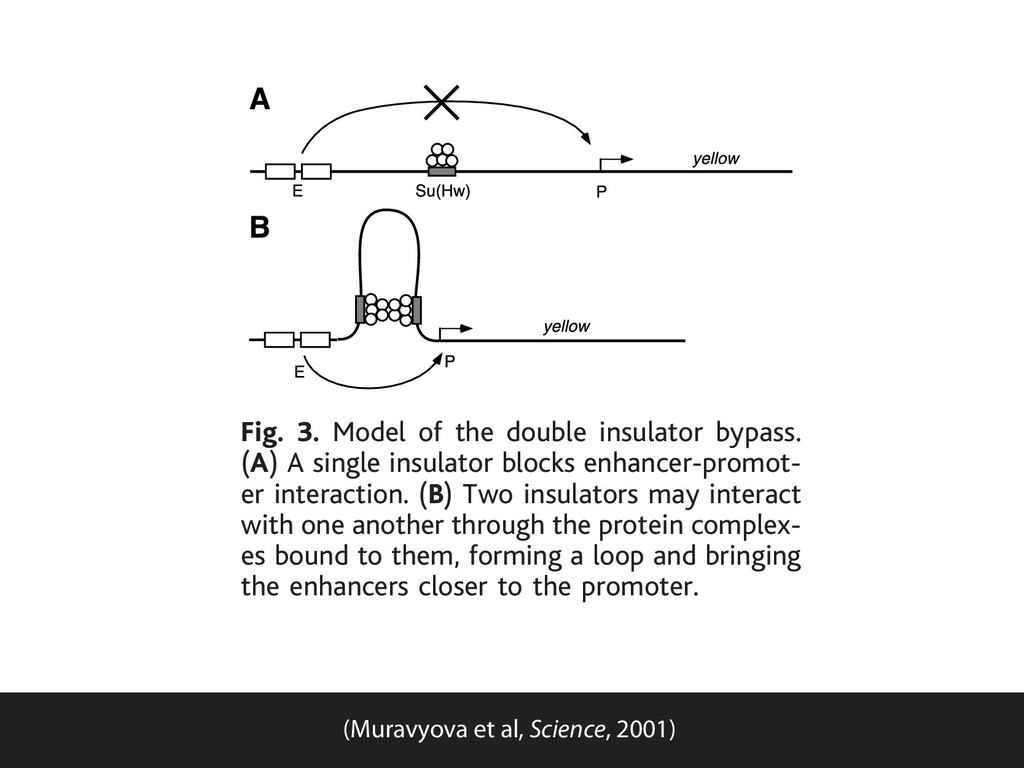
lines, the absence of Su(Hw) protein reduced white expression, implying blocked. Howe flanked by two ed at position transcription s the yellow gen and wings. In expression dec not change in activation of t yellow enhanc posed insulato yellow, the ins tors between promoters may stead of block lator between removed, yield expression in pressed, showi enhancers in the majority of the lines. Fig. 3. Model of the double insulator bypass. (A) A single insulator blocks enhancer-promot- er interaction. (B) Two insulators may interact with one another through the protein complex- es bound to them, forming a loop and bringing the enhancers closer to the promoter. (Muravyova et al, Science, 2001)
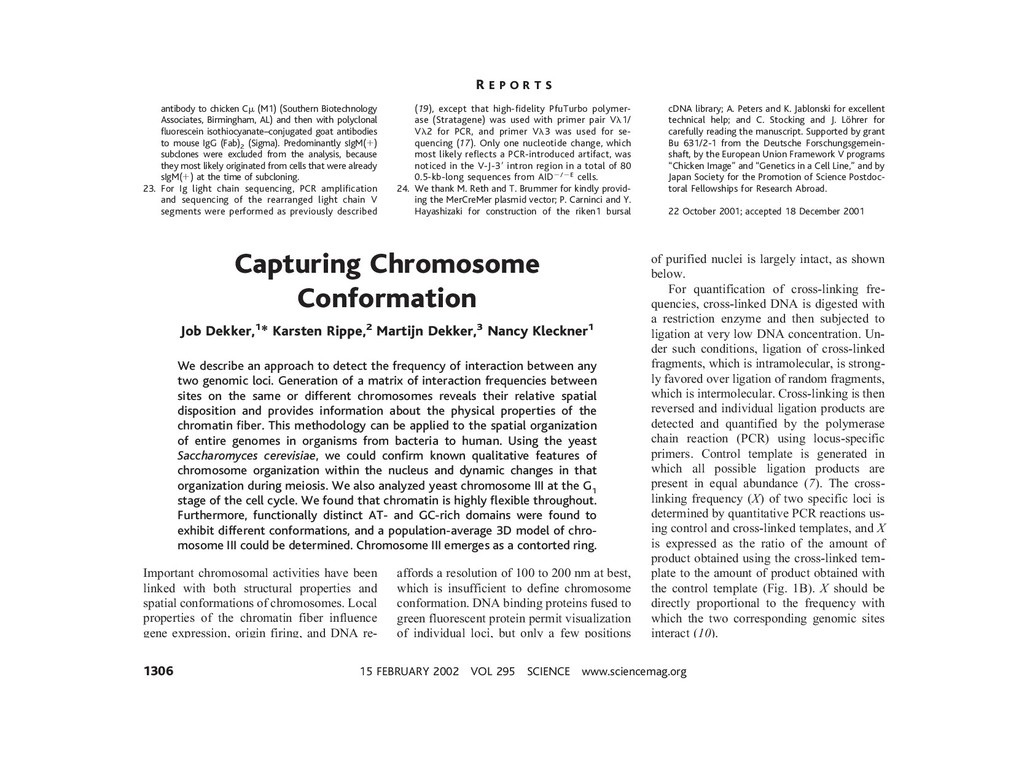
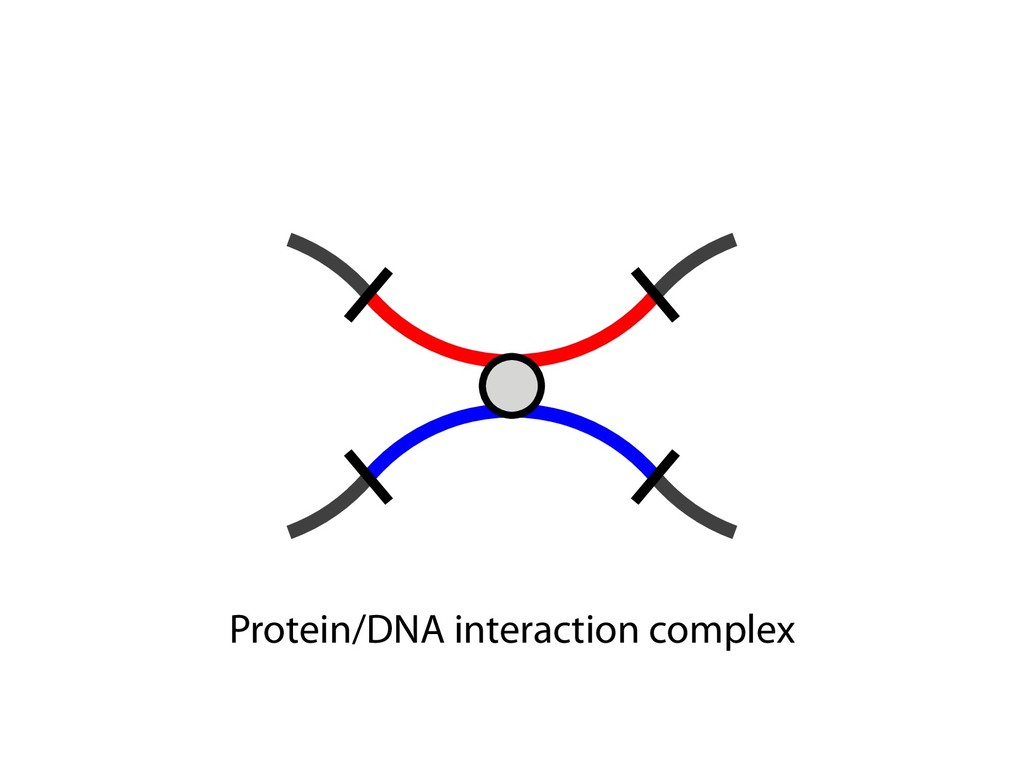
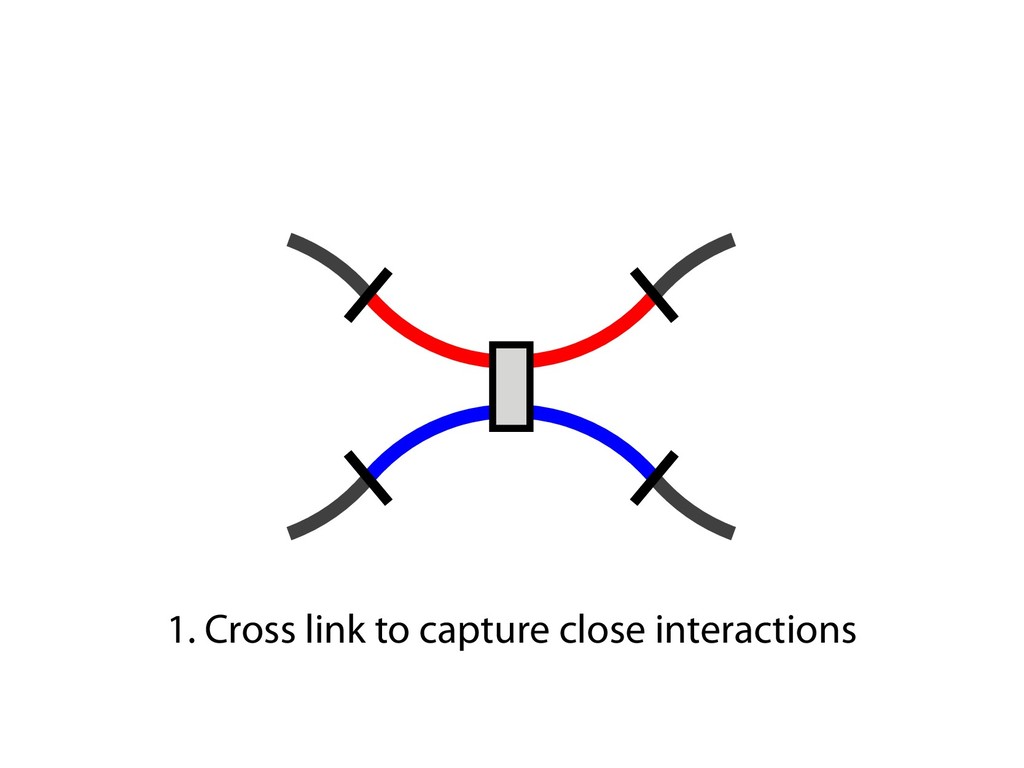
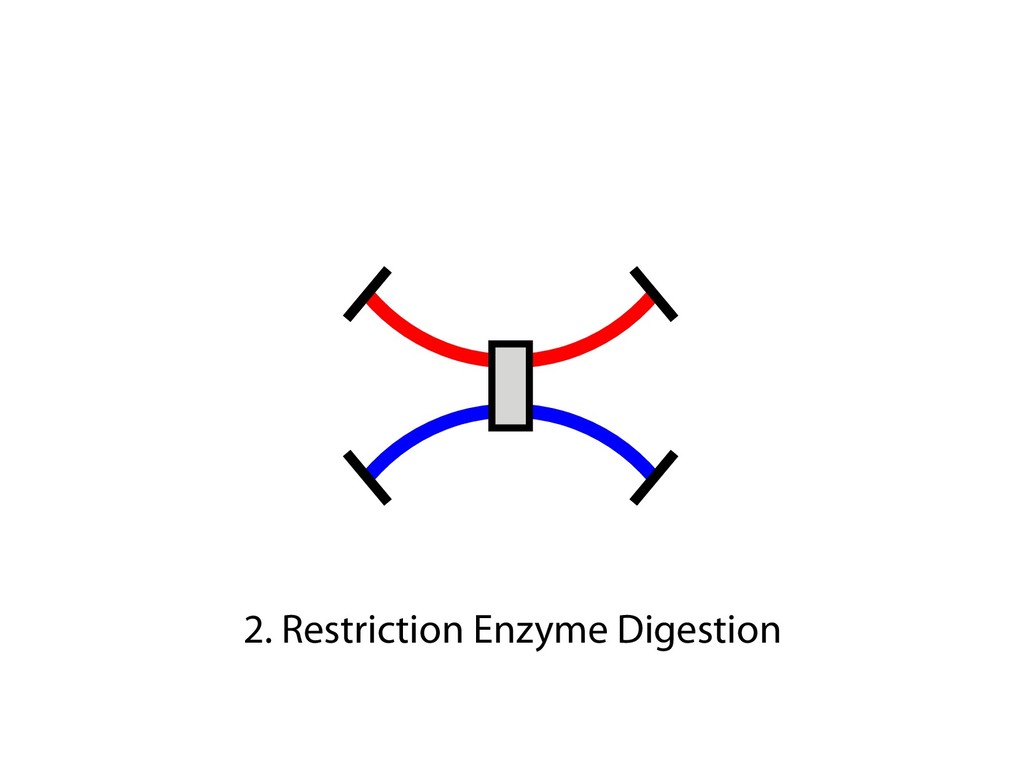
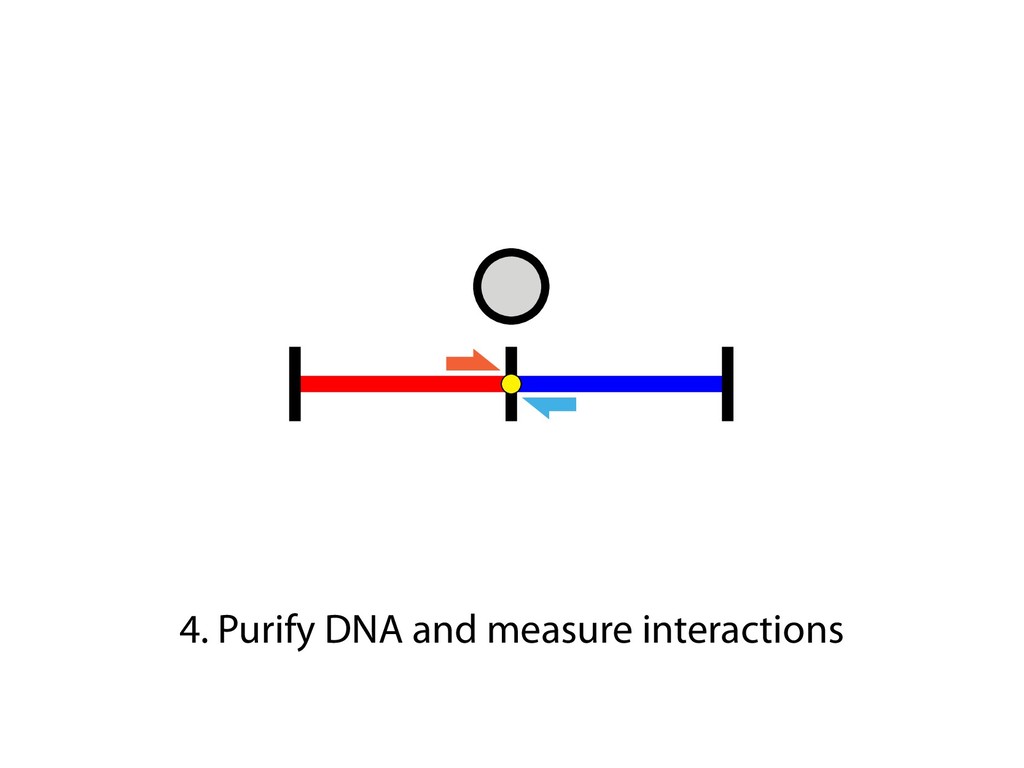
and then with polyclonal fluorescein isothiocyanate–conjugated goat antibodies to mouse IgG (Fab) 2 (Sigma). Predominantly sIgM(ϩ) subclones were excluded from the analysis, because they most likely originated from cells that were already sIgM(ϩ) at the time of subcloning. 23. For Ig light chain sequencing, PCR amplification and sequencing of the rearranged light chain V segments were performed as previously described (19), except that high-fidelity PfuTurbo polymer- ase (Stratagene) was used with primer pair V1/ V2 for PCR, and primer V3 was used for se- quencing (17). Only one nucleotide change, which most likely reflects a PCR-introduced artifact, was noticed in the V-J-3Ј intron region in a total of 80 0.5-kb-long sequences from AIDϪ/ϪE cells. 24. We thank M. Reth and T. Brummer for kindly provid- ing the MerCreMer plasmid vector; P. Carninci and Y. Hayashizaki for construction of the riken1 bursal cDNA library; A. Peters and K. Jablonski for excellent technical help; and C. Stocking and J. Lo ¨hrer for carefully reading the manuscript. Supported by grant Bu 631/2-1 from the Deutsche Forschungsgemein- shaft, by the European Union Framework V programs “Chicken Image” and “Genetics in a Cell Line,” and by Japan Society for the Promotion of Science Postdoc- toral Fellowships for Research Abroad. 22 October 2001; accepted 18 December 2001 Capturing Chromosome Conformation Job Dekker,1* Karsten Rippe,2 Martijn Dekker,3 Nancy Kleckner1 We describe an approach to detect the frequency of interaction between any two genomic loci. Generation of a matrix of interaction frequencies between sites on the same or different chromosomes reveals their relative spatial disposition and provides information about the physical properties of the chromatin fiber. This methodology can be applied to the spatial organization of entire genomes in organisms from bacteria to human. Using the yeast Saccharomyces cerevisiae, we could confirm known qualitative features of chromosome organization within the nucleus and dynamic changes in that organization during meiosis. We also analyzed yeast chromosome III at the G 1 stage of the cell cycle. We found that chromatin is highly flexible throughout. Furthermore, functionally distinct AT- and GC-rich domains were found to exhibit different conformations, and a population-average 3D model of chro- mosome III could be determined. Chromosome III emerges as a contorted ring. Important chromosomal activities have been linked with both structural properties and spatial conformations of chromosomes. Local properties of the chromatin fiber influence gene expression, origin firing, and DNA re- pair [e.g., (1, 2)]. Higher order structural features—such as formation of the 30-nm fiber, chromatin loops and axes, and inter- chromosomal connections—are important for chromosome morphogenesis and also have roles in gene expression and recombination. Activities such as transcription and timing of replication have been related to overall spa- affords a resolution of 100 to 200 nm at best, which is insufficient to define chromosome conformation. DNA binding proteins fused to green fluorescent protein permit visualization of individual loci, but only a few positions can be examined simultaneously. Multiple loci can be visualized with fluorescence in situ hybridization (FISH), but this requires severe treatment that may affect chromosome organization. We developed a high-throughput method- ology, Chromosome Conformation Capture (3C), which can be used to analyze the over- of purified nuclei is largely intact, as shown below. For quantification of cross-linking fre- quencies, cross-linked DNA is digested with a restriction enzyme and then subjected to ligation at very low DNA concentration. Un- der such conditions, ligation of cross-linked fragments, which is intramolecular, is strong- ly favored over ligation of random fragments, which is intermolecular. Cross-linking is then reversed and individual ligation products are detected and quantified by the polymerase chain reaction (PCR) using locus-specific primers. Control template is generated in which all possible ligation products are present in equal abundance (7). The cross- linking frequency (X) of two specific loci is determined by quantitative PCR reactions us- ing control and cross-linked templates, and X is expressed as the ratio of the amount of product obtained using the cross-linked tem- plate to the amount of product obtained with the control template (Fig. 1B). X should be directly proportional to the frequency with which the two corresponding genomic sites interact (10). Control experiments show that formation of ligation products is strictly dependent on both ligation and cross-linking (Fig. 1C). In general, X decreases with increasing separa- tion distance in kb along chromosome III (“genomic site separation”). Cross-linking frequencies for both the left telomere and the centromere of chromosome III with each of R E P O R T S on April 19, 2012 www.sciencemag.org Downloaded from sites on the same or different chromosomes reveals their relative spatial disposition and provides information about the physical properties of the chromatin fiber. This methodology can be applied to the spatial organization of entire genomes in organisms from bacteria to human. Using the yeast Saccharomyces cerevisiae, we could confirm known qualitative features of chromosome organization within the nucleus and dynamic changes in that organization during meiosis. We also analyzed yeast chromosome III at the G 1 stage of the cell cycle. We found that chromatin is highly flexible throughout. Furthermore, functionally distinct AT- and GC-rich domains were found to exhibit different conformations, and a population-average 3D model of chro- mosome III could be determined. Chromosome III emerges as a contorted ring. Important chromosomal activities have been linked with both structural properties and spatial conformations of chromosomes. Local properties of the chromatin fiber influence gene expression, origin firing, and DNA re- pair [e.g., (1, 2)]. Higher order structural features—such as formation of the 30-nm fiber, chromatin loops and axes, and inter- chromosomal connections—are important for chromosome morphogenesis and also have roles in gene expression and recombination. Activities such as transcription and timing of replication have been related to overall spa- tial nuclear disposition of different regions and their relationships to the nuclear enve- lope [e.g., (3–6)]. At each of these levels, chromosome organization is highly dynamic, varying both during the cell cycle and among different cell types. Analysis of chromosome conformation is complicated by technical limitations. Elec- tron microscopy, while affording high reso- lution, is laborious and not easily applicable to studies of specific loci. Light microscopy affords a resolution of 100 to 200 nm at best, which is insufficient to define chromosome conformation. DNA binding proteins fused to green fluorescent protein permit visualization of individual loci, but only a few positions can be examined simultaneously. Multiple loci can be visualized with fluorescence in situ hybridization (FISH), but this requires severe treatment that may affect chromosome organization. We developed a high-throughput method- ology, Chromosome Conformation Capture (3C), which can be used to analyze the over- all spatial organization of chromosomes and to investigate their physical properties at high resolution. The principle of our approach is outlined in Fig. 1A (7). Intact nuclei are isolated (8) and subjected to formaldehyde fixation, which cross-links proteins to other proteins and to DNA. The overall result is cross-linking of physically touching seg- ments throughout the genome via contacts between their DNA-bound proteins. The rel- ative frequencies with which different sites have become cross-linked are then deter- mined. Analysis of genome-wide interaction frequencies provides information about gen- eral nuclear organization as well as physical properties and conformations of chromo- somes. We have used intact yeast nuclei for all experiments. Although the method can be performed using intact cells, the signals are considerably lower, making quantification difficult (9). The general nuclear organization which is intermolecular. Cross-linking is then reversed and individual ligation products are detected and quantified by the polymerase chain reaction (PCR) using locus-specific primers. Control template is generated in which all possible ligation products are present in equal abundance (7). The cross- linking frequency (X) of two specific loci is determined by quantitative PCR reactions us- ing control and cross-linked templates, and X is expressed as the ratio of the amount of product obtained using the cross-linked tem- plate to the amount of product obtained with the control template (Fig. 1B). X should be directly proportional to the frequency with which the two corresponding genomic sites interact (10). Control experiments show that formation of ligation products is strictly dependent on both ligation and cross-linking (Fig. 1C). In general, X decreases with increasing separa- tion distance in kb along chromosome III (“genomic site separation”). Cross-linking frequencies for both the left telomere and the centromere of chromosome III with each of 12 other positions along that same chromo- some (Fig. 1, C and D) were determined using nuclei isolated from exponentially growing haploid cells. Interestingly, the two telomeres of chromosome III interact more frequently than predicted from their genomic site separation, which suggests that the chro- mosome ends are in close spatial proximity. This is expected because yeast telomeres are known to occur in clusters (11, 12). We next applied our method to an analysis of centromeres and of homologous chromo- somes (“homologs”) during meiosis in yeast (7). In mitotic and premeiotic cells, centro- meres are clustered near the spindle pole body (13, 14) and homologous chromosomes are loosely associated (15–17). These fea- tures change markedly when cells enter mei- osis (13). The centromere cluster is rapidly lost and is not restored until just before the first meiotic division. Loose interactions be- 1Department of Molecular and Cellular Biology, Har- vard University, Cambridge, MA 02138, USA. 2Mole- kulare Genetik (H0700), Deutsches Krebsforschungs- zentrum, Im Neuenheimer Feld 280, and Kirchhoff- Institut fu ¨r Physik, Physik Molekularbiologischer Pro- zesse, Universita ¨t Heidelberg, Schro ¨derstrasse 90, D-69120 Heidelberg, Germany. 32e Oosterparklaan 272, 3544 AX Utrecht, Netherlands. *To whom correspondence should be addressed. E- mail: [email protected] 15 FEBRUARY 2002 VOL 295 SCIENCE www.sciencemag.org 1306 on April 19, 201 www.sciencemag.org Downloaded from
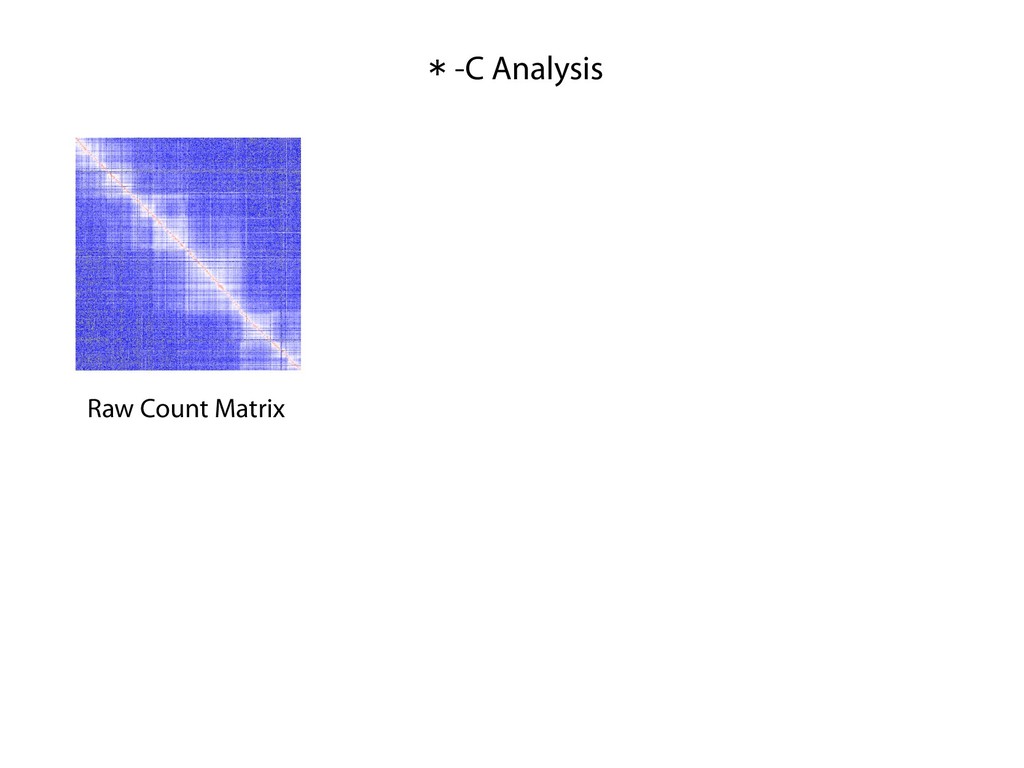
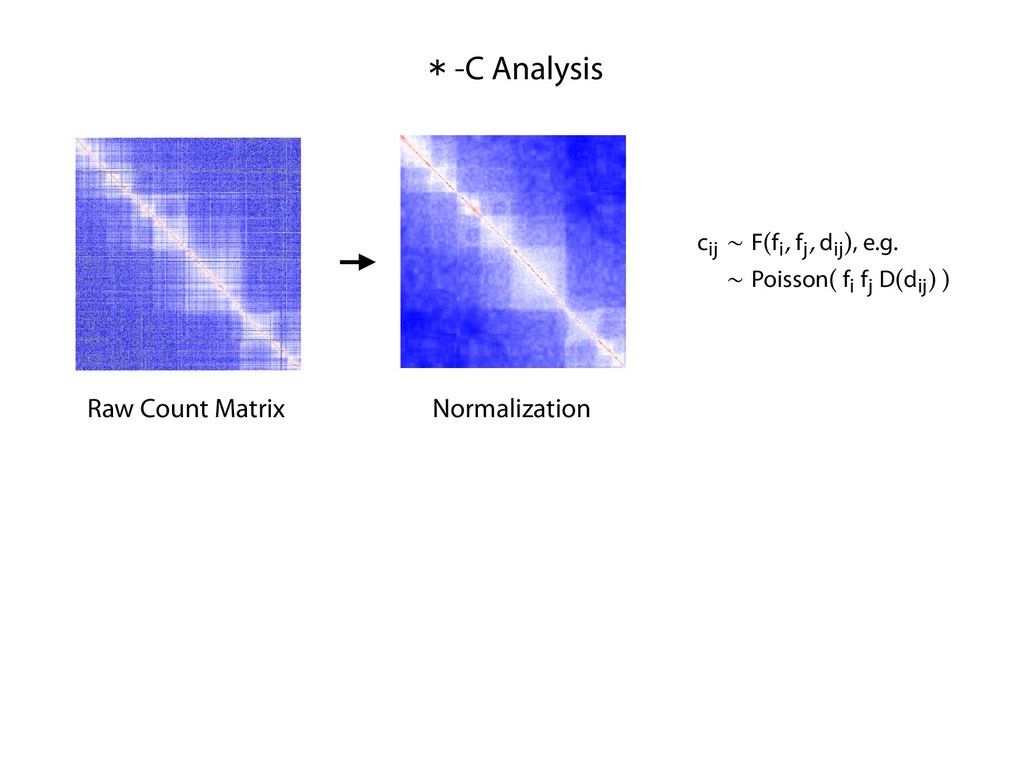
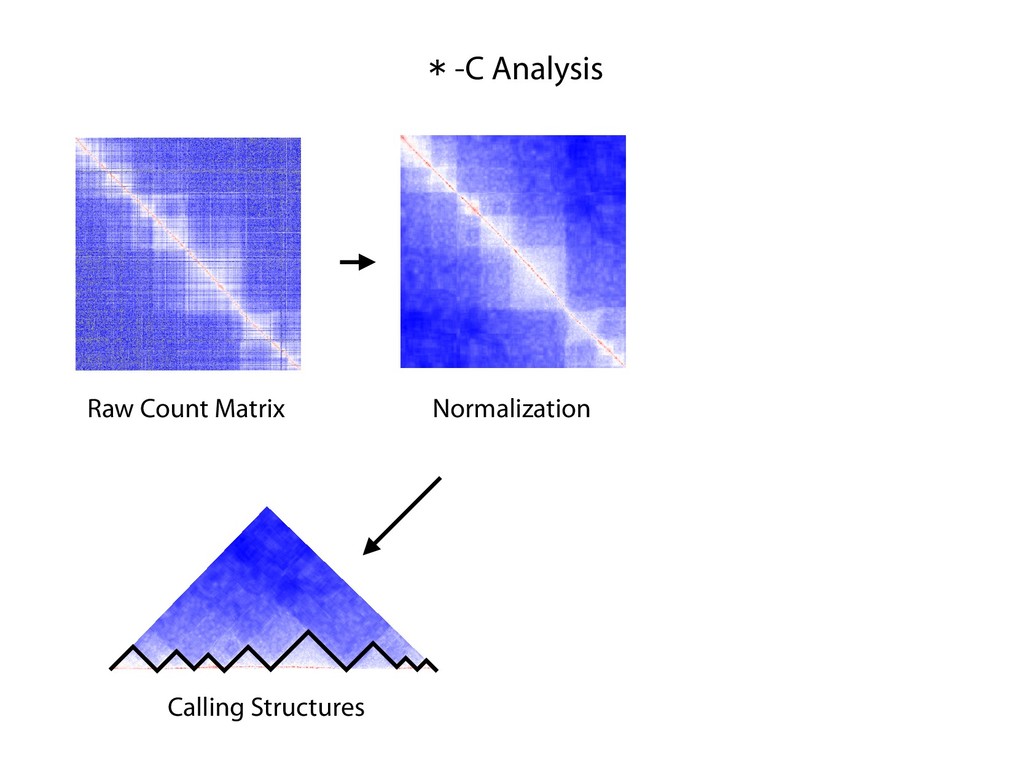
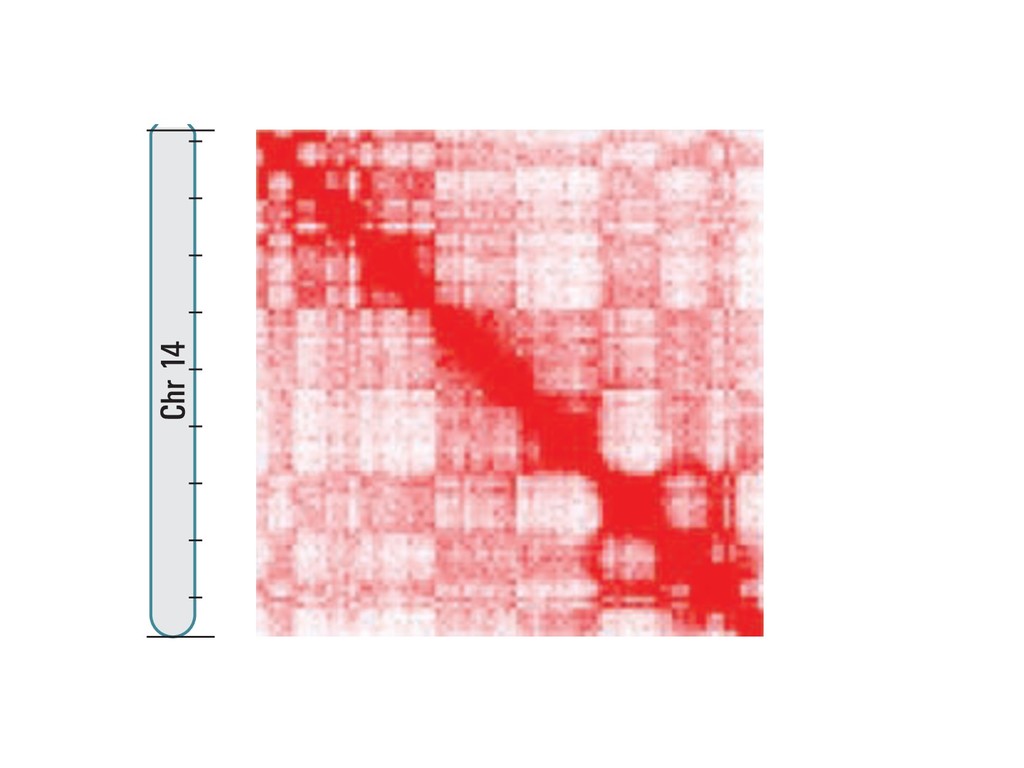
fill and Ligate 4. Pull down Junctions 4. Sequence Hi-C for measuring chromatin interactions some were consistent across chromosomes: th A B E F Count matrix, for pairs of restriction fragments or larger bins (Lieberman-Aiden et al. 2009)
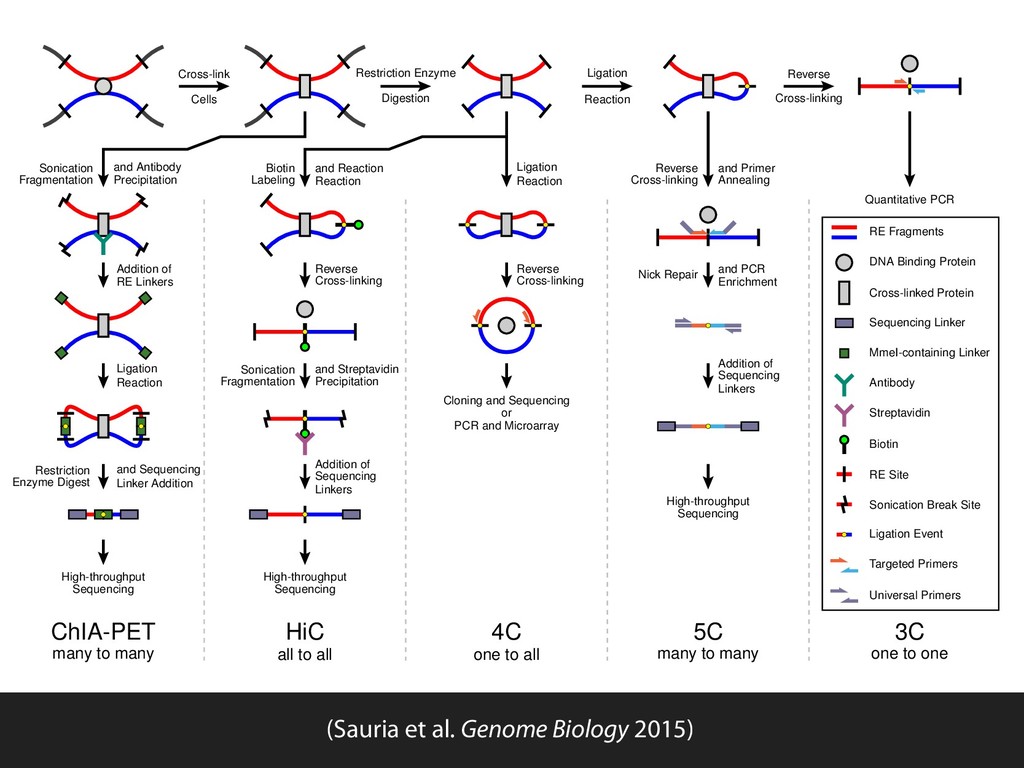
Ligation Reaction Reverse Cross-linking Quantitative PCR Ligation Reaction Reverse Cross-linking Cloning and Sequencing or PCR and Microarray Biotin Labeling and Reaction Reaction Reverse Cross-linking Sonication Fragmentation and Streptavidin Precipitation Addition of Sequencing Linkers High-throughput Sequencing Sonication Fragmentation and Antibody Precipitation Addition of RE Linkers Ligation Reaction Restriction Enzyme Digest and Sequencing Linker Addition High-throughput Sequencing Reverse Cross-linking and Primer Annealing Nick Repair and PCR Enrichment Addition of Sequencing Linkers High-throughput Sequencing ChIA-PET many to many HiC all to all 4C one to all 5C many to many 3C one to one RE Fragments DNA Binding Protein Cross-linked Protein Sequencing Linker MmeI-containing Linker Antibody Streptavidin Biotin RE Site Sonication Break Site Ligation Event Targeted Primers Universal Primers (Sauria et al. Genome Biology 2015)