Combine the power of computational analysis with human intelligence through interactive data visualisation to tackle the most difficult data challenges.
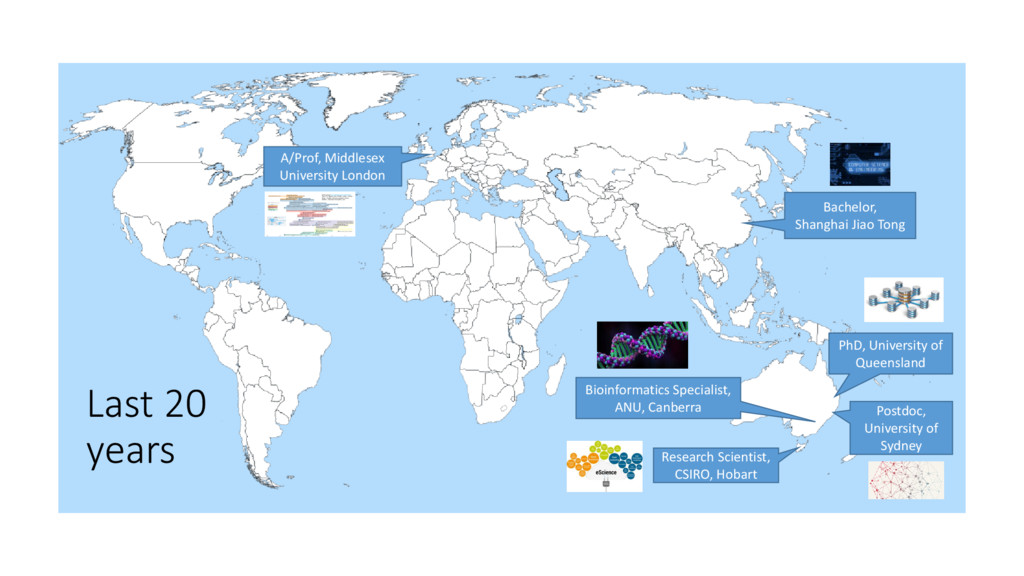
Queensland Postdoc, University of Sydney Research Scientist, CSIRO, Hobart Bioinformatics Specialist, ANU, Canberra A/Prof, Middlesex University London
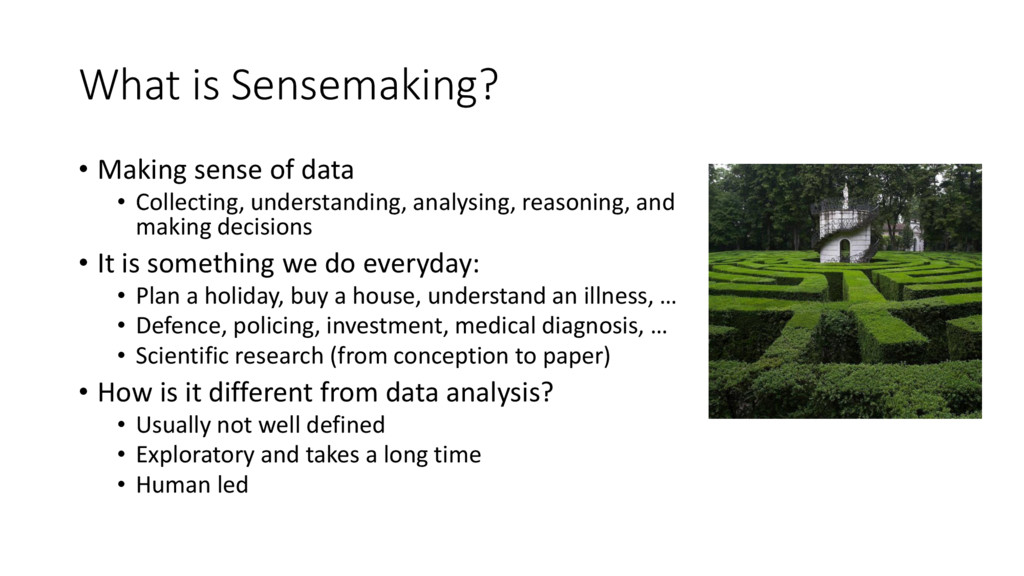
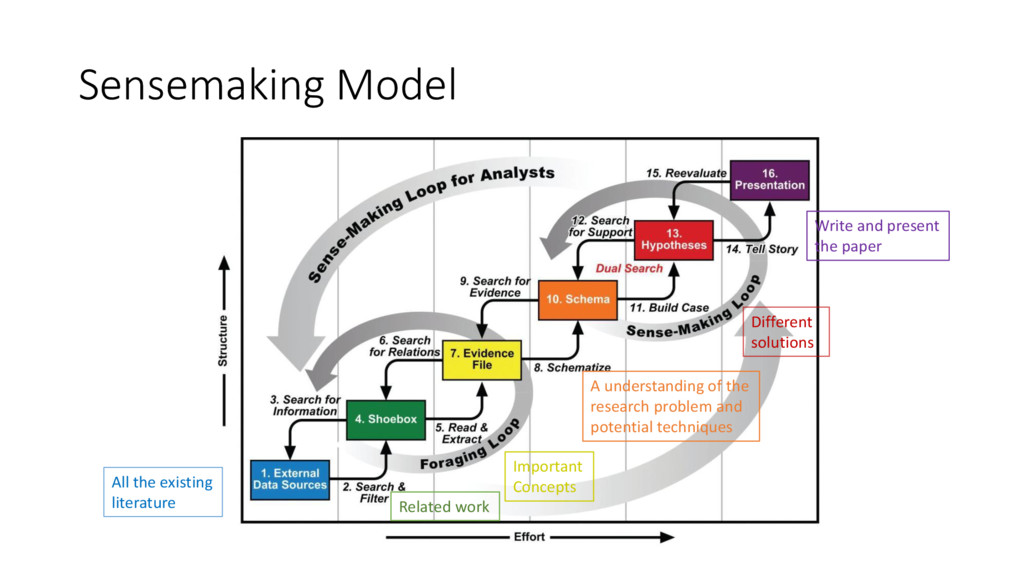
understanding, analysing, reasoning, and making decisions • It is something we do everyday: • Plan a holiday, buy a house, understand an illness, … • Defence, policing, investment, medical diagnosis, … • Scientific research (from conception to paper) • How is it different from data analysis? • Usually not well defined • Exploratory and takes a long time • Human led
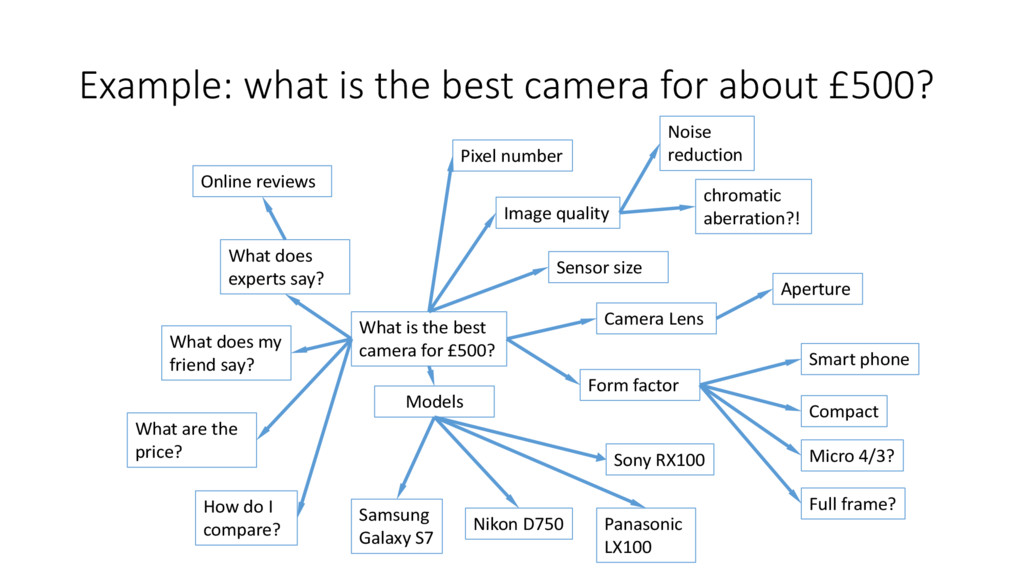
is the best camera for £500? Pixel number Sensor size Image quality chromatic aberration?! Noise reduction What does experts say? Online reviews What does my friend say? Smart phone Compact Full frame? Micro 4/3? Sony RX100 Nikon D750 Samsung Galaxy S7 What are the price? How do I compare? Panasonic LX100 Form factor Models Camera Lens Aperture
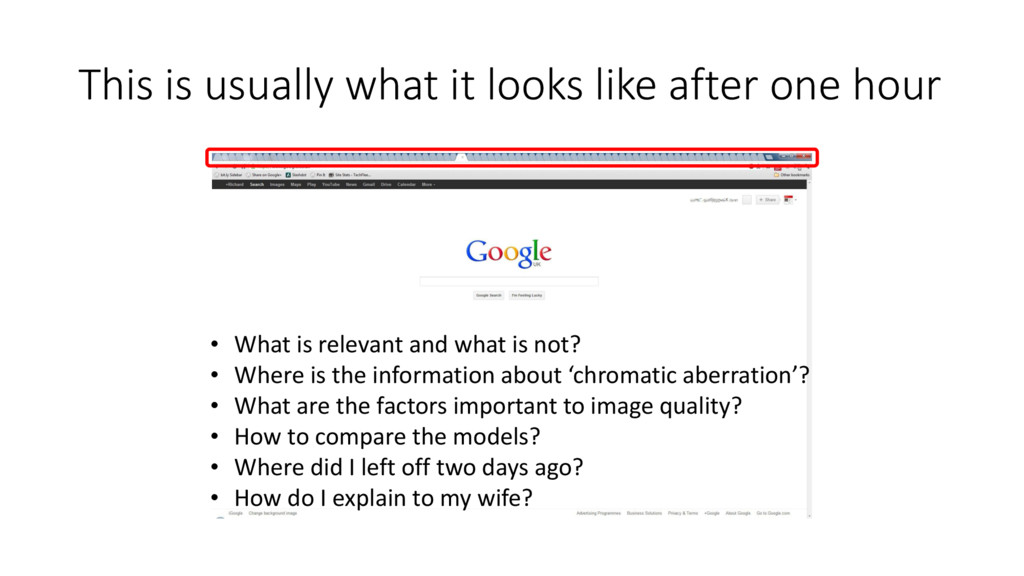
• What is relevant and what is not? • Where is the information about ‘chromatic aberration’? • What are the factors important to image quality? • How to compare the models? • Where did I left off two days ago? • How do I explain to my wife?
is very complex and difficult, but • The goal and rules are very well defined, and the results are easily measurable • However, the £500 camera task is ill defined and not easily measurable • How many people have the knowledge and resource to build a deep neural network, collect all the training data, and then train and tune it, just to find a camera?
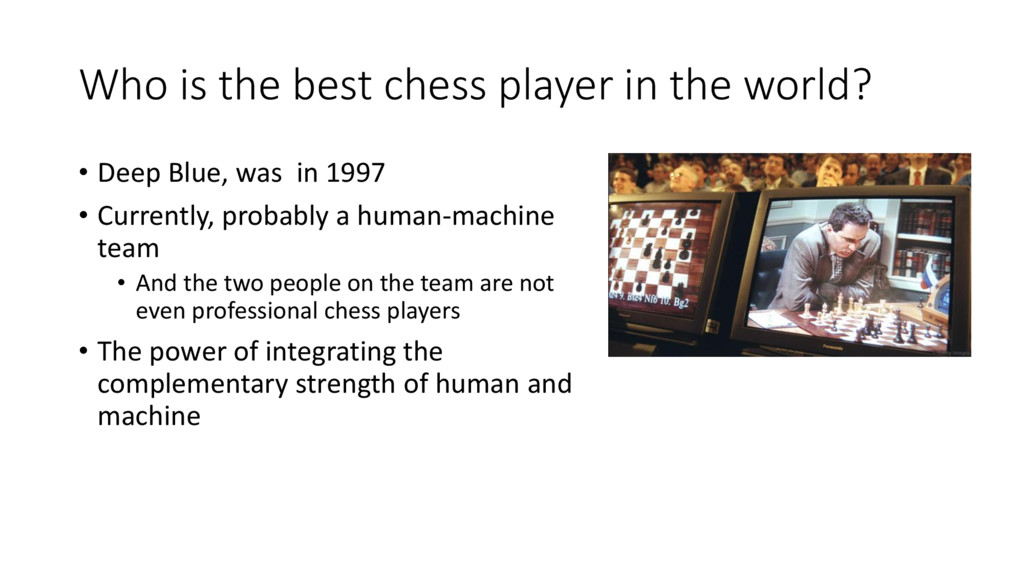
Deep Blue, was in 1997 • Currently, probably a human-machine team • And the two people on the team are not even professional chess players • The power of integrating the complementary strength of human and machine
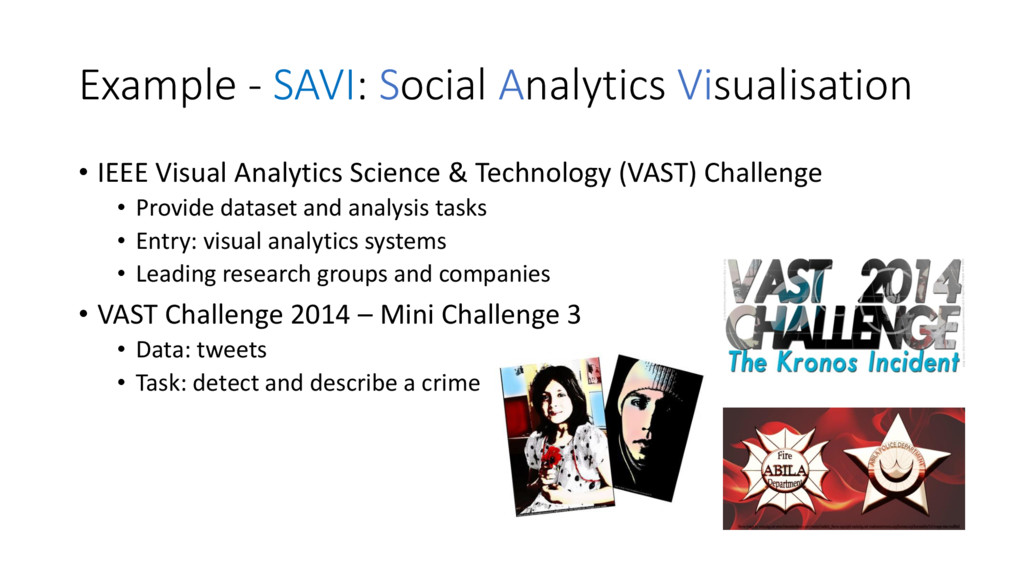
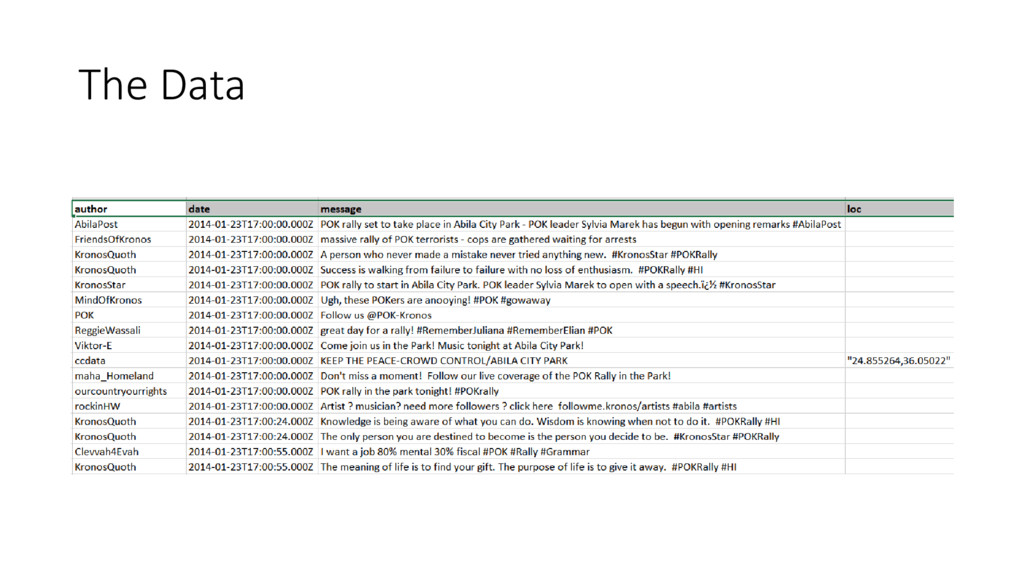
Science & Technology (VAST) Challenge • Provide dataset and analysis tasks • Entry: visual analytics systems • Leading research groups and companies • VAST Challenge 2014 – Mini Challenge 3 • Data: tweets • Task: detect and describe a crime
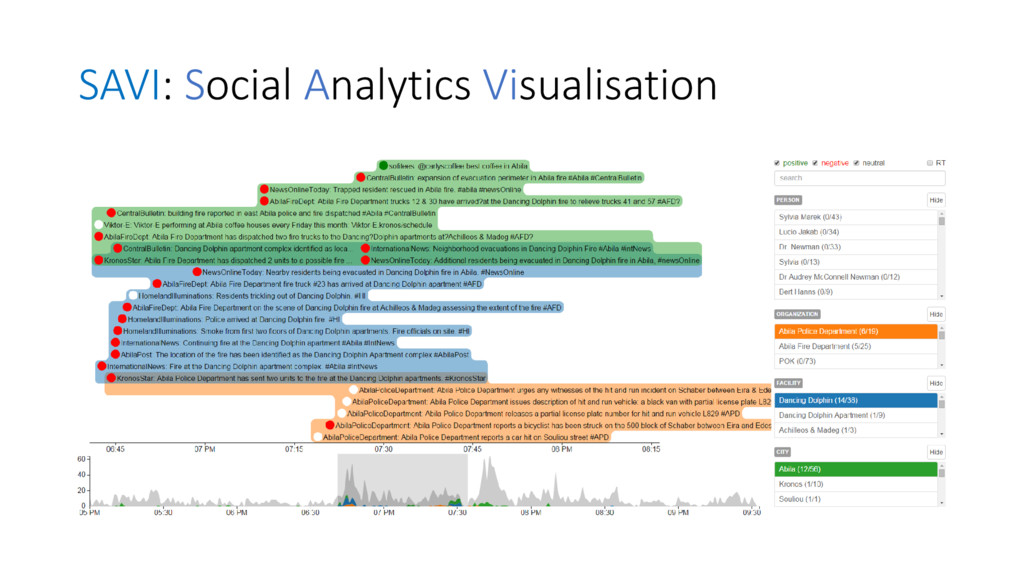
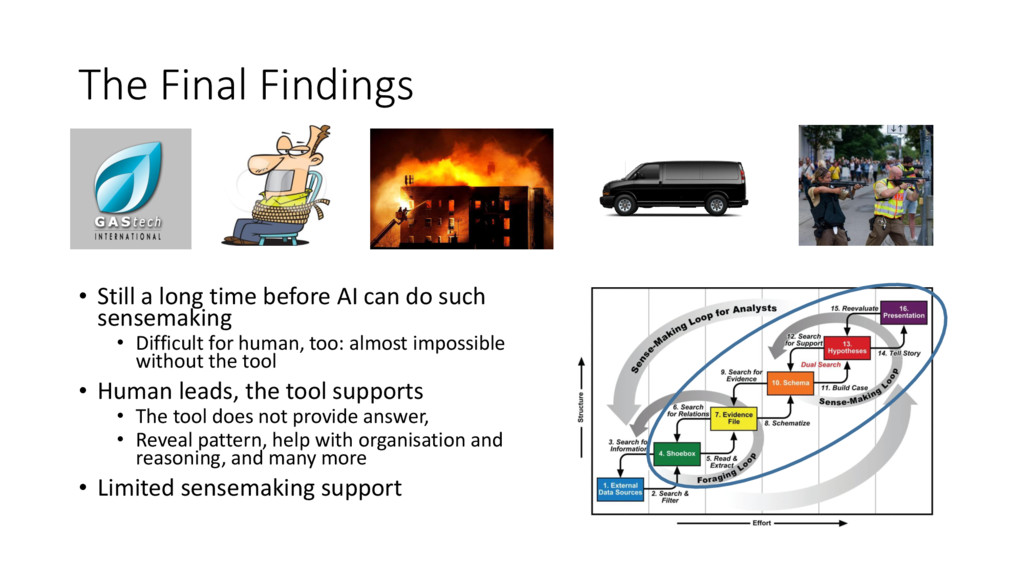
can do such sensemaking • Difficult for human, too: almost impossible without the tool • Human leads, the tool supports • The tool does not provide answer, • Reveal pattern, help with organisation and reasoning, and many more • Limited sensemaking support
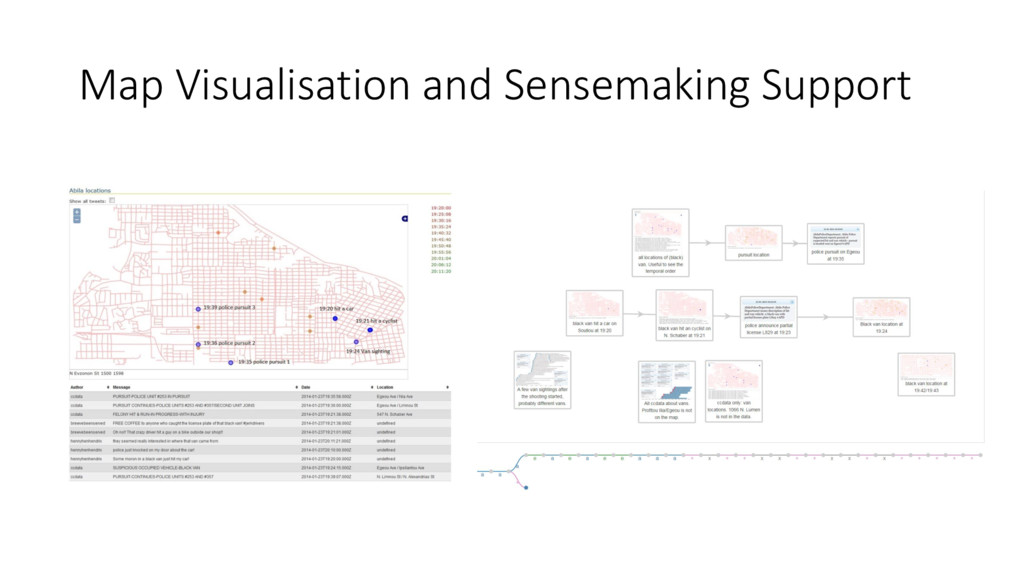
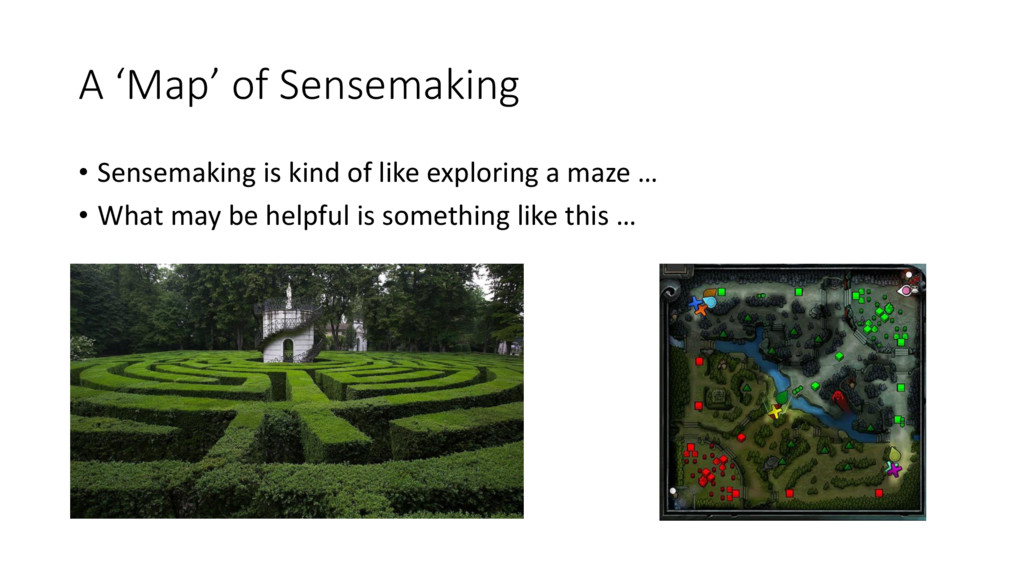
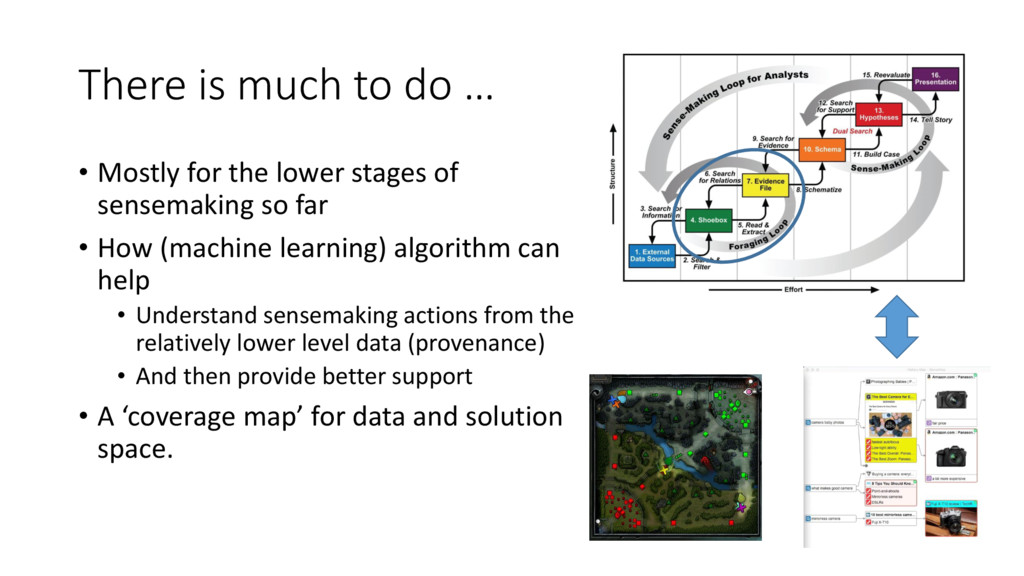
lower stages of sensemaking so far • How (machine learning) algorithm can help • Understand sensemaking actions from the relatively lower level data (provenance) • And then provide better support • A ‘coverage map’ for data and solution space.
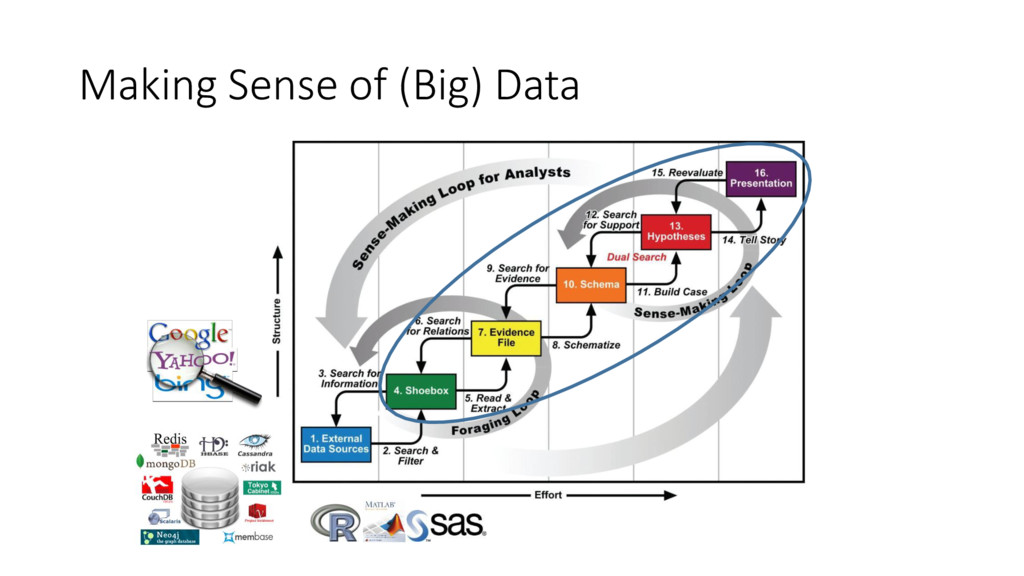
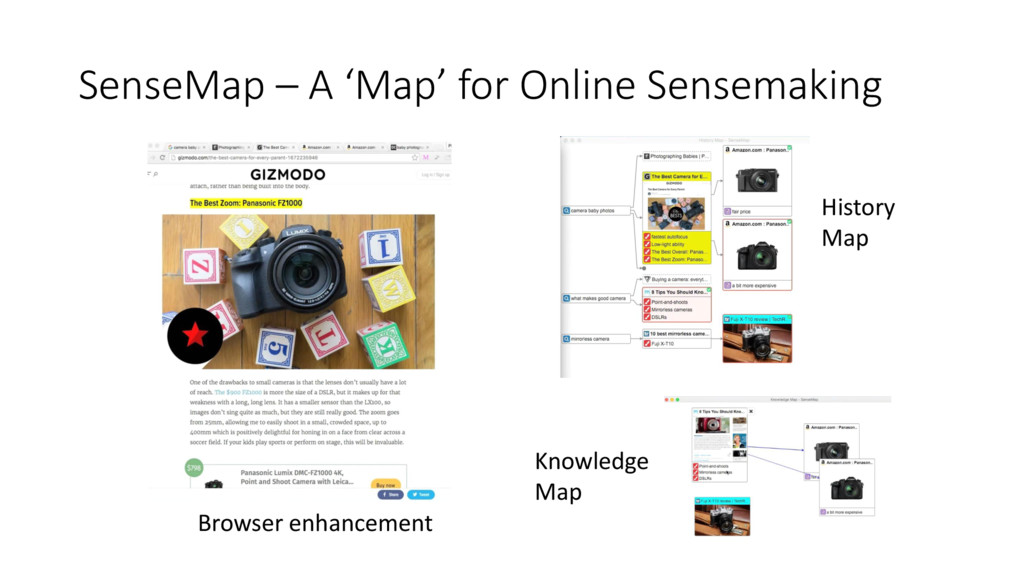
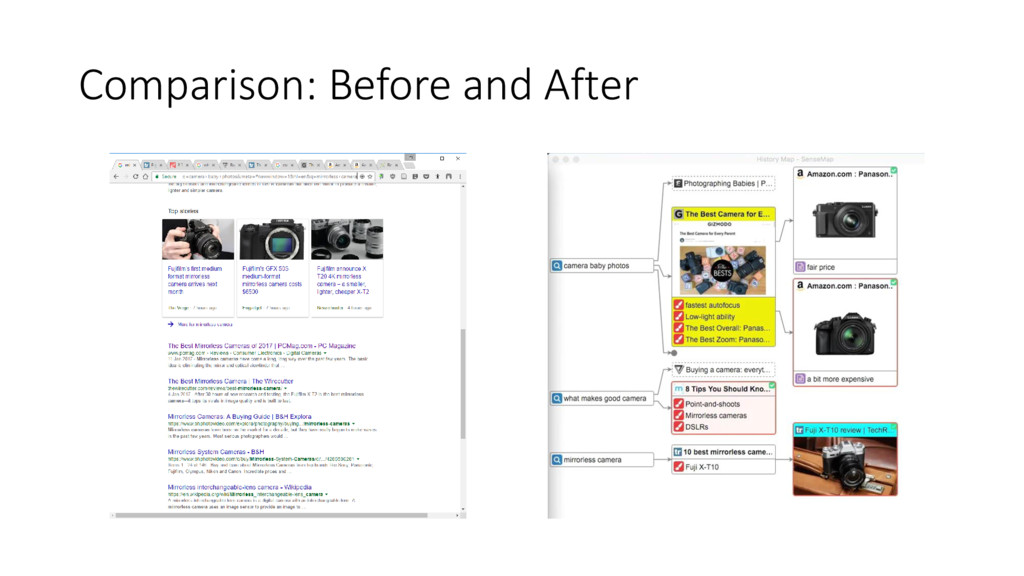
make decisions with data • It is important to Big Data, but there is limited support available • Visual Analytics combines data visualisation with analytics • A promising approach for sensemaking support More details about SAVI and SenseMap: http://vis4sense.github.io/