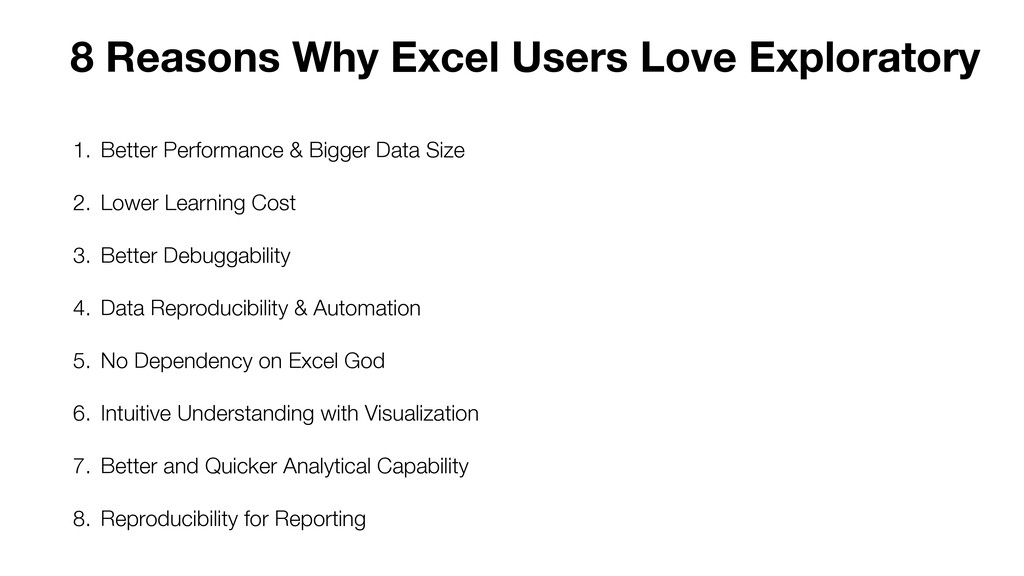
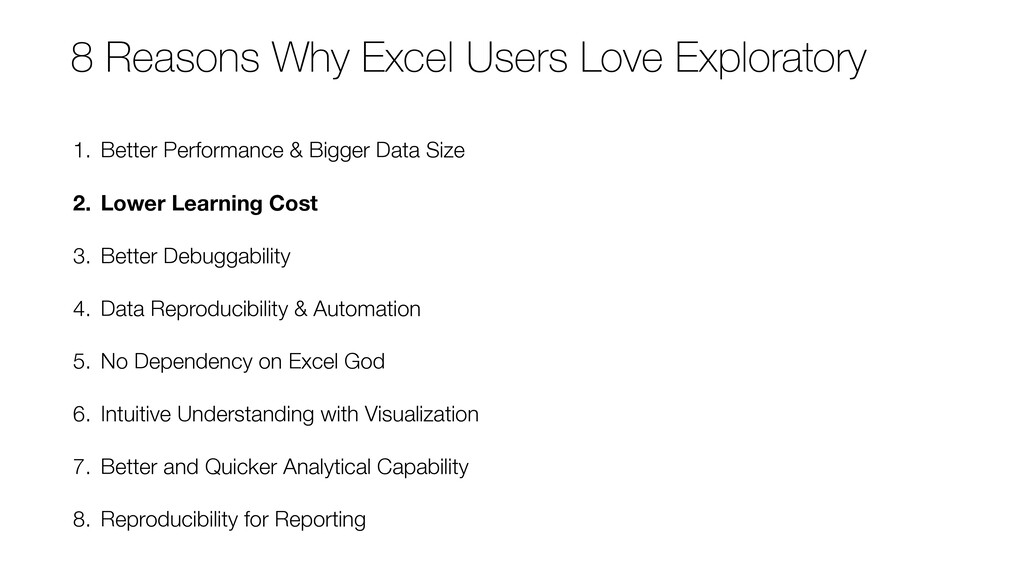
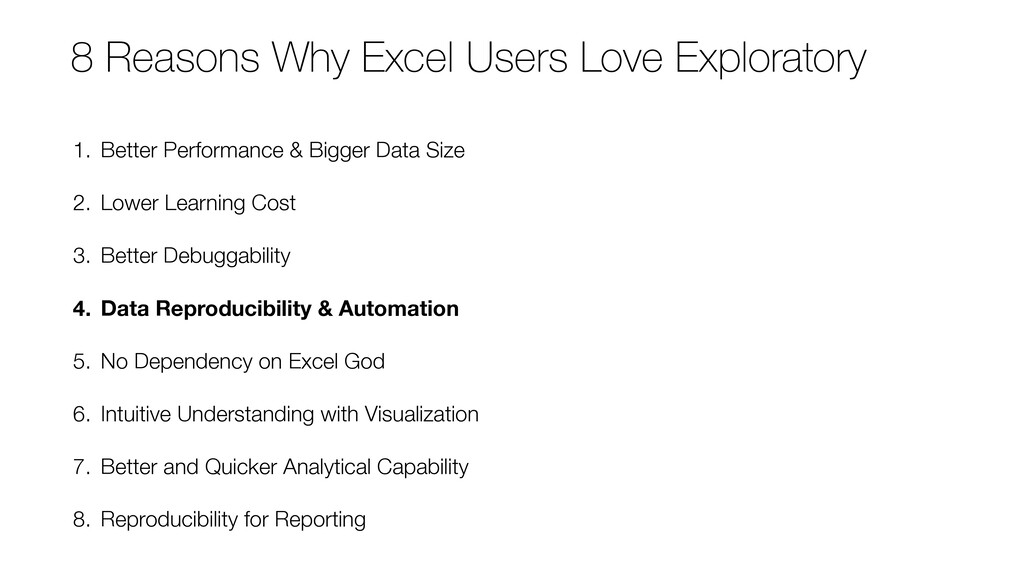
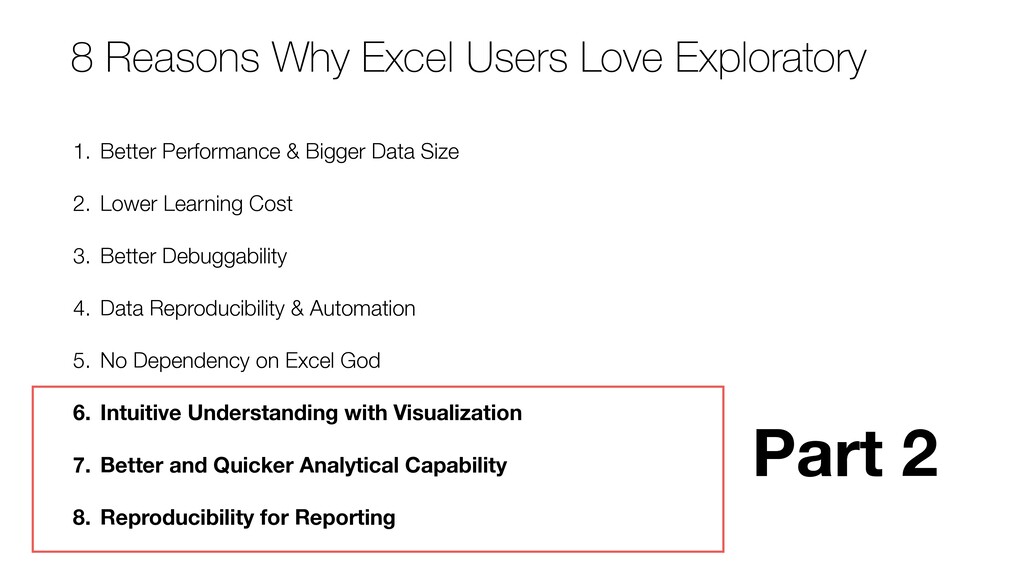
We have found 8 top reasons on why our users have chosen Exploratory over Excel for performing their day-to-day data analysis based on the interviews.
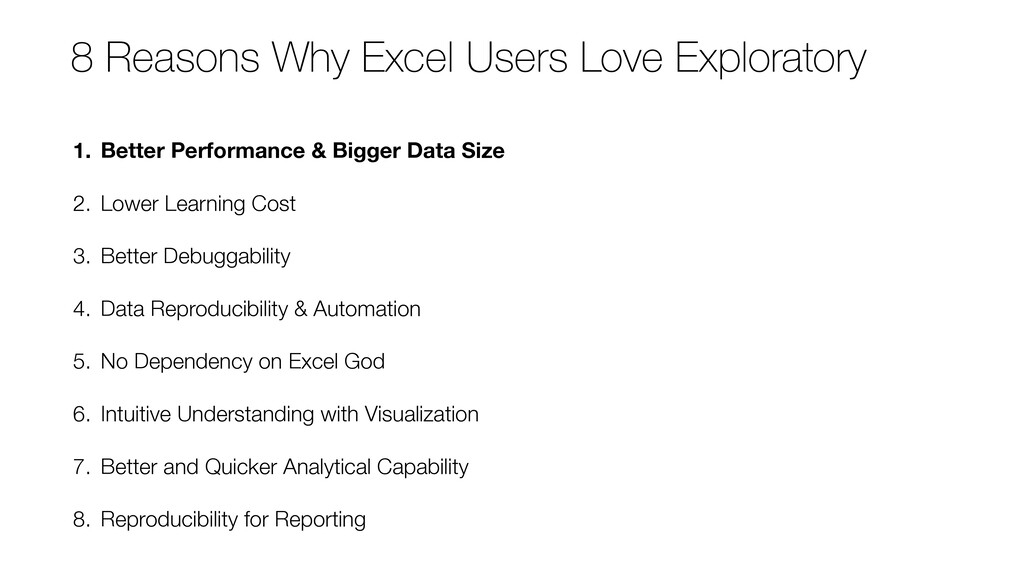
In this seminar, Kan will discuss the first 4 of them along with a live demo.
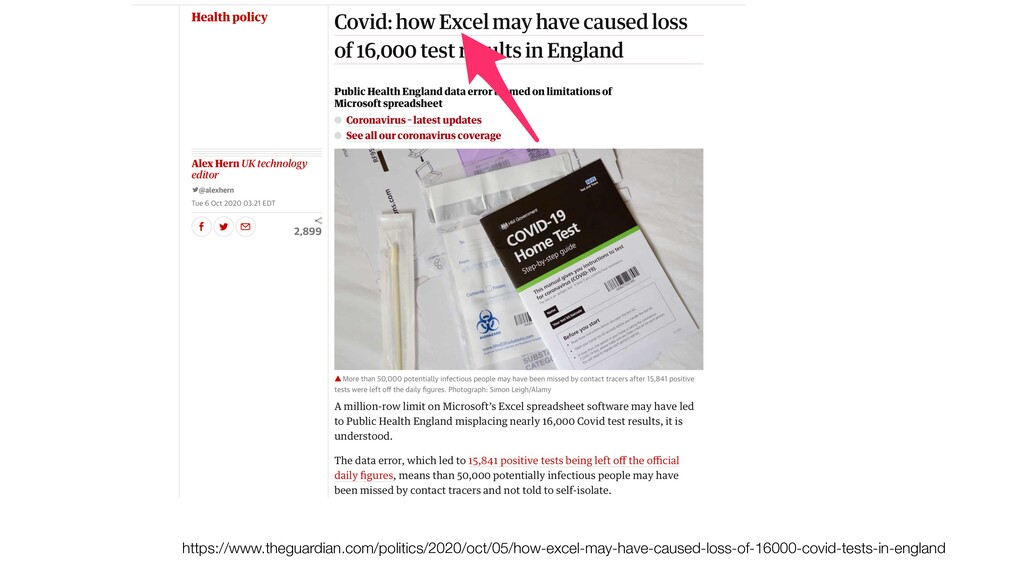
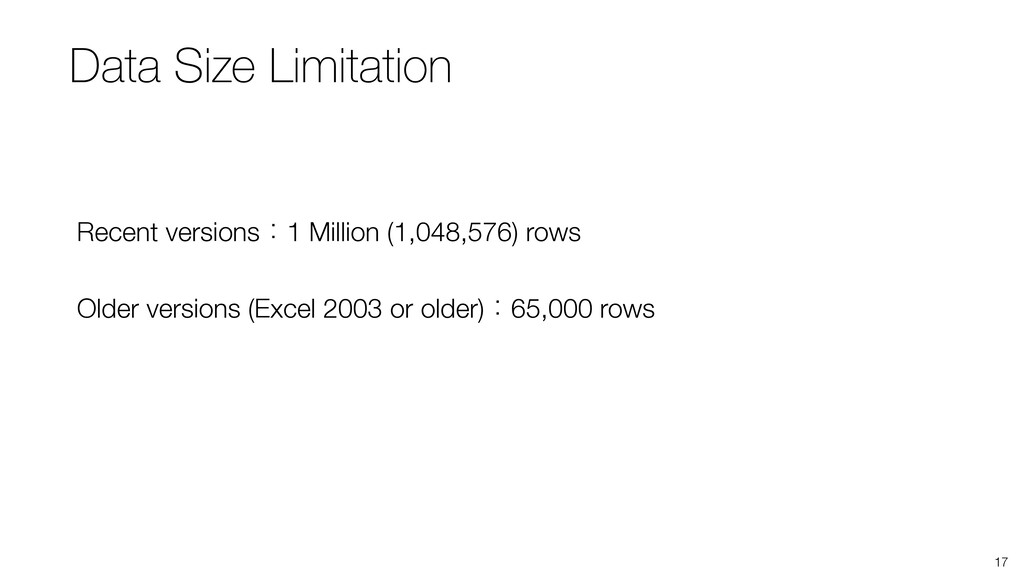
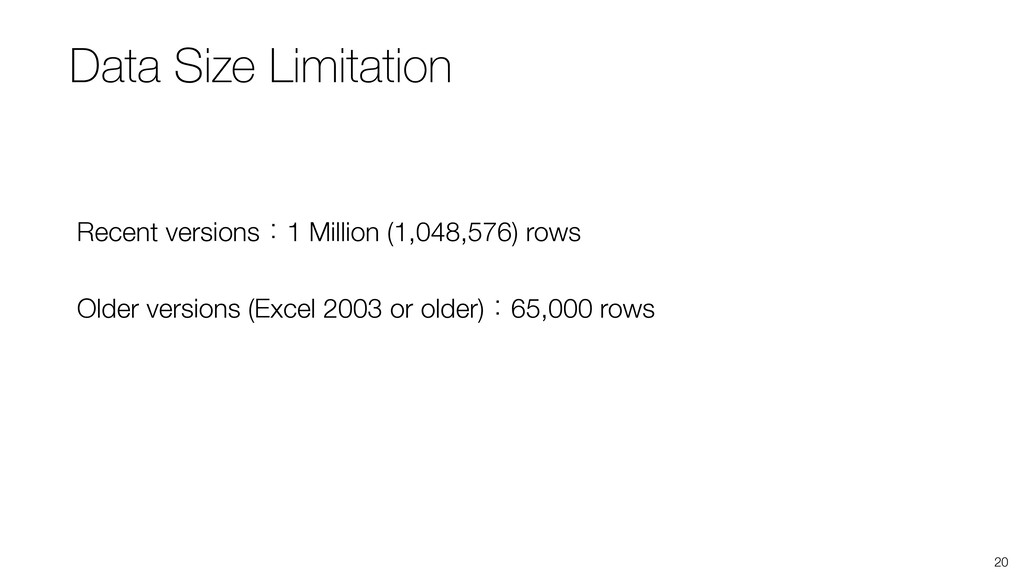
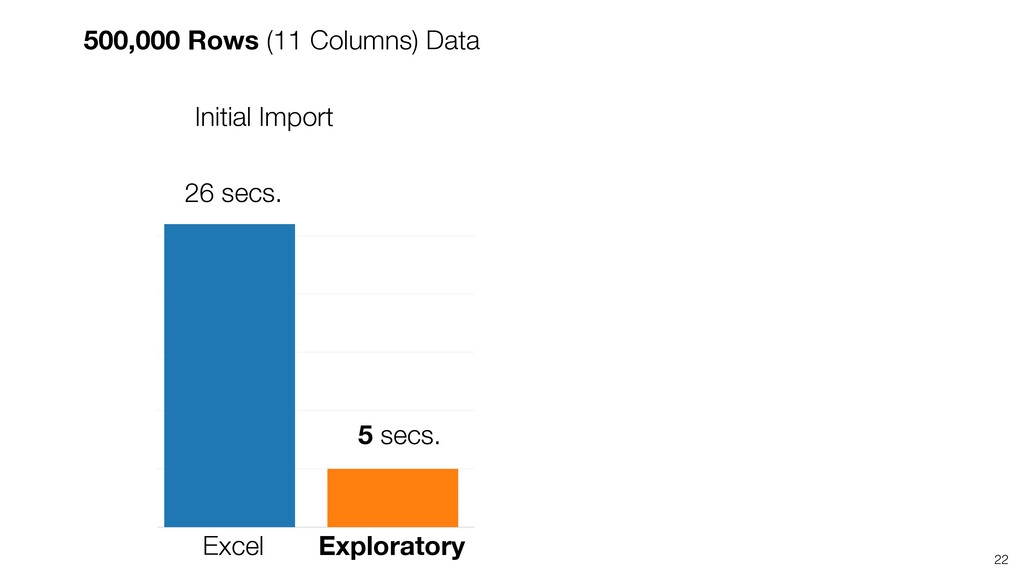
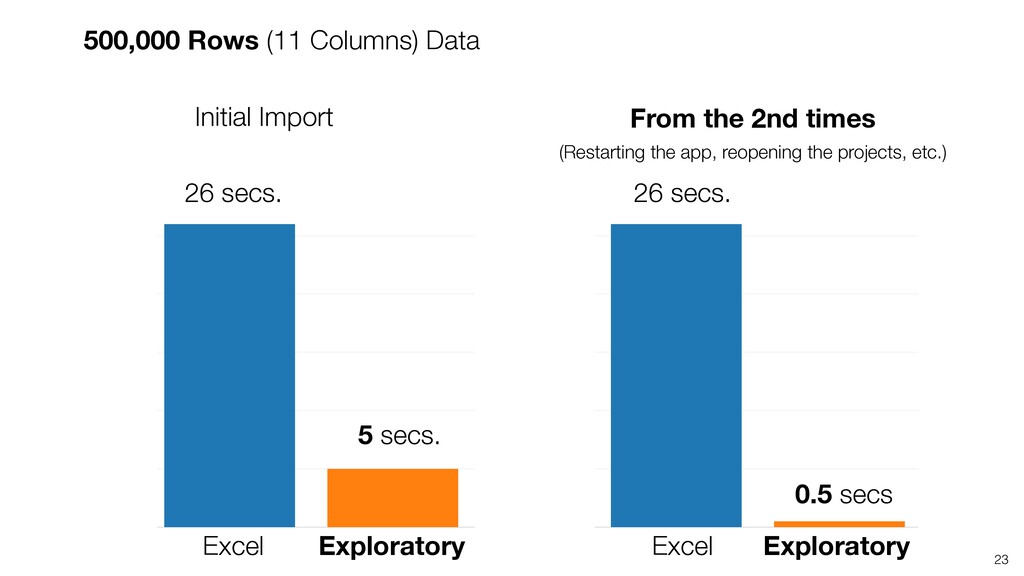
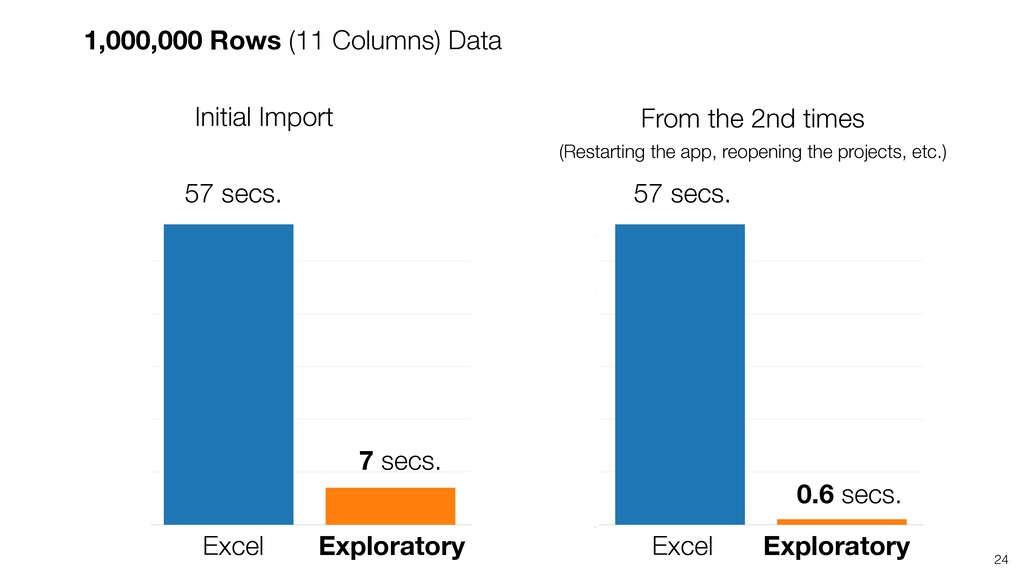
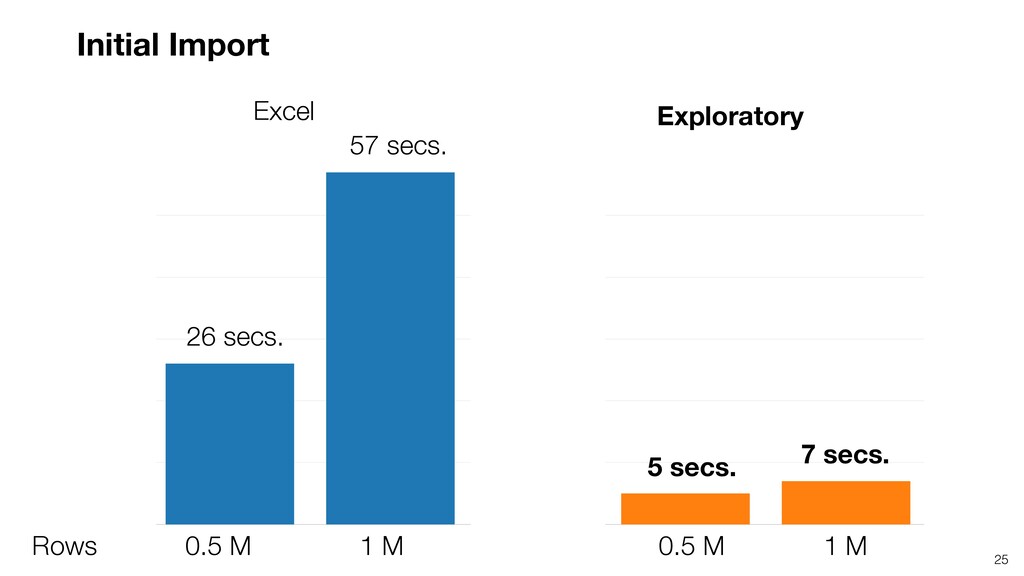
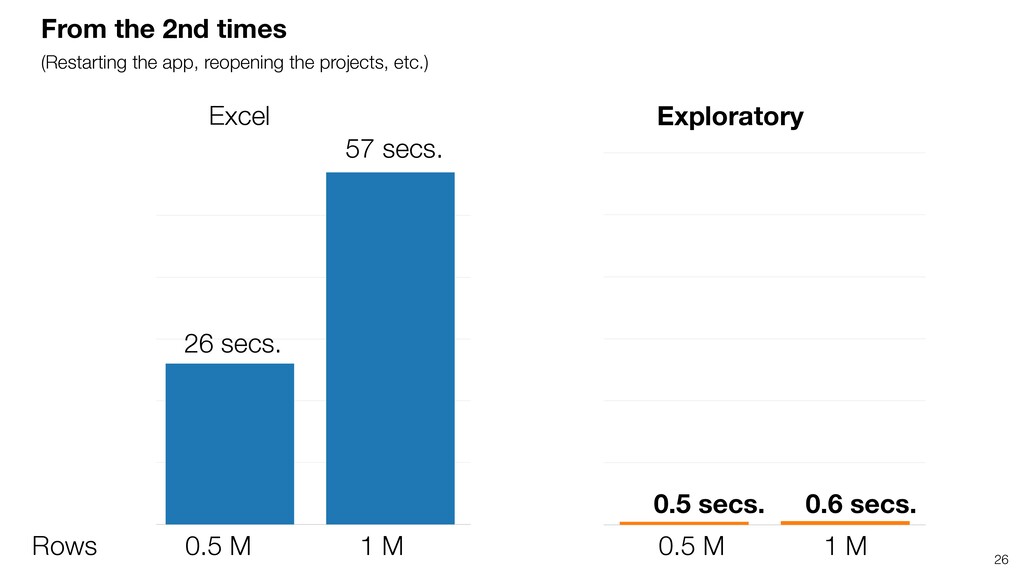
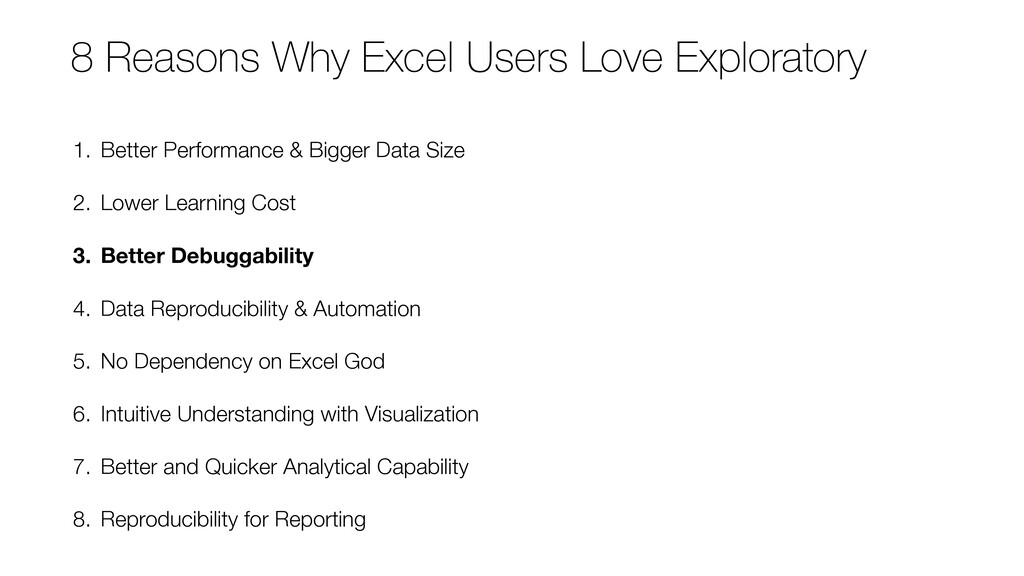
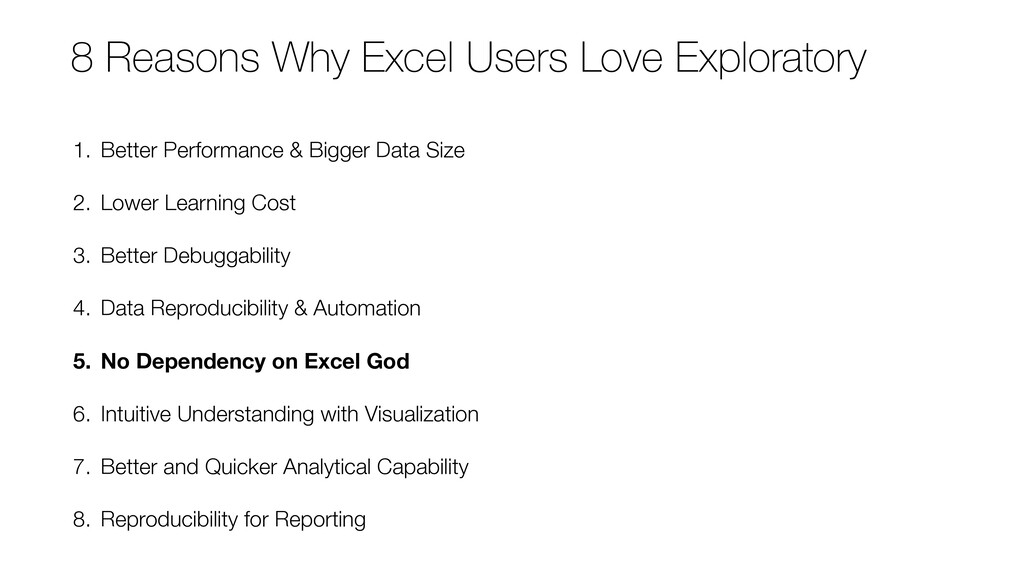
* Data Size Limitation & Performance
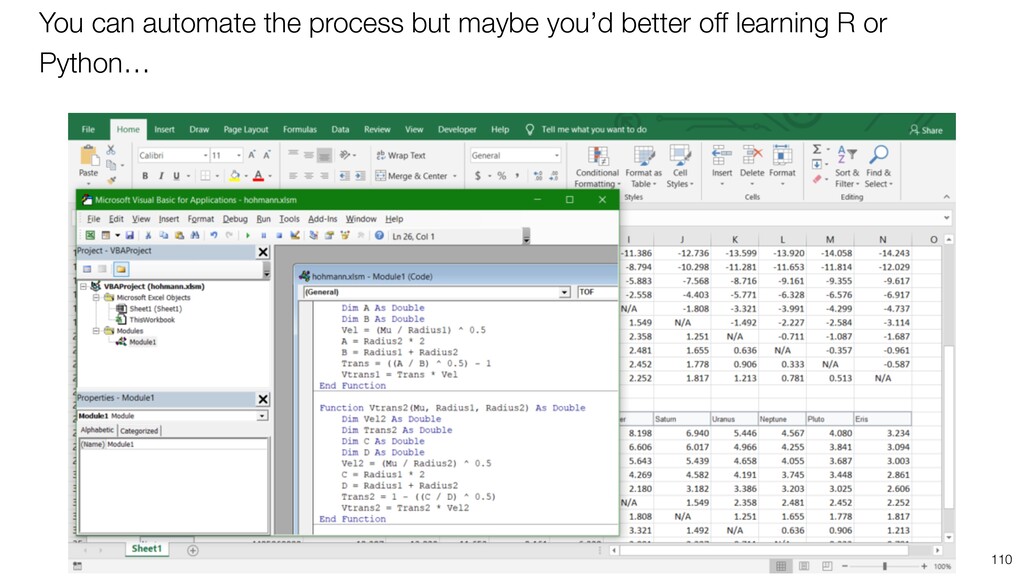
* Learning Cost
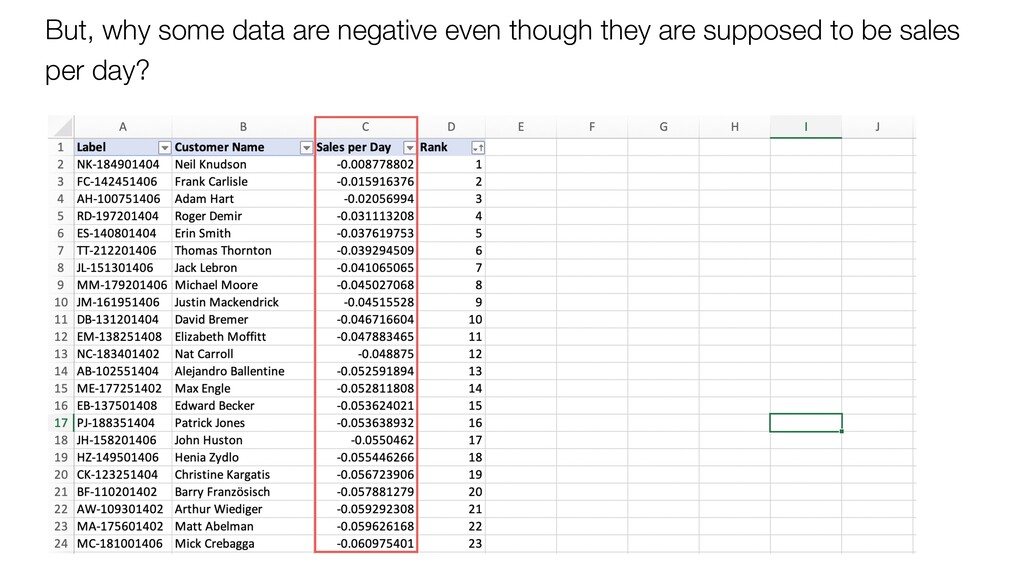
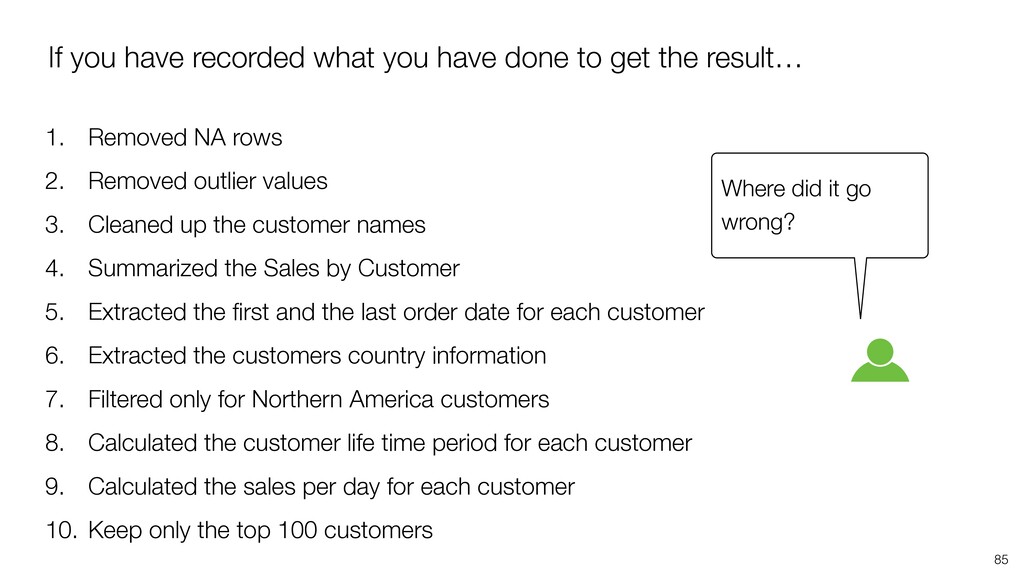
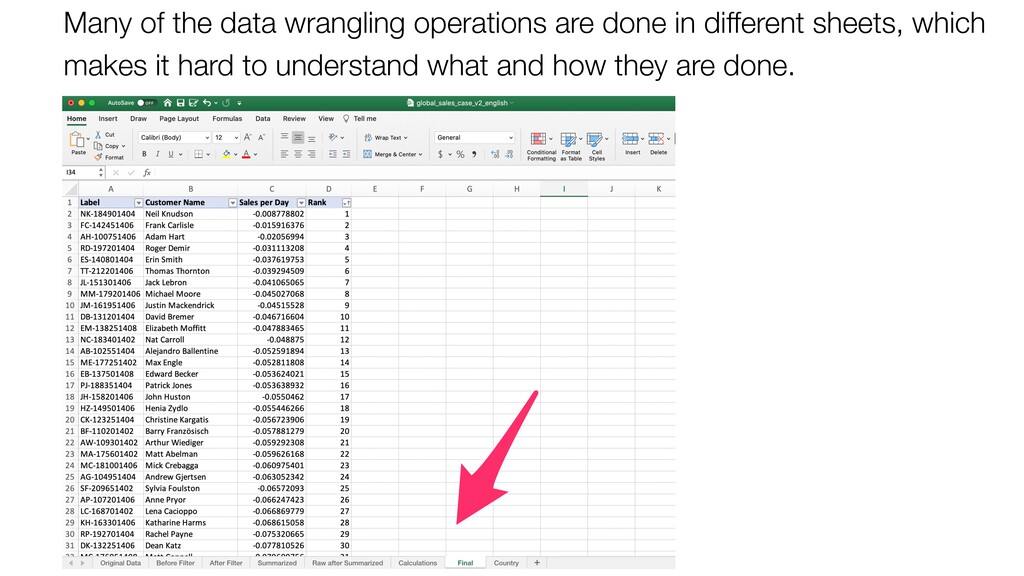
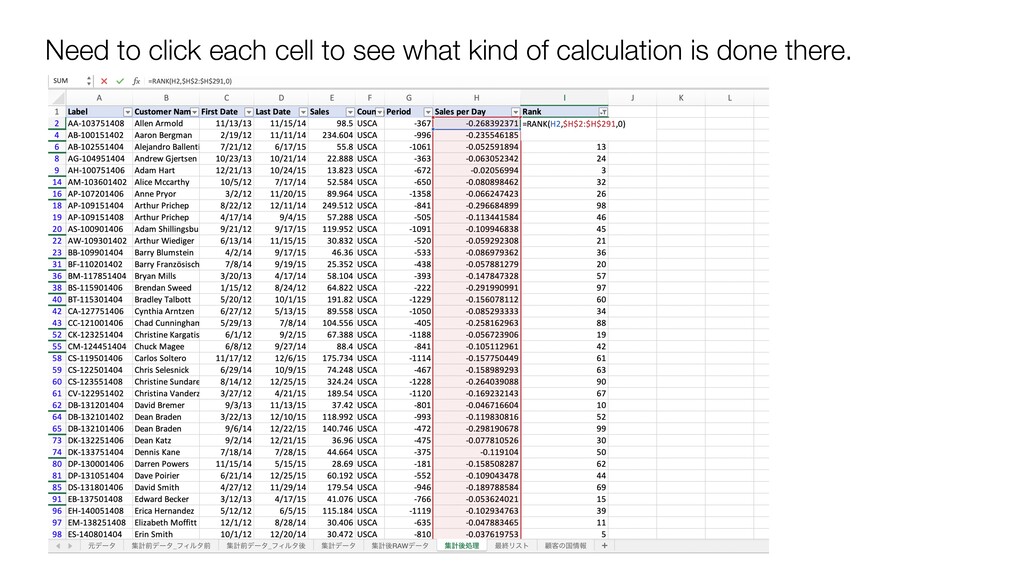
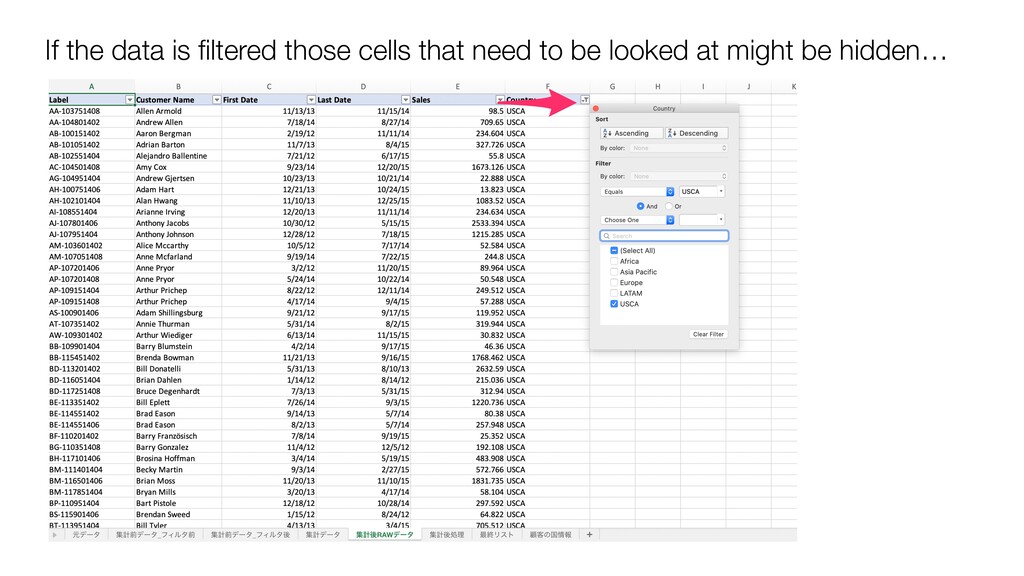
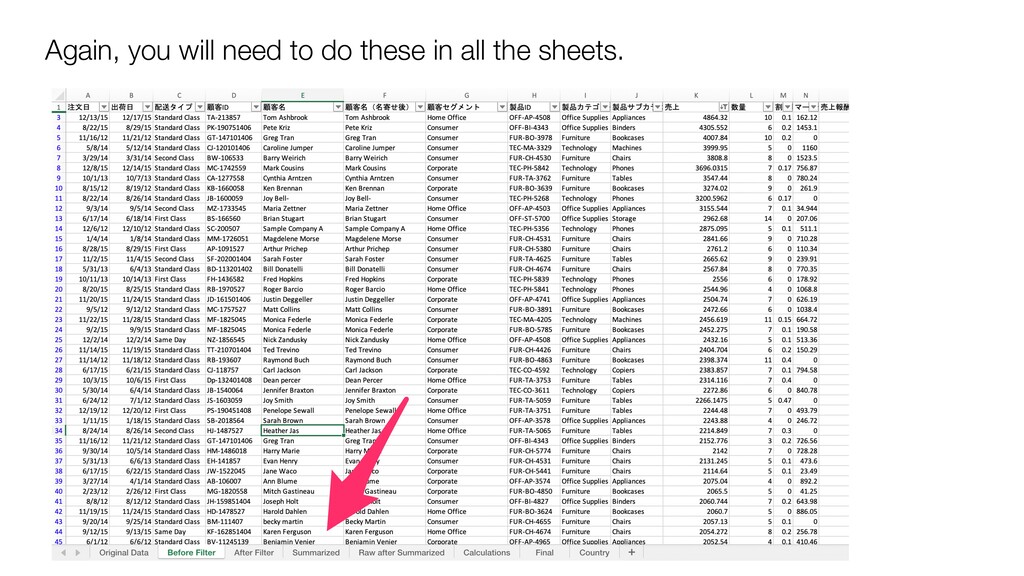
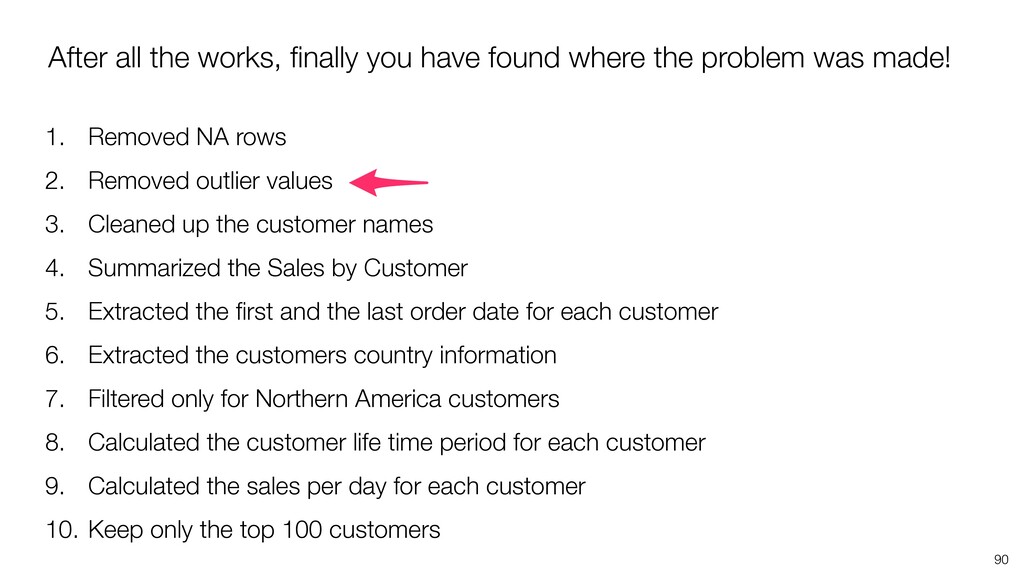
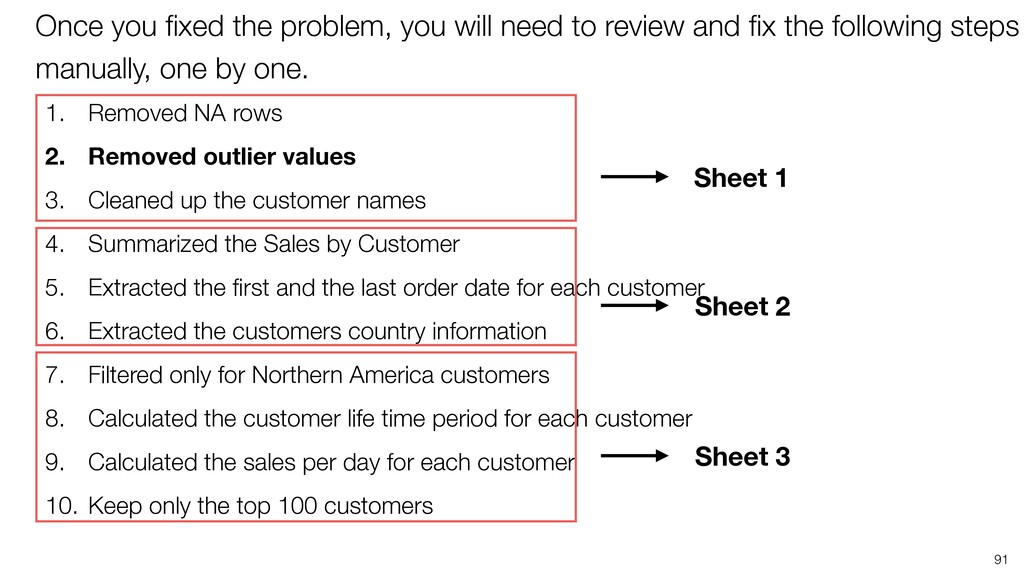
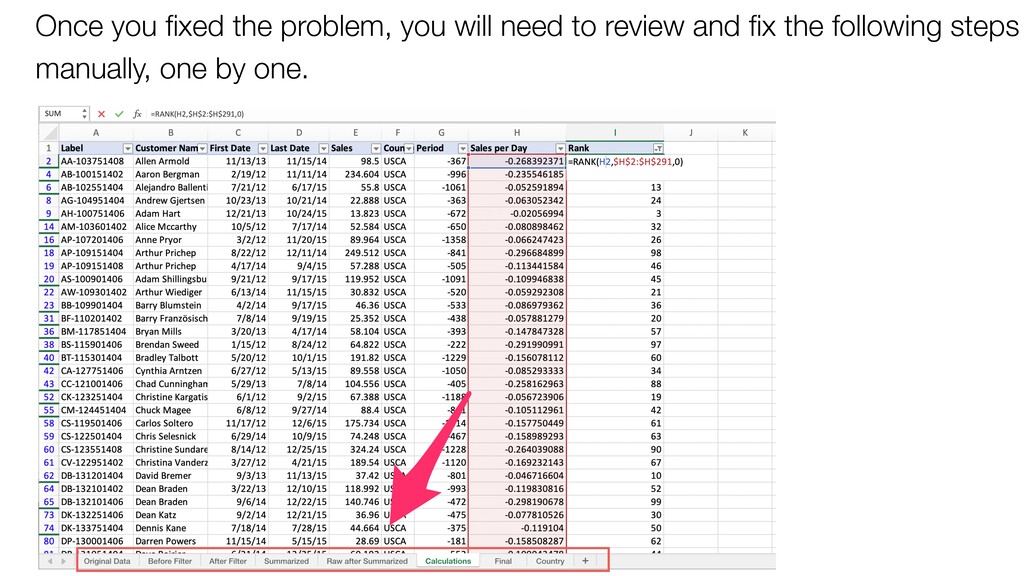
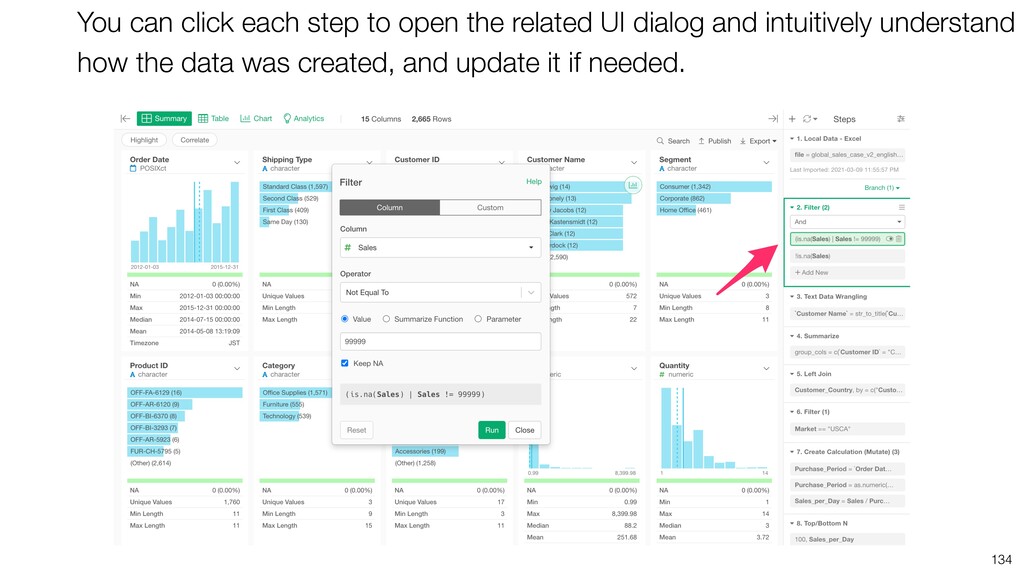
* Debuggability
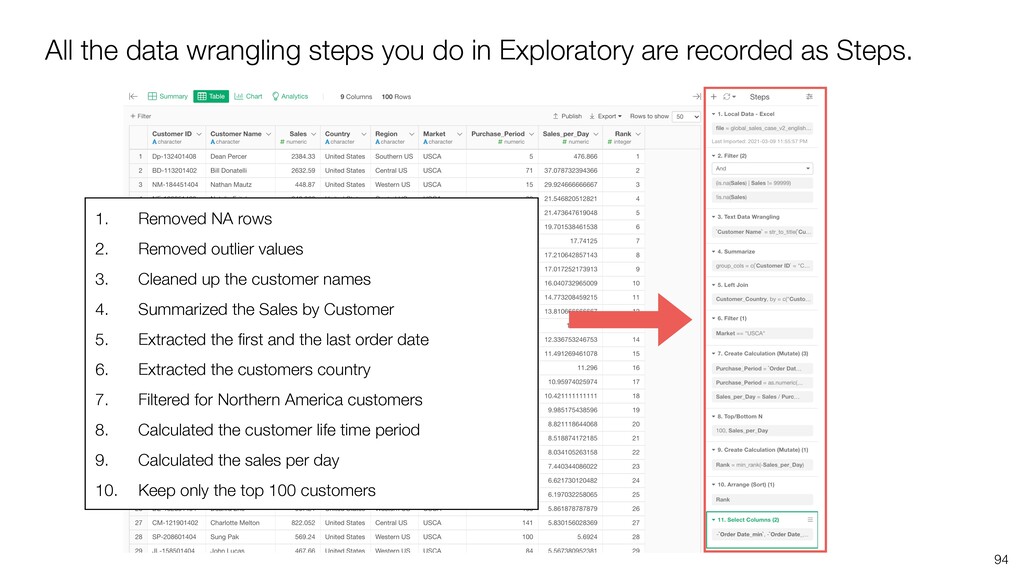
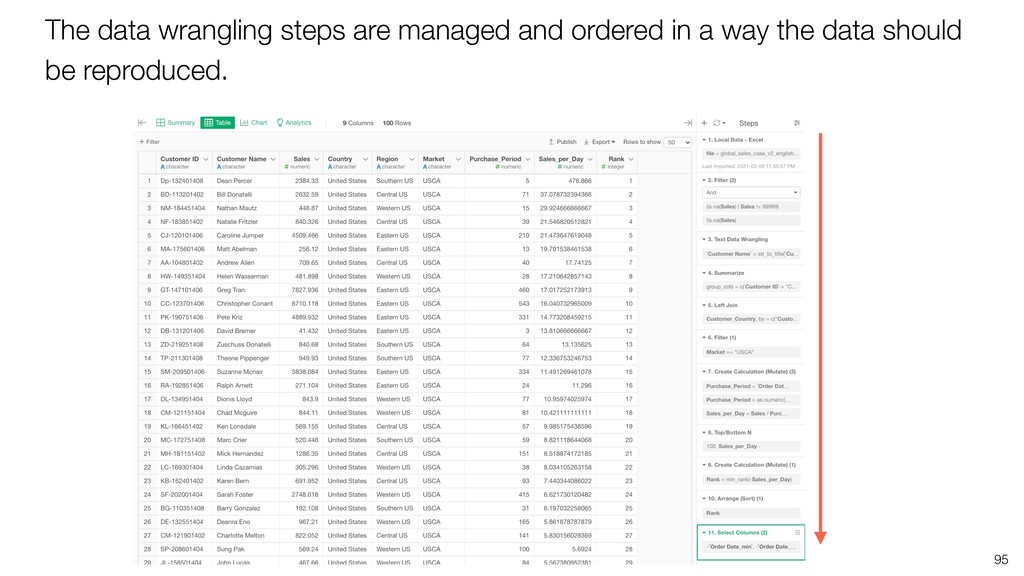
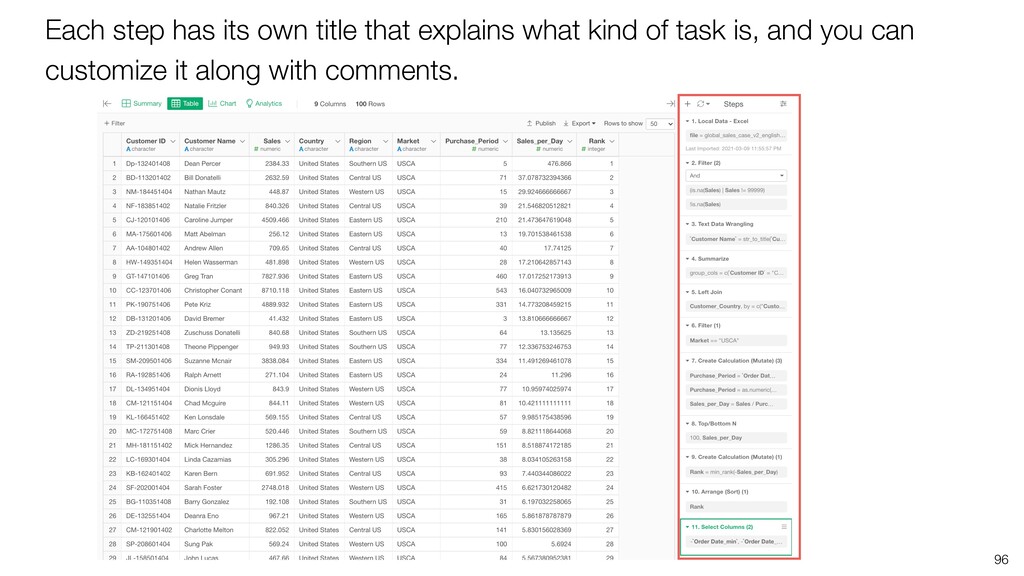
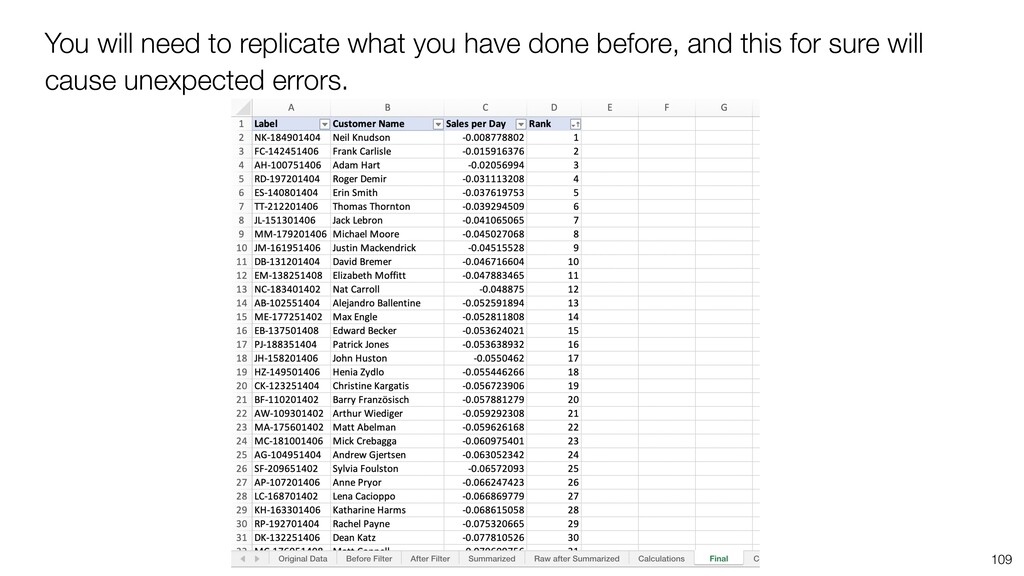
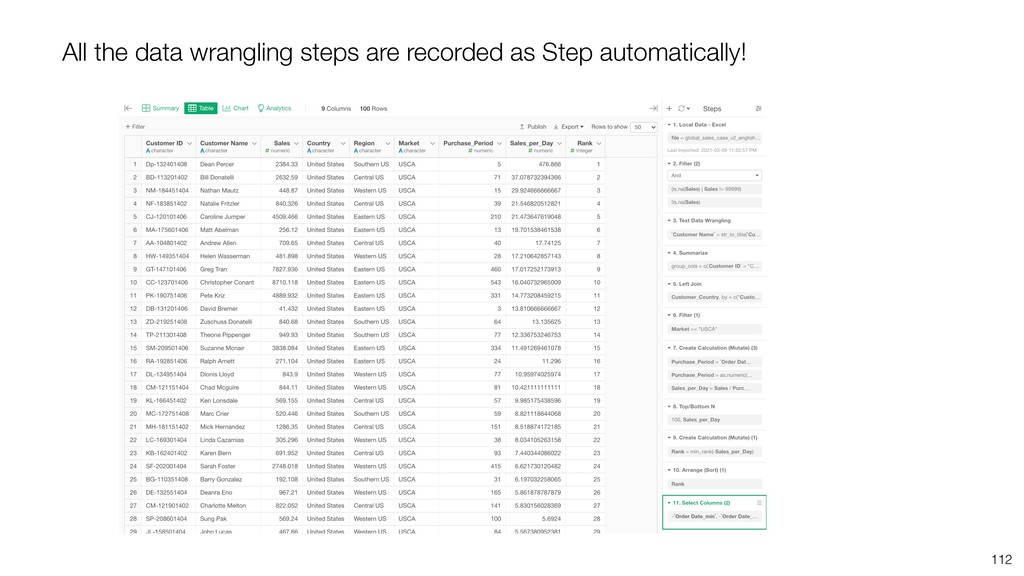
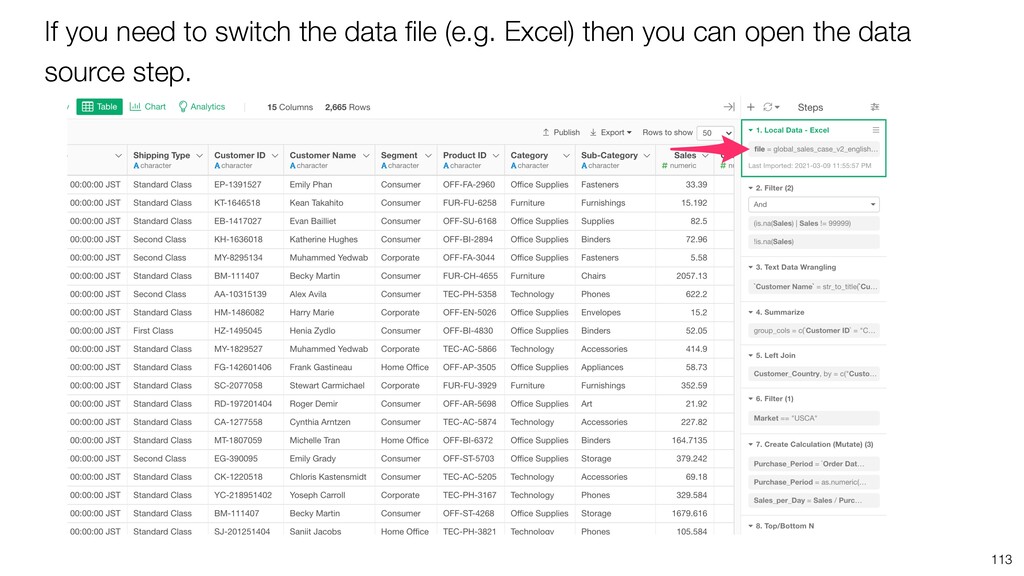
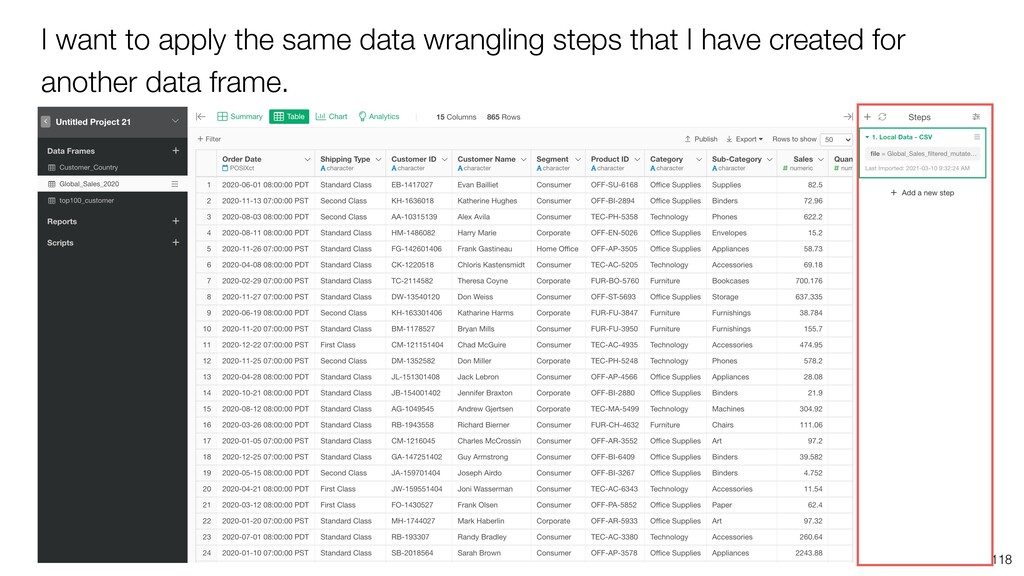
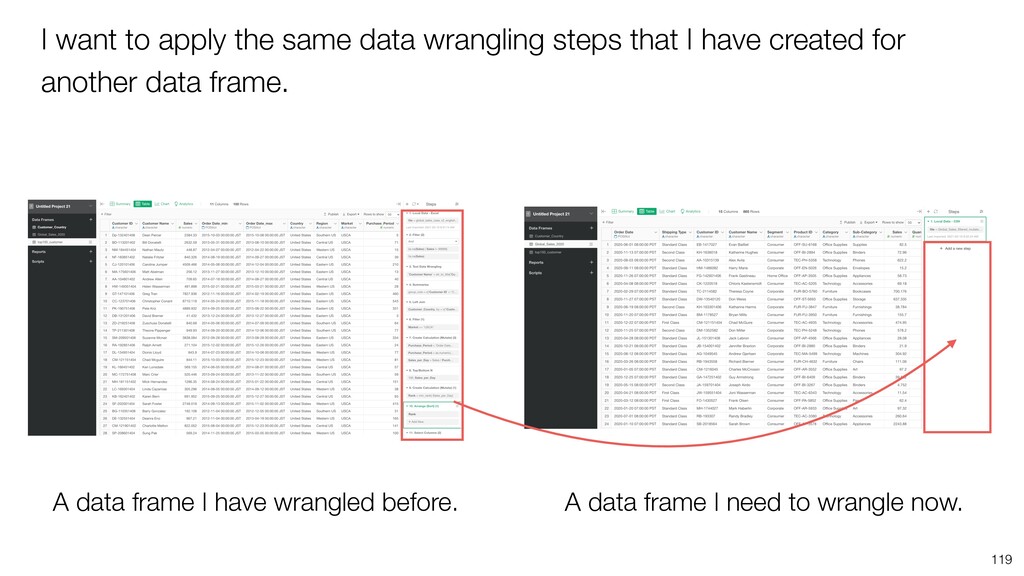
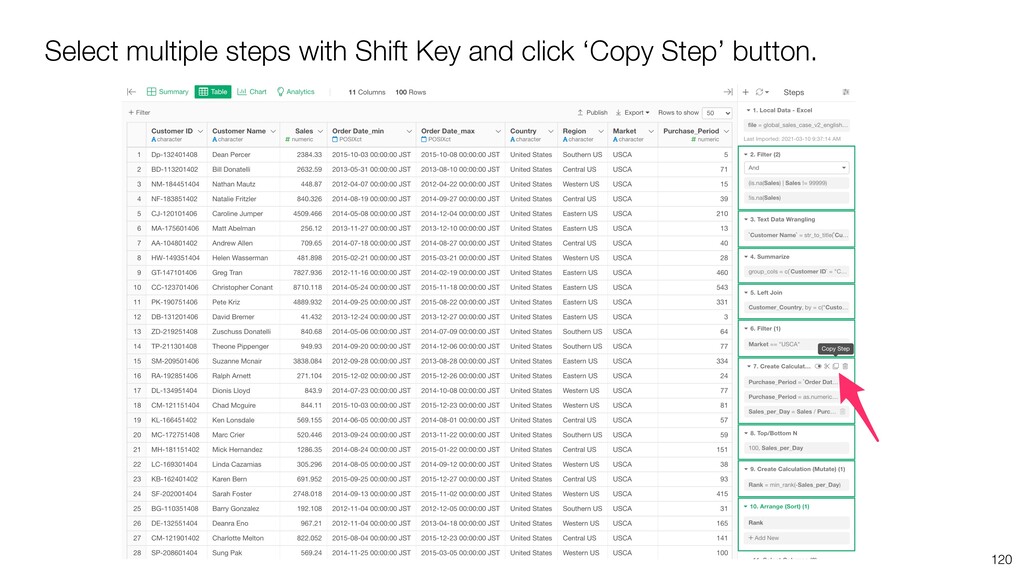
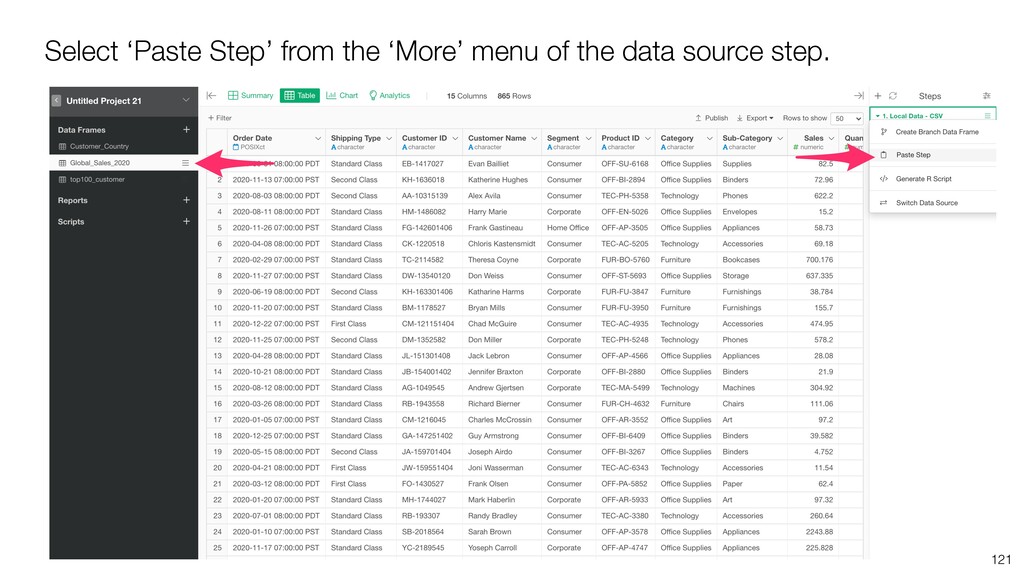
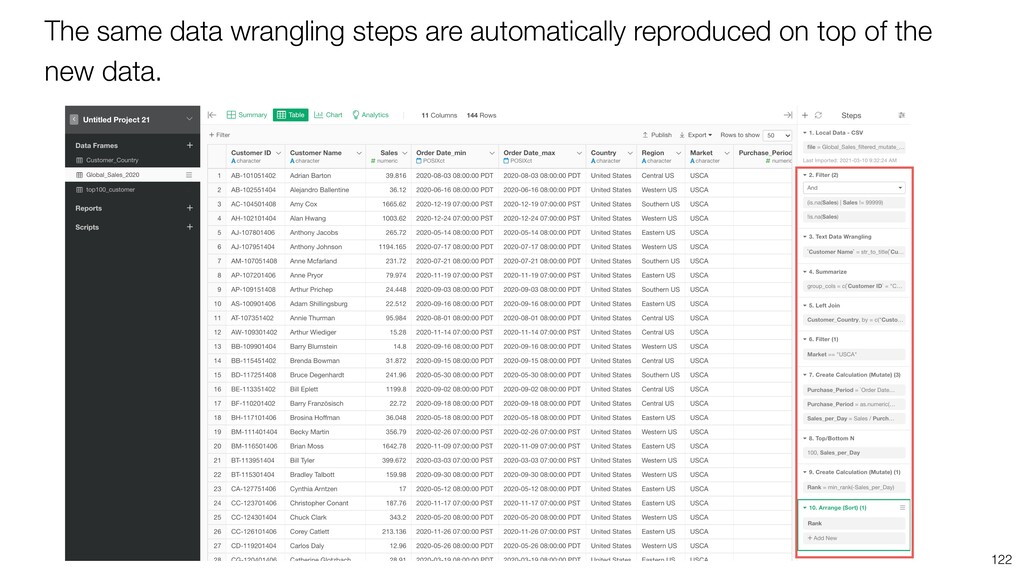
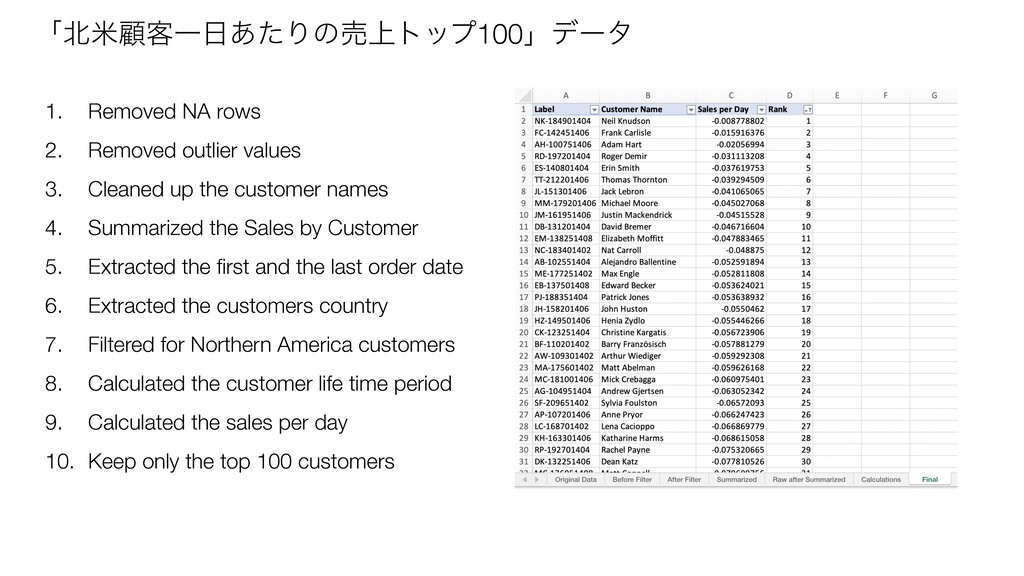
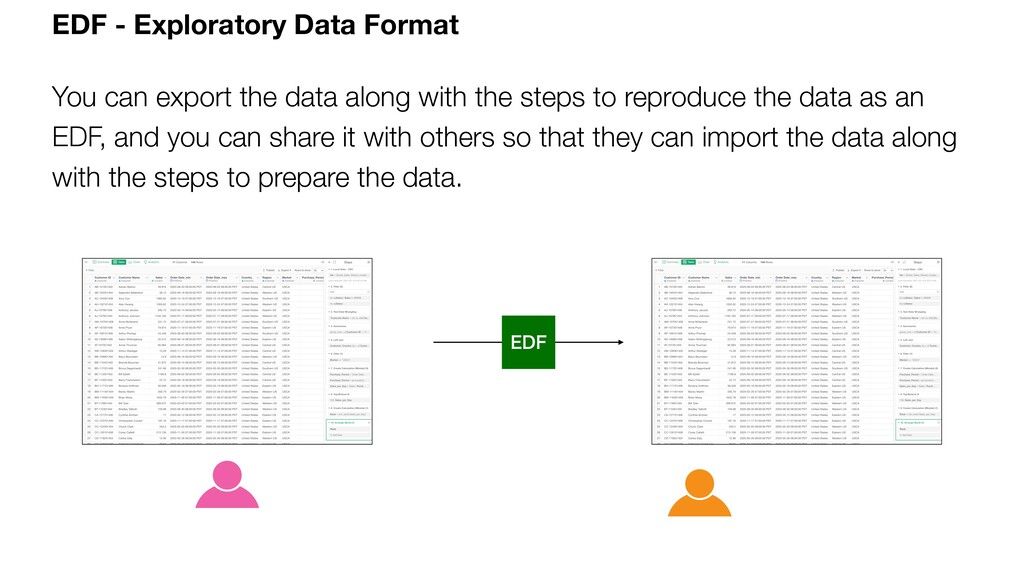
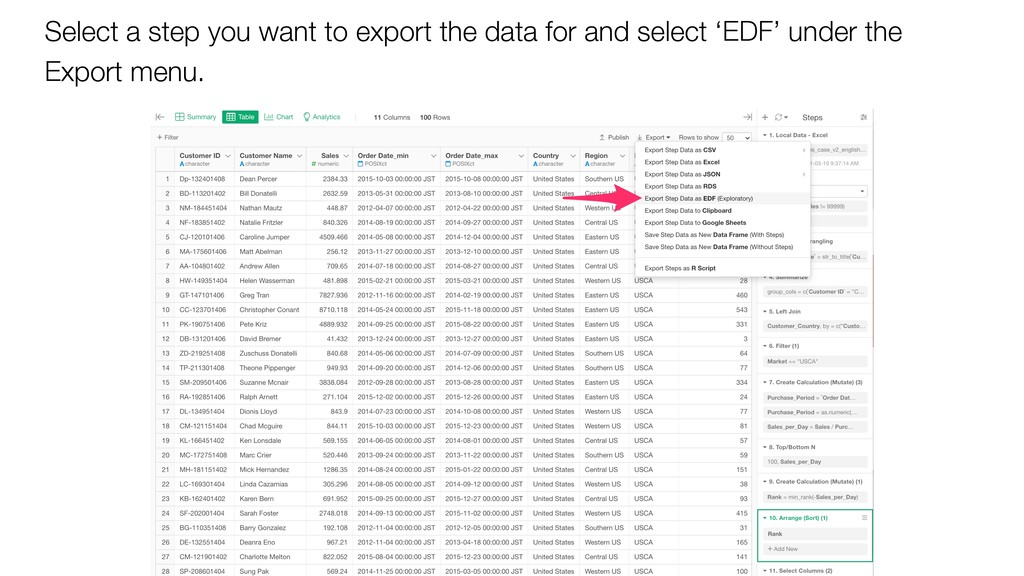
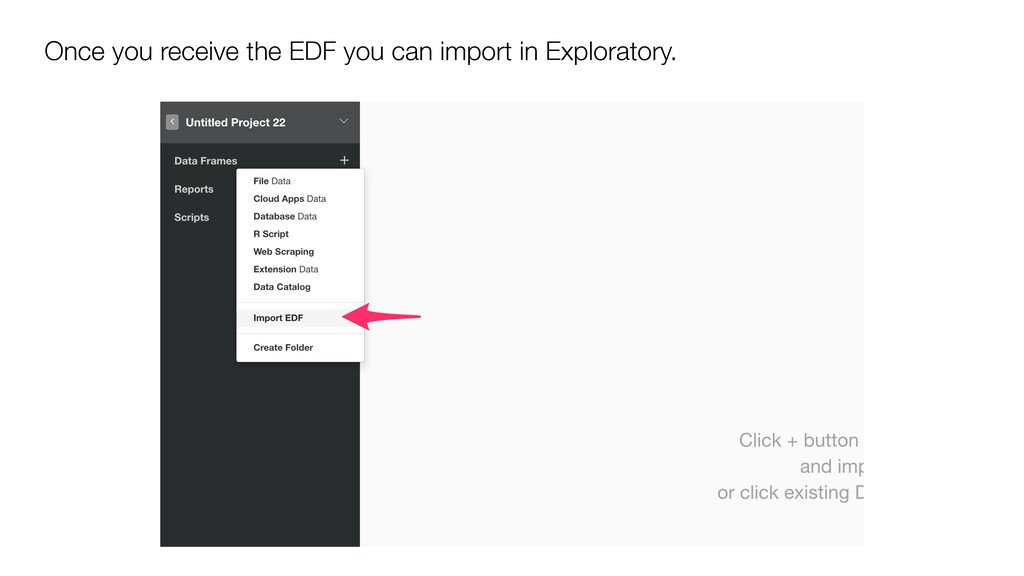
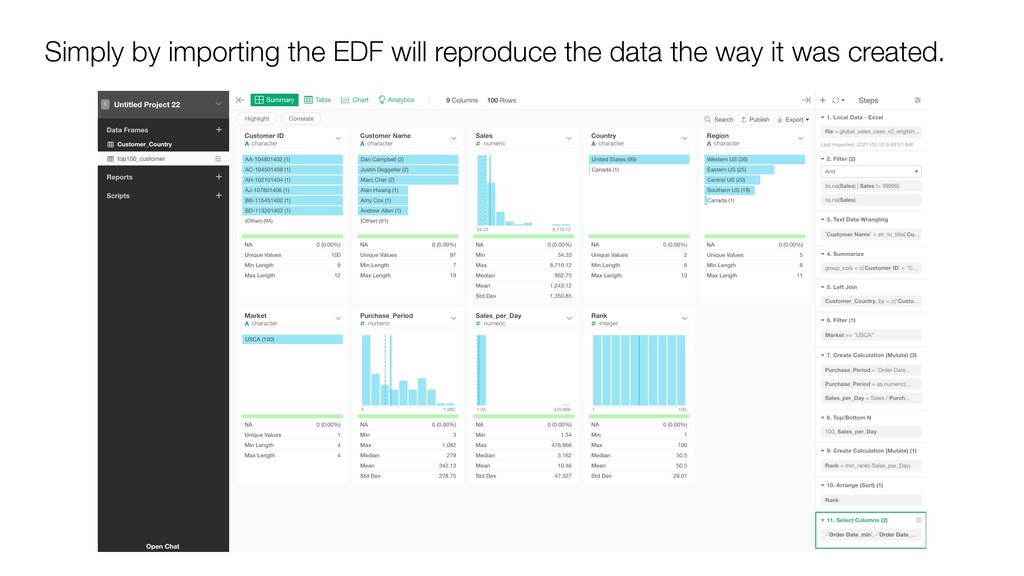
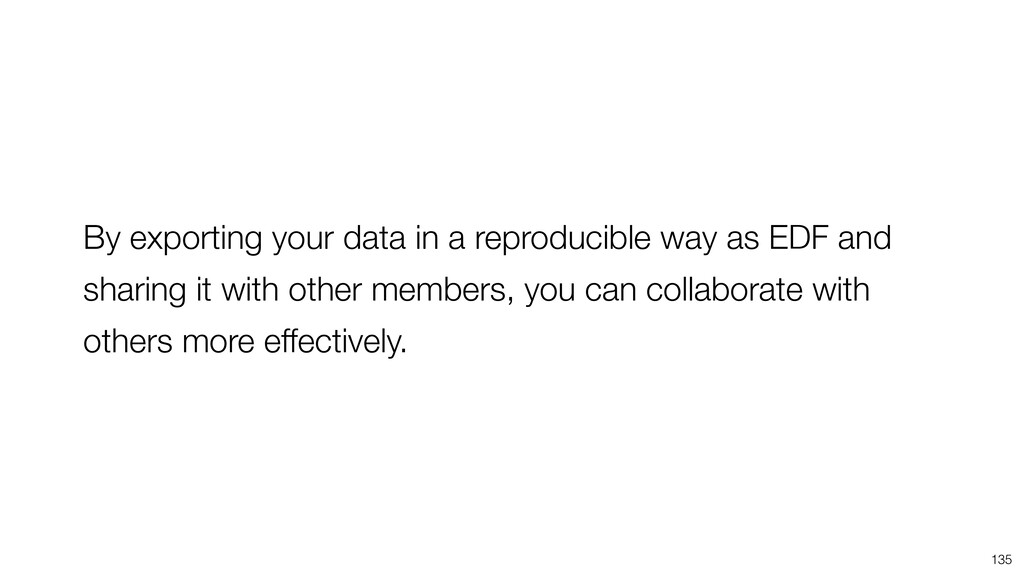
* Data Reproducibility & Automation
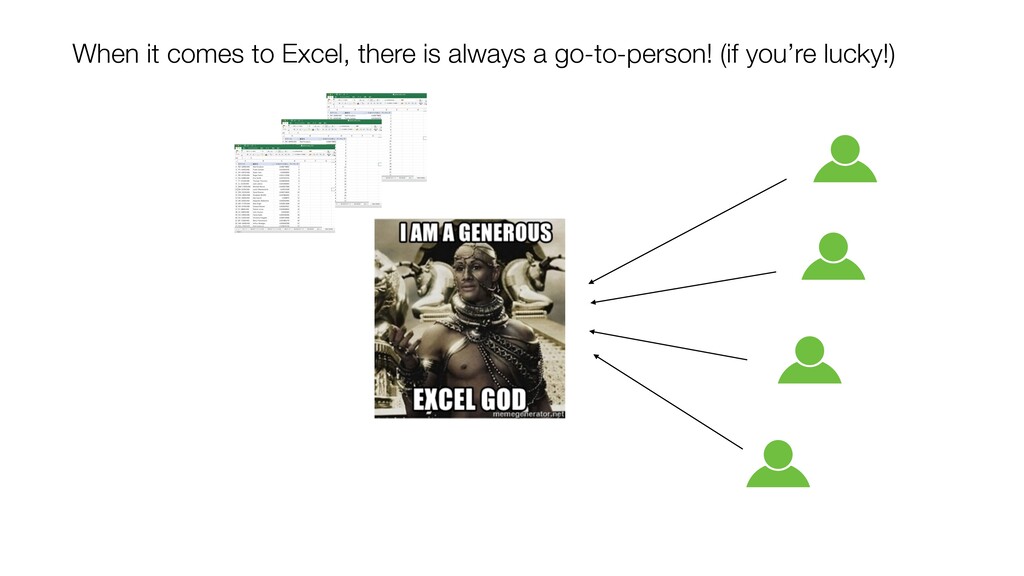
* Specialization with Excel God
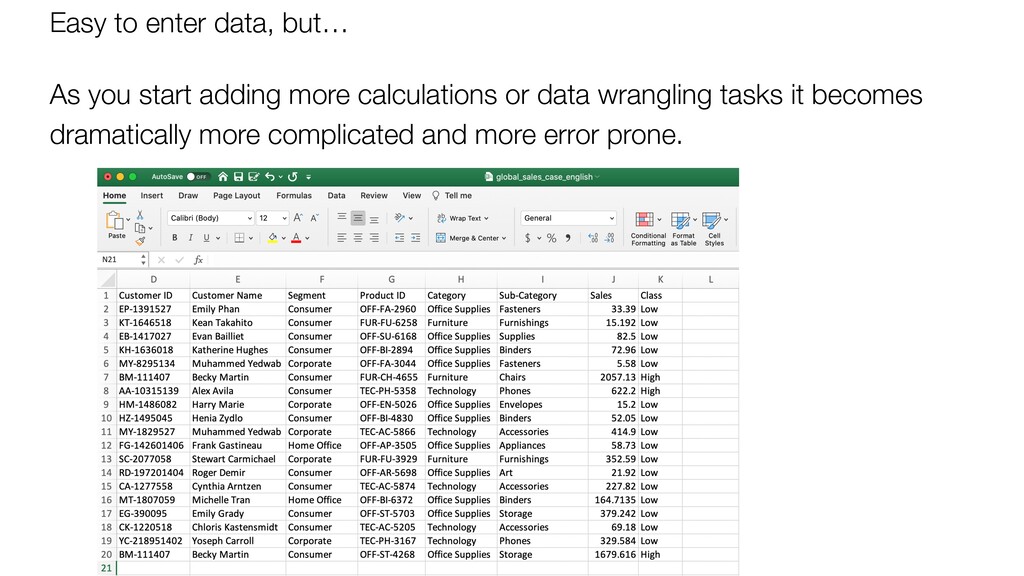
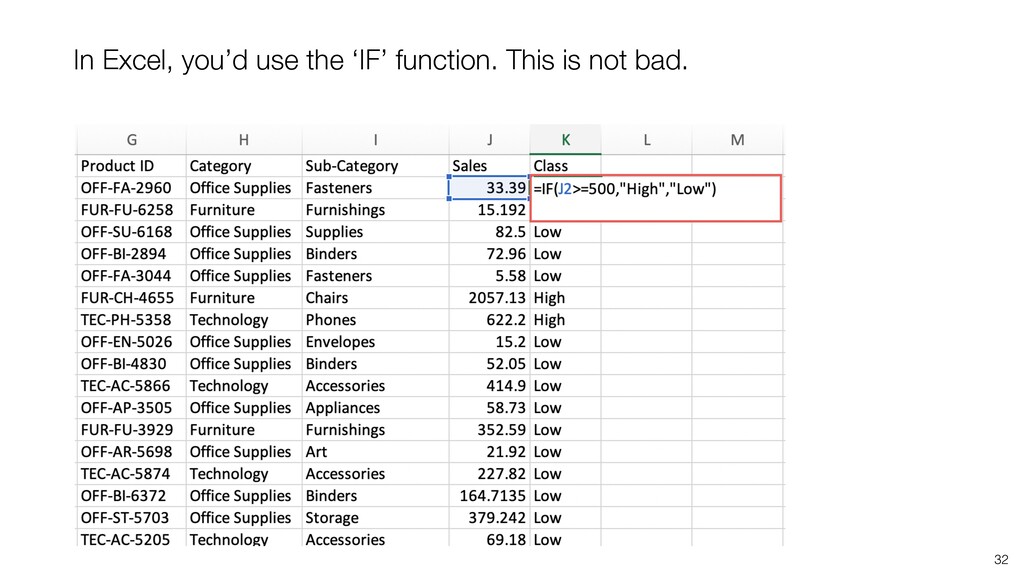
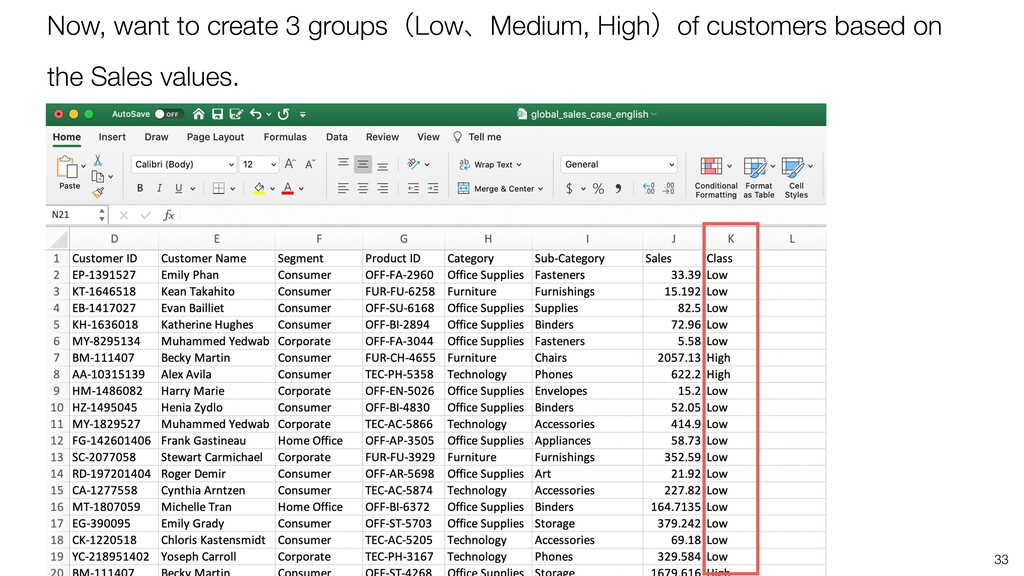
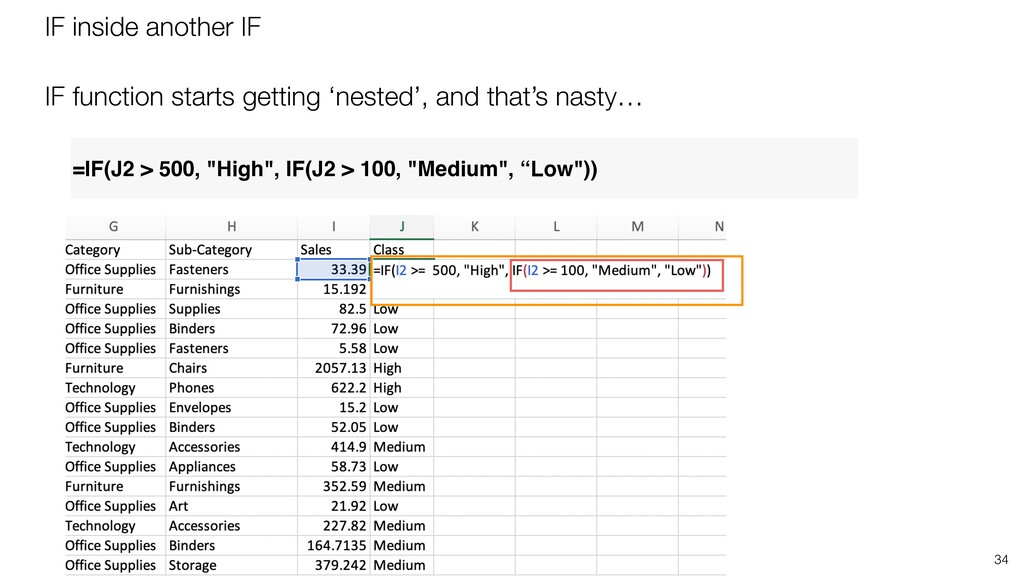
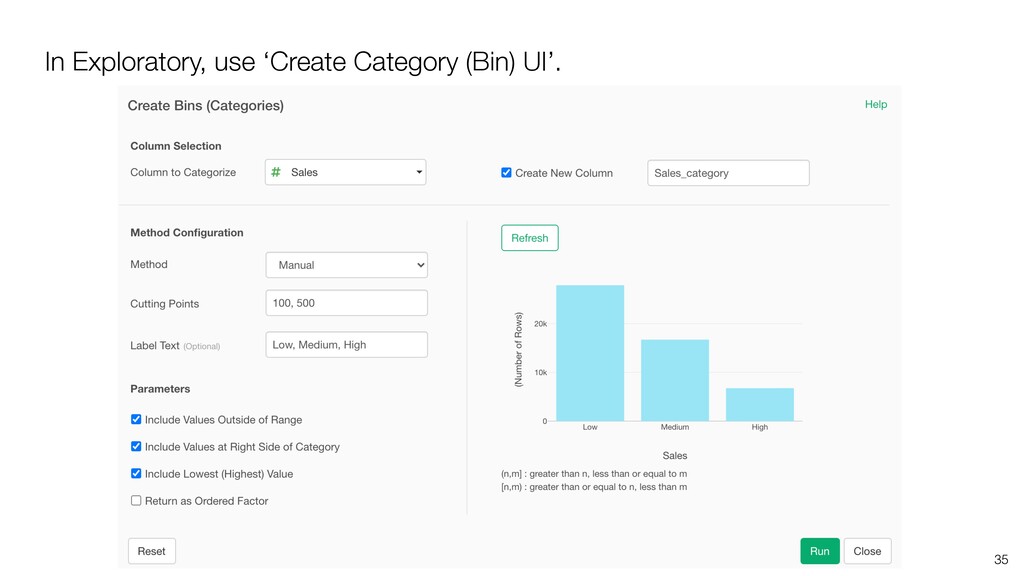
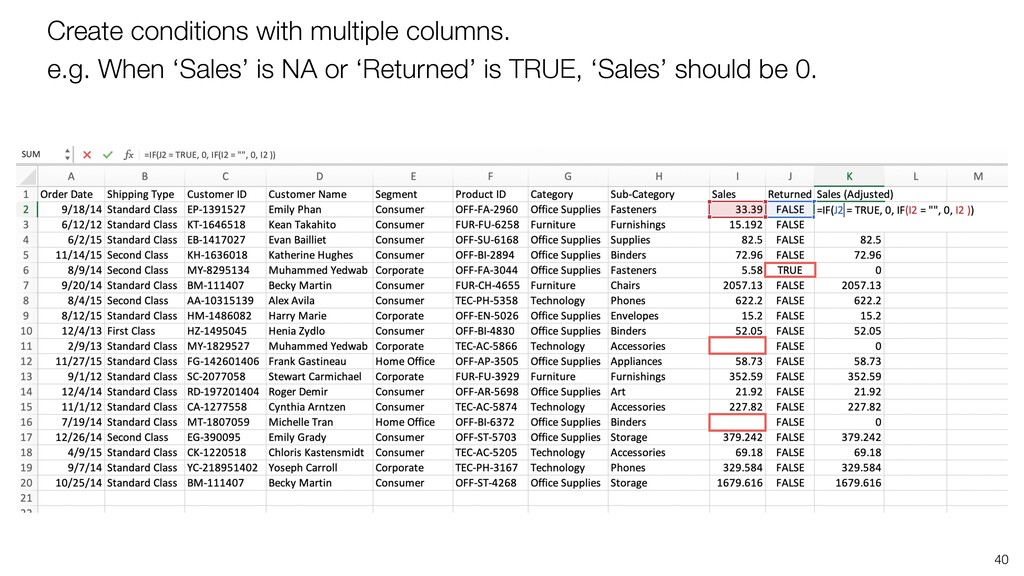
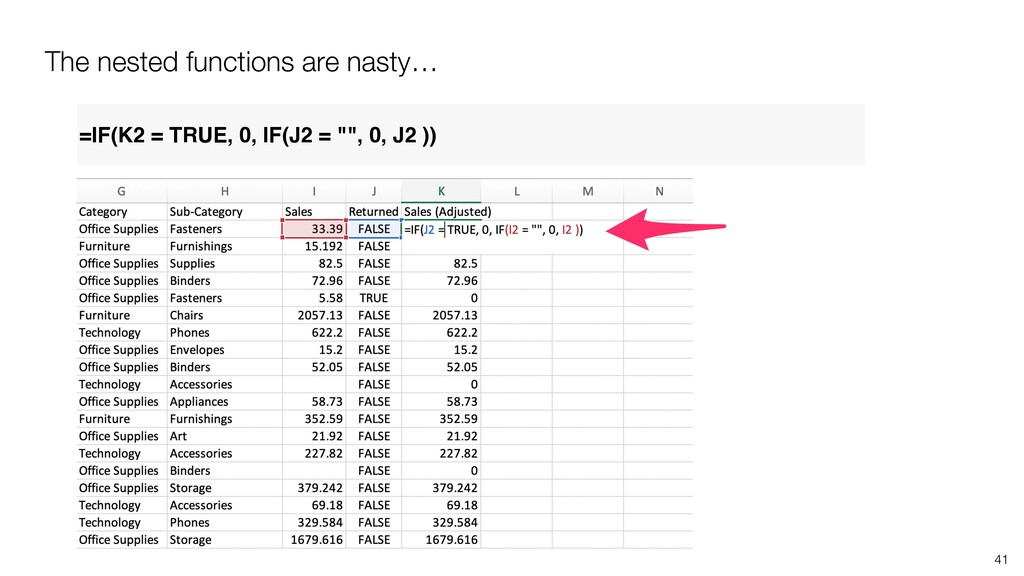
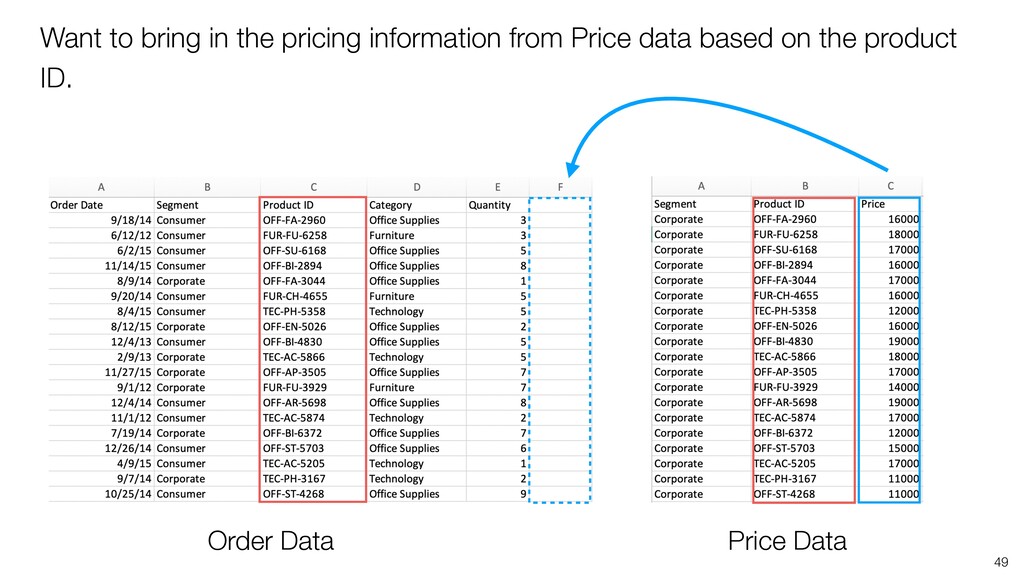
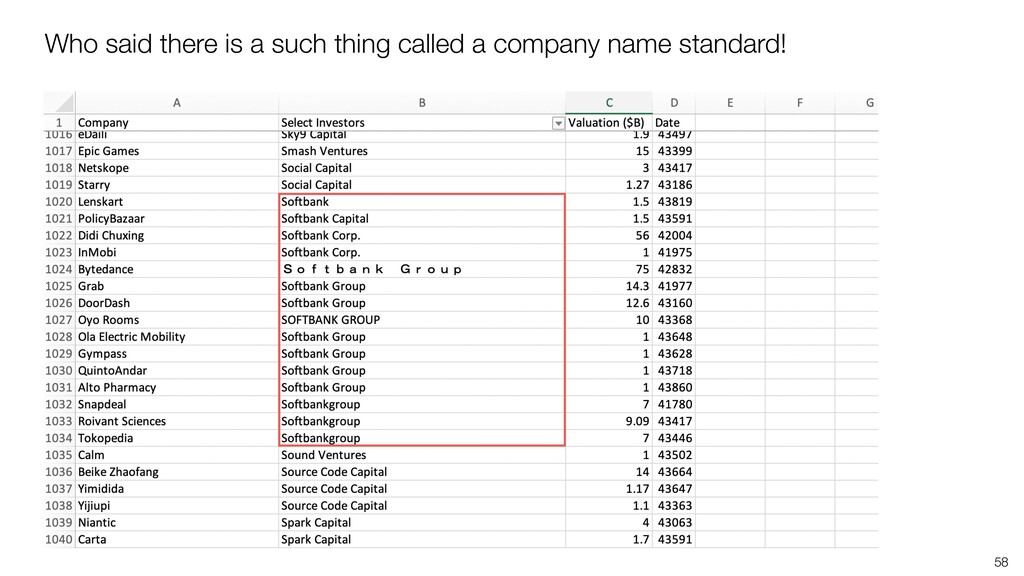
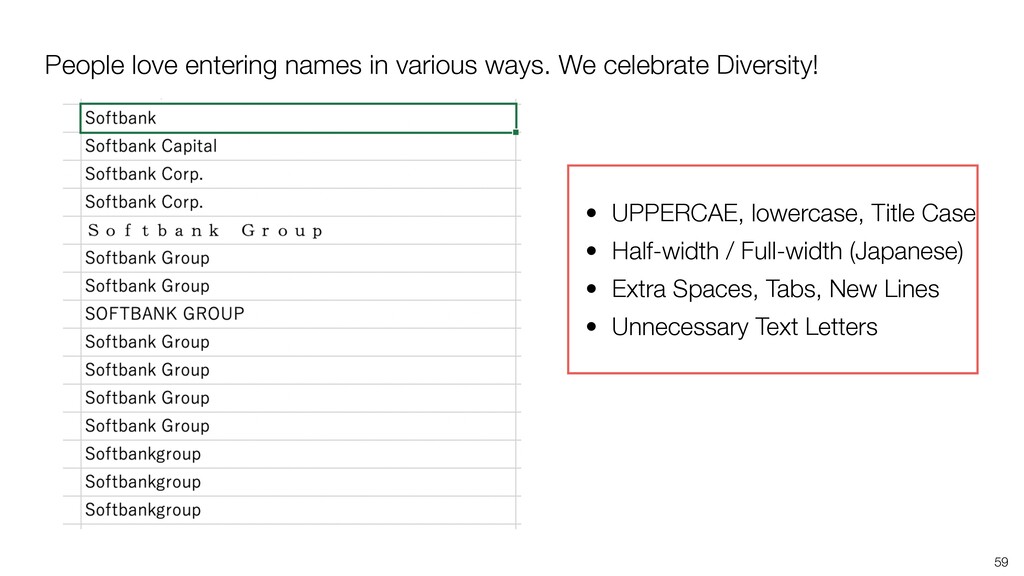
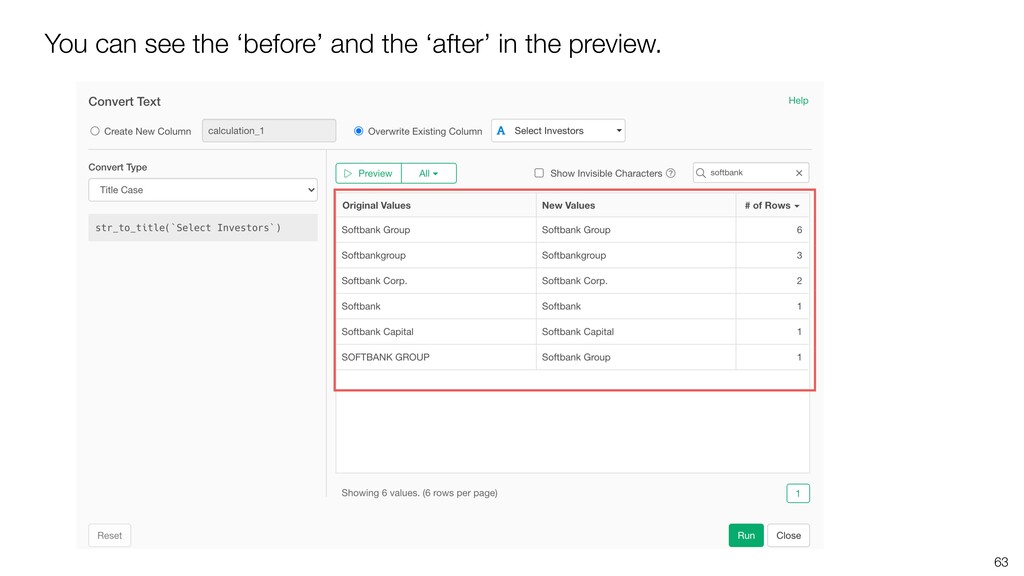
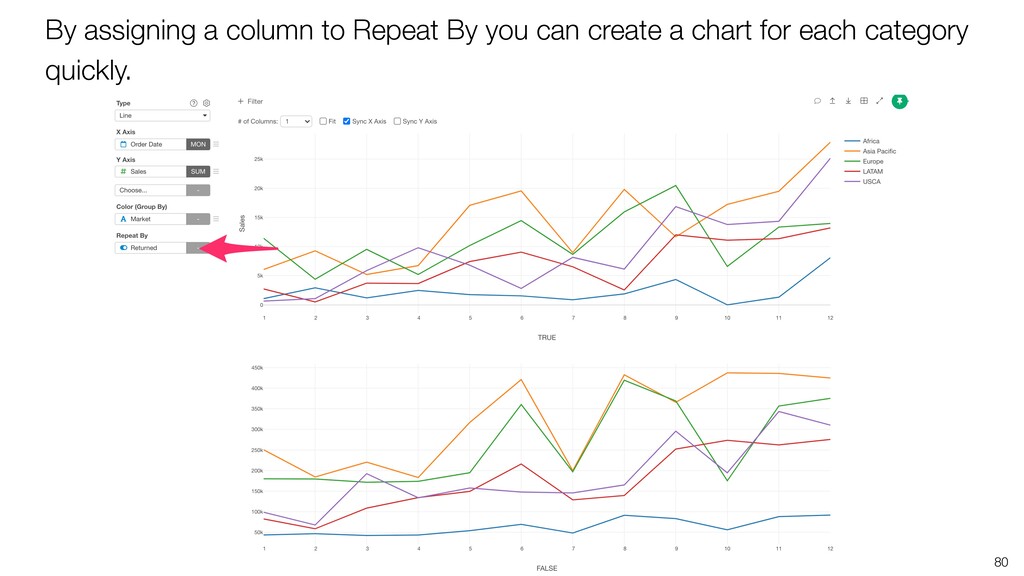
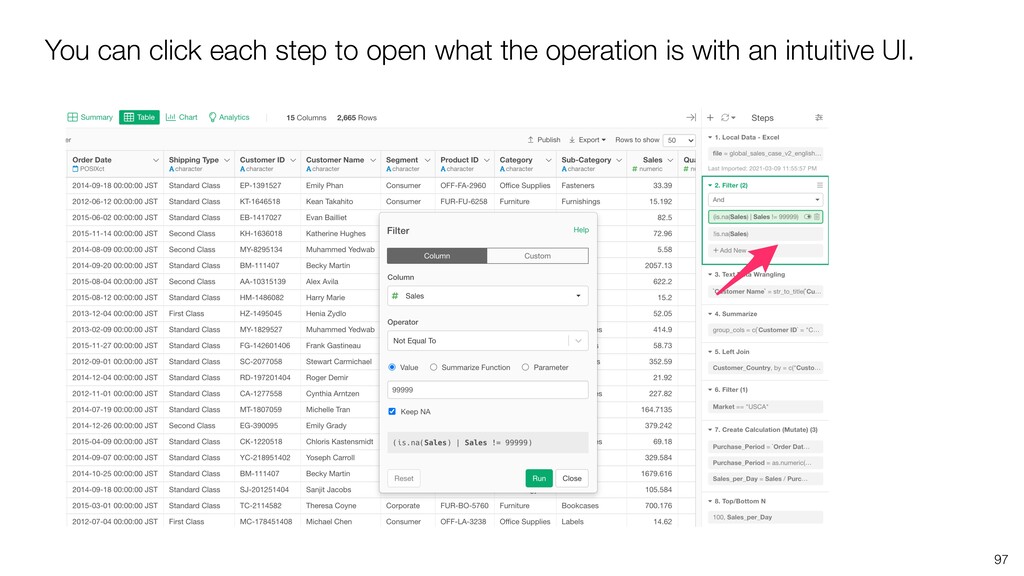
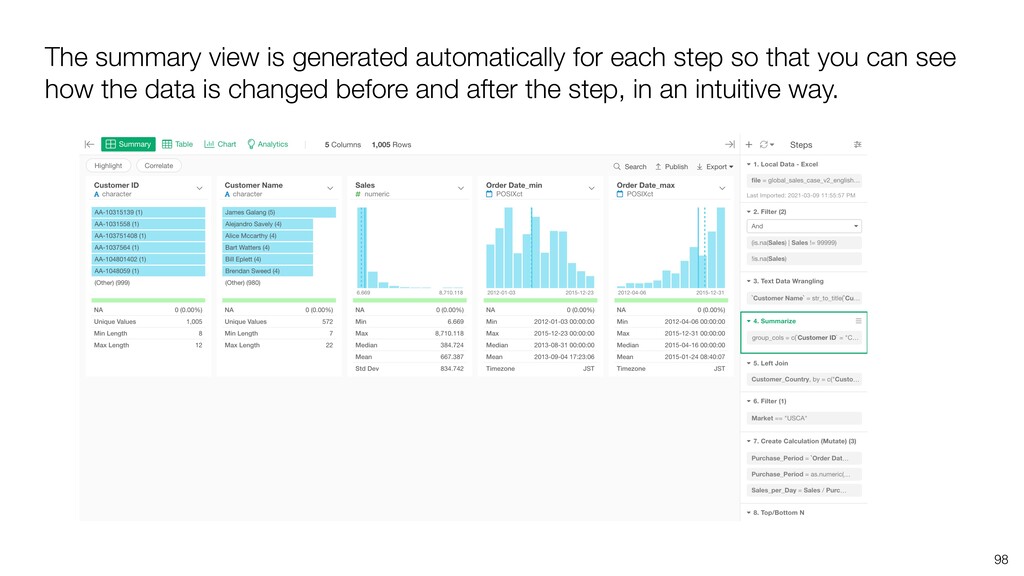
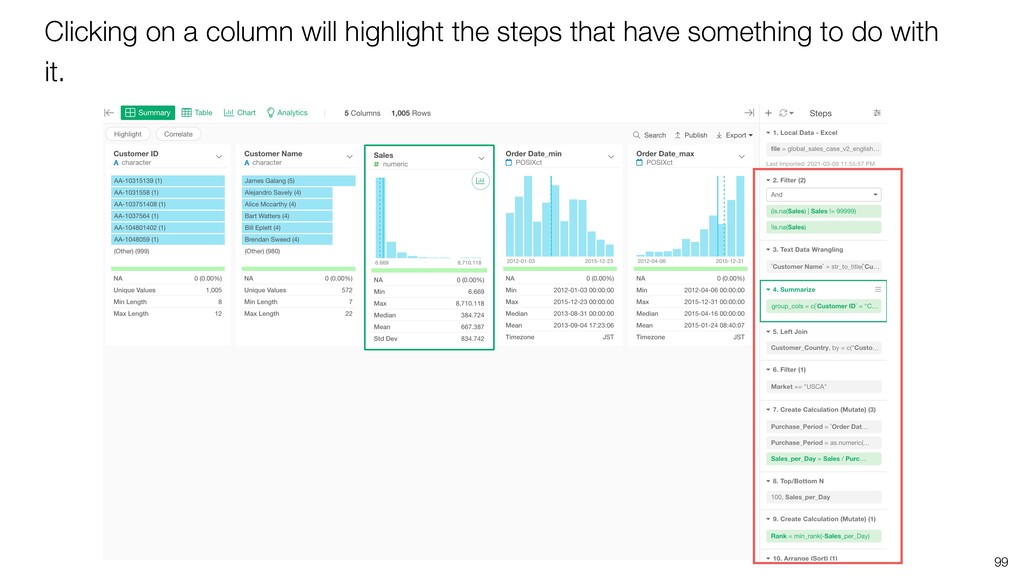
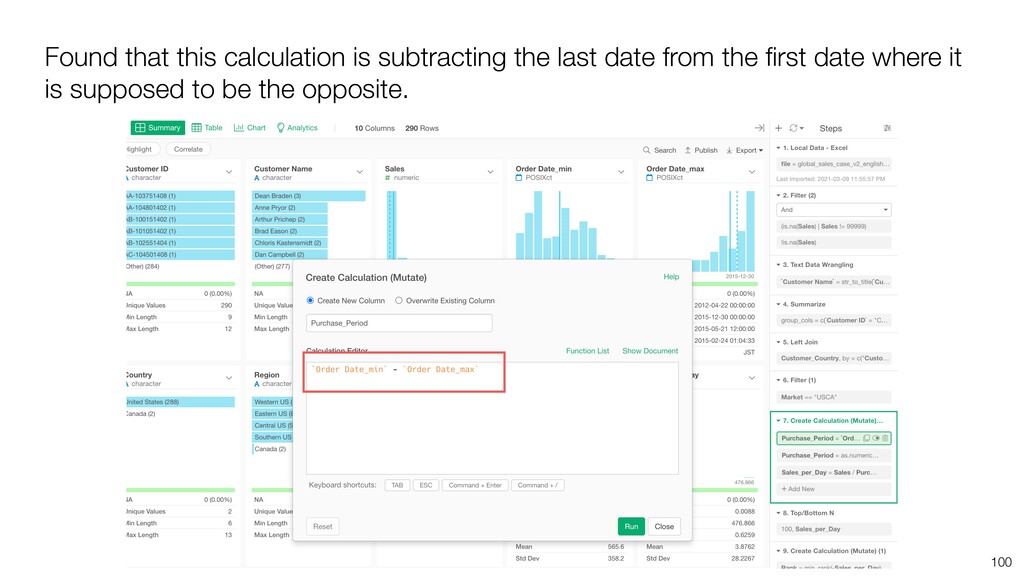
* Lack of Intuitive Understanding
* Lack of Analytical Capability
* Reproducibility for Reporting
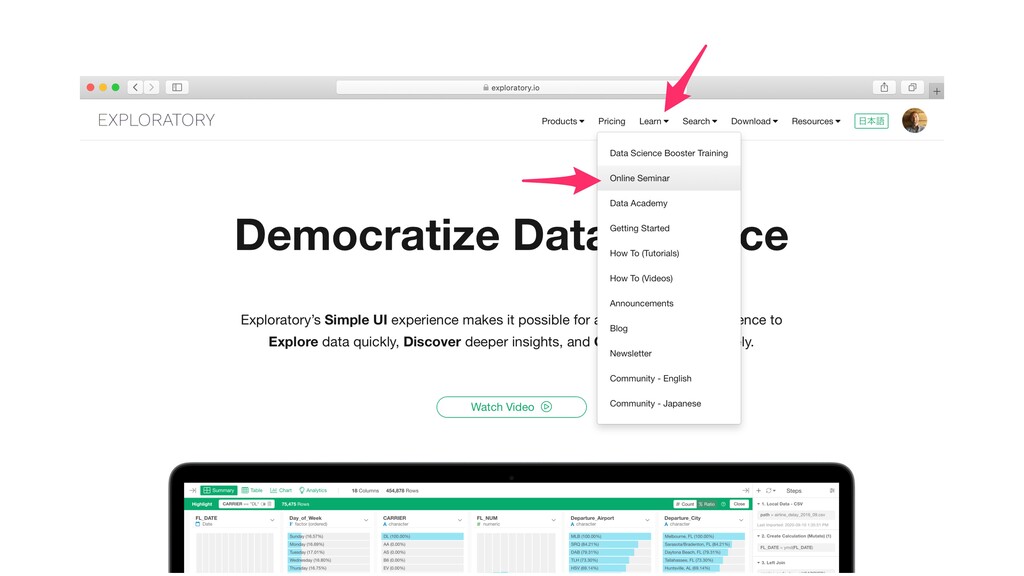
UI Tool: Exploratory(https://exploratory.io/)
Exploratory Online Seminar: https://exploratory.io/online-seminar
![Information Email [email protected] Website https://exploratory.io Twitter @ExploratoryData Seminar https://exploratory.io/online-seminar](https://files.speakerdeck.com/presentations/80f0475b1c3d40878b78d37e25b385da/slide_139.jpg)