Upgrade to Pro — share decks privately, control downloads, hide ads and more …

Kafka broker performance degradation by mysterious JVM pause @ TWJUG

Yuto Kawamura
September 05, 2019

Kafka broker performance degradation by mysterious JVM pause @ TWJUG

Yuto Kawamura

September 05, 2019
Tweet

More Decks by Yuto Kawamura

Other Decks in Technology

Transcript

  1. About speaker — Name: Yuto Kawamura — Role: Lead of

    team providing company-wide Kafka platform @ LINE — Reliability/Performance engineering + Development for Kafka clusters receiving over 260 billion messages / day — Pubs: — Kafka Summit 2017 6 — Kafka Summit 2018 7 — LINE DEVELOPER DAY 2018 8 — ❤ ۝㟨 8 https://gist.github.com/kawamuray/ a27aaa2d0668d0050537651978735321#file-kprobe_delay-c 7 https://kafka-summit.org/sessions/kafka-multi-tenancy-160-billion- daily-messages-one-shared-cluster-line/ 6 https://kafka-summit.org/sessions/single-data-hub-services-feed-100- billion-messages-per-day/
  2. Apache Kafka — Middleware for streaming data — High-scalability/High- performance

    — Default data persistency — Pub-Sub model for distributing data — Written in Scala (server), run on JVM
  3. Kafka at LINE — As data pipeline between services —

    As queueing service between webapp and async task processor
  4. Over 60 services at LINE using our Kafka for their

    service — LINE (messaging) — LINE Ads Platform — Timeline — LINE Pay — LINE TODAY — ... and more
  5. Scale and performance Messages inflow 260 billion /day Data size

    inflow 210TB /day Target response time 99th %ile < 40ms
  6. Phenomenon — Response time degradation for 99th %ile Produce —

    Violates our SLO : 99th %ile Produce < 40ms — Drop out from cluster expiring Zookeeper session timeout
  7. Observation: Threads utilization increase — Graph is showing threads "idle

    ratio" so util is reverse — For all of their threads
  8. Observation: GC time (STW) increase 2019-05-13T01:42:44.936+0900: 1423318.149: Total time for

    which application threads were stopped: 1.1904424 seconds, Stopping threads took: 1.1883390 seconds
  9. "Stopping threads" part rarely increases 1 — "safepoint" = Moments

    in JVM that it stops all app threads to safely execute unsafe ops (GC, jstack, etc...) — "safepoint sync" = Moments that JVM is waiting all threads to voluntarily enter pause 1 http://psy-lob-saw.blogspot.com/2015/12/safepoints.html
  10. Suspect 1 - Long-running JIT compiled code without safepoint poll

    — Even below simple nested integer loop can prohibit safepoint sync when it runs as JIT compiled code 1 — "safepoint poll" is performed at loop edge in C1/C2 compiled code — however compiler removes "safepoint poll" on loop edge when loop is "counted" (= for (*int* i =...)) — Assuming integer loop to quit reasonably fast ... long l = 0; for (int i = 0; i < Integer.MAX_VALUE; i++) { for (int j = 0; j < Integer.MAX_VALUE; j++) { if ((j & 1) == 1) l++; } } System.out.println("How Odd:" + l); ... } 1 http://psy-lob-saw.blogspot.com/2015/12/safepoints.html
  11. Capture jstack during long safepoint-sync — Inspect what compiled code

    does JVM running on long safepoint-sync — Monitor JVM process's mprotect(2) syscall — It enables memory protection of the same address whenever enabling safepoint — If N seconds elapsed since entering safepoint, jstack -F — Can't take normal jstack because jstack itself requires safepoint
  12. Inspect source Java code of JIT compiled code at address

    — It's easy to do this for JDK >= 9 : jcmd <pid> Compiler.codelist — but it's not available for JDK 8 :( ... well make it by myself. public class NMPrint extends Tool { ... public void run() { Debugger dbg = getAgent().getDebugger(); CodeCache codeCache = VM.getVM().getCodeCache(); Address address = dbg.parseAddress(this.address); CodeBlob blob = codeCache.findBlobUnsafe(address); blob.print(); } ... }
  13. Successfully got it $ java -cp foobar-1.0-SNAPSHOT-all.jar:$JAVA_HOME/lib/sa-jdi.jar NMPrint \ 0x00007f9af1d0007a

    $KAFKA_PID Attaching to process ID 162194, please wait... Debugger attached successfully. Server compiler detected. JVM version is 25.66-b17 NMethod for sun/nio/ch/EPollArrayWrapper.epollWait(JIJI)I content: [0x00007f9af1cfffc0, 0x00007f9af1d001b0), code: [0x00007f9af1cfffc0, 0x00007f9af1d001b0), data: [0x00007f9af1d001b0, 0x00007f9af1d001b0), oops: [0x00007f9af1d001b0, 0x00007f9af1d001b0), frame size: 80
  14. however then ... Found different type of logs which doubts

    above hypothesis :( 2019-05-13T20:02:48.559+0900: 1489321.772: Total time for which application threads were stopped: 2.2660103 seconds, Stopping threads took: 0.0001917 seconds => Long pause with short "Stopping threads" part
  15. Suspect 2 - IO blocking inside safepoint Long-running safepoint sync

    + Slow response time from disks = JVM performs slow IO inside safepoint sync/ operation ...? — At this point we were aware of that our machine's RAID controller likely has a performance problem
  16. Suspecting GC logging - Does (append) write(2) blocks? It's true

    sometimes but false for the most cases. — write(2) just enables "dirty flag" of the page — Kernel's background task periodically "writeback" dirty pages into block devices => Normally calling write(2) is just about copying memory
  17. Measure write(2) system call's duration Using SystemTap script2. Sun May

    19 00:32:03 2019,724 SYSCALL write from PID/TID 136422/136489 for FILE (snip)/kafka/kafkaServer-gc_2019-04-26_14-20-46.log.1.current took 2843 ms Returning from: 0xffffffffxxxxxxxx : sys_write+0x0/0xb0 [kernel] Returning to : 0xffffffffxxxxxxxx : tracesys+0xd9/0xde [kernel] 0x331fcdb7ed : __write_nocancel+0x24/0x57 [/lib64/libc-2.12.so] 0x331fc71943 : _IO_file_write@@GLIBC_2.2.5+0x43/0xa0 [/lib64/libc-2.12.so] 0x331fc72ef5 : _IO_do_write@@GLIBC_2.2.5+0x95/0x12a [/lib64/libc-2.12.so] 0x331fc720f8 : _IO_file_sync@@GLIBC_2.2.5+0xb8/0xc0 [/lib64/libc-2.12.so] 0x331fc6680a : _IO_fflush+0x6a/0xf7 [/lib64/libc-2.12.so] 0x7f6848c4fee8 : _ZN18ReferenceProcessor29process_discovered_referencesEP17BoolObjectClosure P10OopClosureP11VoidClosureP27AbstractRefProcTaskExecutorP7GCTimer4GCId+0x88/0x2c0 [/usr/jdk1.8.0_66/jre/lib/amd64/server/libjvm.so] 0x7f684886443d : _ZN15G1CollectedHeap29process_discovered_referencesEj+0x28d/0x750 [/usr/jdk1.8.0_66/jre/lib/amd64/server/libjvm.so] (snip) 0x7f6848d835be : _ZN8VMThread4loopEv+0x1ce/0x5d0 [/usr/jdk1.8.0_66/jre/lib/amd64/server/libjvm.so] 0x7f6848d83a30 : _ZN8VMThread3runEv+0x70/0x1b0 [/usr/jdk1.8.0_66/jre/lib/amd64/server/libjvm.so] 0x7f6848bdec68 : _ZL10java_startP6Thread+0x108/0x210 [/usr/jdk1.8.0_66/jre/lib/amd64/server/libjvm.so] 0x3320007aa1 : start_thread+0xd1/0x3d4 [/lib64/libpthread-2.12.so] 0x331fce8bcd : __clone+0x6d/0x90 [/lib64/libc-2.12.so] 2 https://gist.github.com/kawamuray/a27aaa2d0668d0050537651978735321#file-slow-syswrite-stp
  18. Checking OpenJDK's source code Indeed calling write(2) through flush inside

    safepoint: # referenceProcessor.cpp ReferenceProcessorStats ReferenceProcessor::process_discovered_references( (snip) { GCTraceTime tt("SoftReference", trace_time, false, gc_timer, gc_id); soft_count = process_discovered_reflist(_discoveredSoftRefs, _current_soft_ref_policy, true, is_alive, keep_alive, complete_gc, task_executor); } ... # gcTraceTime.cpp GCTraceTime::~GCTraceTime() { (snip) gclog_or_tty->flush();
  19. So our premise had broken... Even write(2) for appending write

    can blocks. Then are we ready to start considering solution?
  20. Not YET — We don't know why write(2) can block

    occasionally — Without knowing what's going on underneath, we might take wrong option => Try stack sampling when experiencing slow write(2)
  21. However... 1. We had to service out the broker from

    problematic machine because performance was getting worse daily 2. The problematic machine's partially-broken HDD has been replaced accidentally by maintenance — I made a kernel crash => Ask hard reboot => "Replaced broken HDD at that same time :)"
  22. Lost the reproducible environment... but never give up! Reproduce write

    workload: tiny C program3 with measuring write(2) call duration. (snip) while (1) { if (clock_gettime(CLOCK_MONOTONIC, &t0) == -1) { perror("clock_gettime"); continue; } written = write(fd, content, sizeof(content)); if (clock_gettime(CLOCK_MONOTONIC, &te) == -1) { perror("clock_gettime"); continue; } (snip) 3 https://gist.github.com/kawamuray/a27aaa2d0668d0050537651978735321#file-justwrite-c
  23. Reproduce slow response from disk — Disk slowing down !=

    write(2) slowing down — We're now investigating why write(2) slows down! — Attempted to hook generic_make_request4 and inject delay to simulate slow disk with SystemTap — but failed... well SystemTap is designed for guaranteeing safe-overhead execution $ stap ... -e 'probe ioblock.request { for (i = 0; i < 2147483647; i++) { for (j = 0; j < 2147483647; j++) { pl |= 1 ^ 255 } } }' -D STP_NO_OVERLOAD -D MAXACTION=-1 (snip) ERROR: MAXACTION exceeded near identifier 'target' at /usr/share/systemtap/tapset/linux/context.stp:380:10 Pass 5: run completed in 0usr/30sys/914real ms. Pass 5: run failed. [man error::pass5] 4 A generic gateway function in Linux source code for issueing IO request for block devices
  24. ! Use kprobe directly writing kernel module 8 kprobe =

    Linux kernel API that provides capability to hook arbitrary function's enter/return and insert code (SystemTap uses this as a backend) static struct kprobe kp = { .symbol_name = "generic_make_request", }; (snip) static int handler_pre(struct kprobe *p, struct pt_regs *regs) { (snip) if (biop->bi_rw & WRITE && bio_rw_flagged(biop, BIO_RW_SYNCIO) && MAJOR(devn) == TARGET_MAJOR && MINOR(devn) == TARGET_MINOR) { if (sampling++ % 3 == 0) { printk(KERN_INFO "throttling\n"); mdelay(300); (snip) static int __init kprobe_init(void) { (snip) kp.pre_handler = handler_pre; ret = register_kprobe(&kp); 8 https://gist.github.com/kawamuray/a27aaa2d0668d0050537651978735321#file-kprobe_delay-c
  25. Successfully reproduced and gotcha! — Found that [jbd2/sda3-8] kernel task

    (ext4's journaling daemon) is blocked — but couldn't explain why it affects write(2)'s processing time... Pid: 4390, comm: jbd2/sda3-8 Not tainted ... Call Trace: (snip) [<ffffffffxxxxxxxx>] ? generic_make_request+0x1/0x5a0 <<EOE>> [<ffffffffxxxxxxxx>] ? submit_bio+0x70/0x120 [<ffffffffxxxxxxxx>] ? submit_bh+0x11d/0x1f0 [<ffffffffxxxxxxxx>] ? jbd2_journal_commit_transaction+0x598/0x14f0 [jbd2] (snip) [<ffffffffxxxxxxxx>] ? kjournald2+0x0/0x220 [jbd2] [<ffffffffxxxxxxxx>] ? kthread+0x9e/0xc0
  26. Try approaching from another side Breakdown source of latency in

    write(2)'s callgraph. Using another SystemTap script5. probe %(probepoints_entry)s { if (in_rec()) { frmid = alloc_frame_id() entry_times[tid(), frmid] = gettimeofday_us() (snip) probe %(probepoints_return)s { if (in_rec()) { frmid = dealloc_frame_id() tin = entry_times[tid(), frmid] tout = gettimeofday_us() elapsed = tout - tin durations[tid()] .= sprintf(",%%s=%%d(in: %%d, out: %%d)", frmid, elapsed, tin, tout) 5 https://gist.github.com/kawamuray/a27aaa2d0668d0050537651978735321#file-drilldown-latency-py
  27. Adding suspicious part one-by-one (reading kernel source)... ./ddown..py ... 'vfs_write,do_sync_write,ext4/ext4_file_write,generic_file_ai

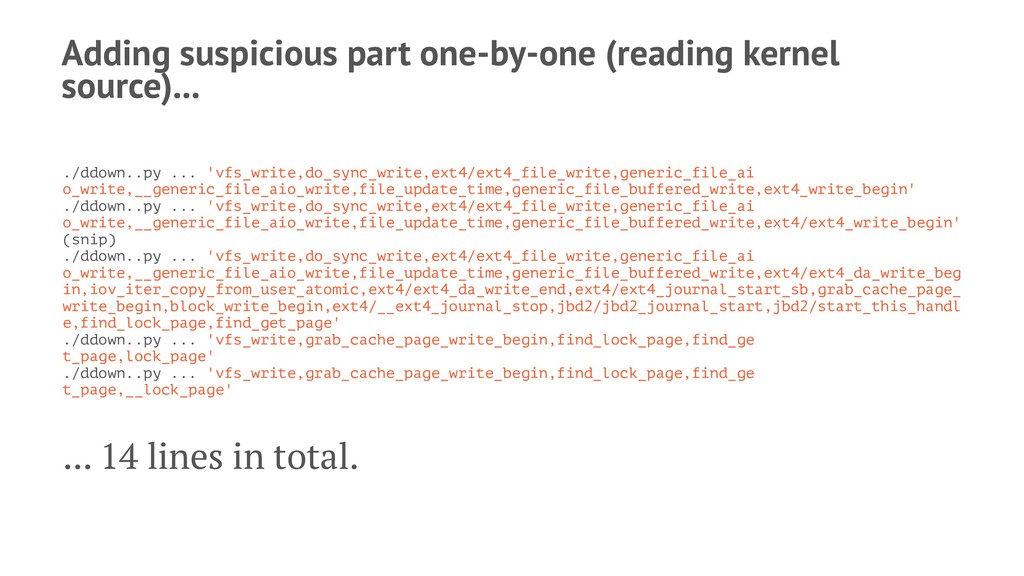
    o_write,__generic_file_aio_write,file_update_time,generic_file_buffered_write,ext4_write_begin' ./ddown..py ... 'vfs_write,do_sync_write,ext4/ext4_file_write,generic_file_ai o_write,__generic_file_aio_write,file_update_time,generic_file_buffered_write,ext4/ext4_write_begin' (snip) ./ddown..py ... 'vfs_write,do_sync_write,ext4/ext4_file_write,generic_file_ai o_write,__generic_file_aio_write,file_update_time,generic_file_buffered_write,ext4/ext4_da_write_beg in,iov_iter_copy_from_user_atomic,ext4/ext4_da_write_end,ext4/ext4_journal_start_sb,grab_cache_page_ write_begin,block_write_begin,ext4/__ext4_journal_stop,jbd2/jbd2_journal_start,jbd2/start_this_handl e,find_lock_page,find_get_page' ./ddown..py ... 'vfs_write,grab_cache_page_write_begin,find_lock_page,find_ge t_page,lock_page' ./ddown..py ... 'vfs_write,grab_cache_page_write_begin,find_lock_page,find_ge t_page,__lock_page' ... 14 lines in total.
  28. Found it's waiting on lock sys_write took 3890322 us in

    total:, find_get_page=1, __lock_page=3890280, find_lock_page=3890290, grab_cache_page_write_begin=3890294, vfs_write=3890317
  29. Analyzing lock contention Hooking lock acquisition/release points: __lock_page and unlock_page.

    Figured out that it's cascading issue: [processing calling write(2)] -> [flush-8:0] writeback task (waiting page lock) -> [jbd2/sda3-8] journaling daemon (waiting journal_head's buffer state)
  30. Solution? — Use other fs or disable journaling — Use

    tmpfs as a 1st storage for GC logs with real-time persistent backup java ... -Xgclog=/path/to/tmpfs # in background tail -F /path/to/tmpfs/gclog-latest > /path/to/persistent/gclog-current # also in scheduled job jcmd to roll gclog in reasonably short moment (like 1 hour) to prevent tmpfs filled up
  31. Summary — When (at least) below conditions are met, write(2)

    can (very rarely) blocks — Using ext4 (maybe other journaling fs too) as FS — Underlying disk partially broken and responding slowly — Assuming appending-write(2) to be non-blocking is, — still safe for normal applications — not safe for performance critical part of application affects widely (e.g, JVM's safepoint)