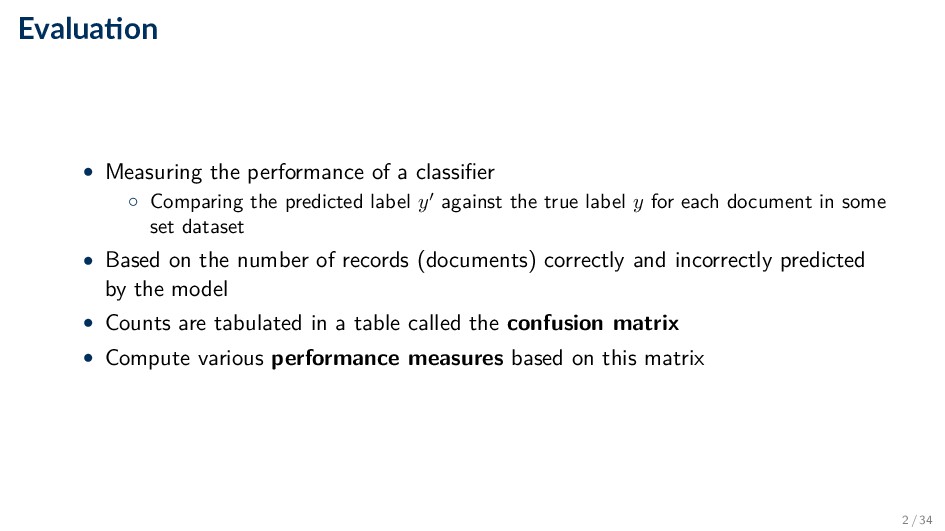
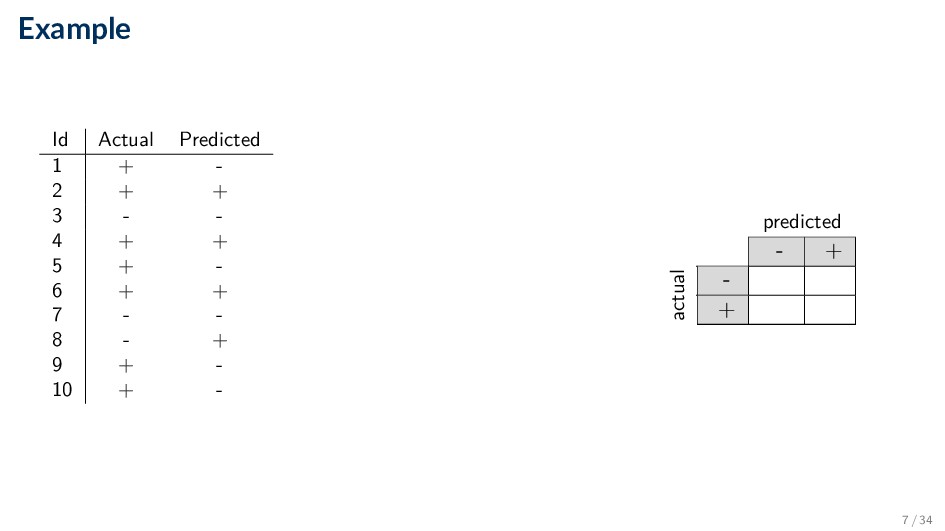
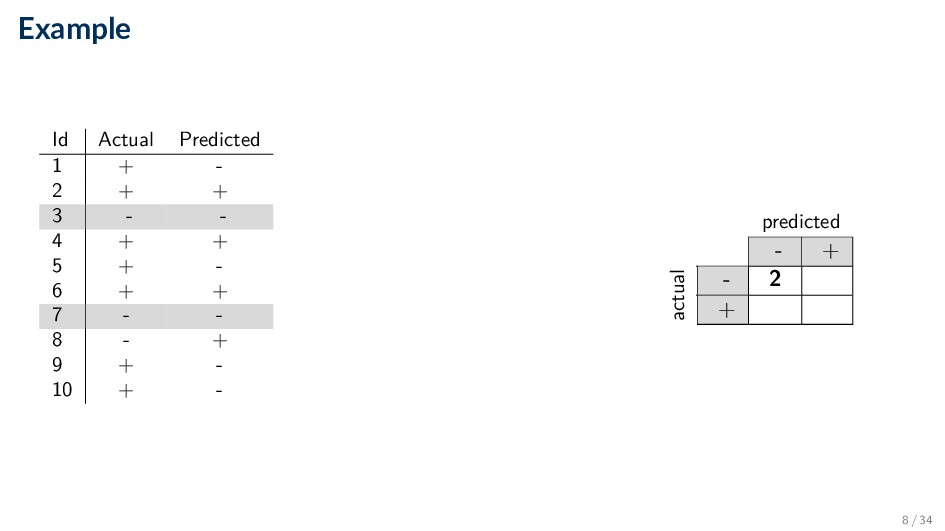
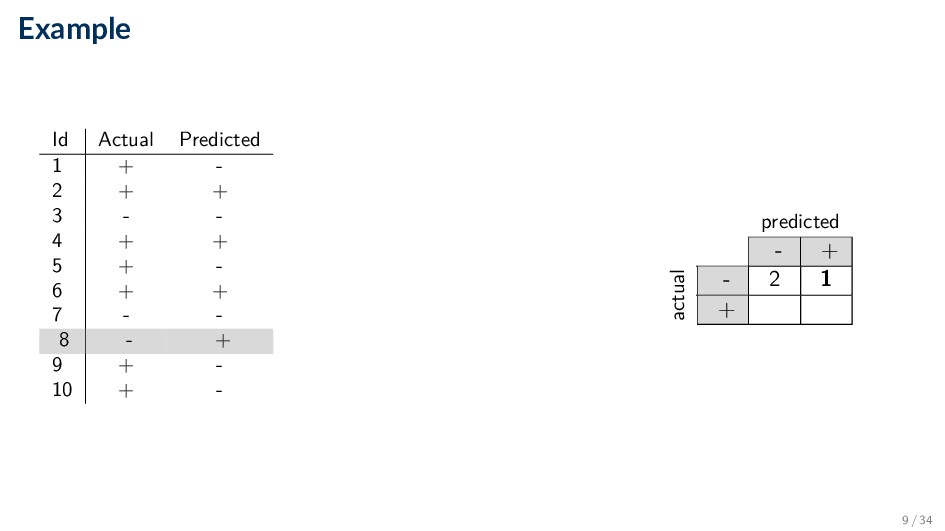
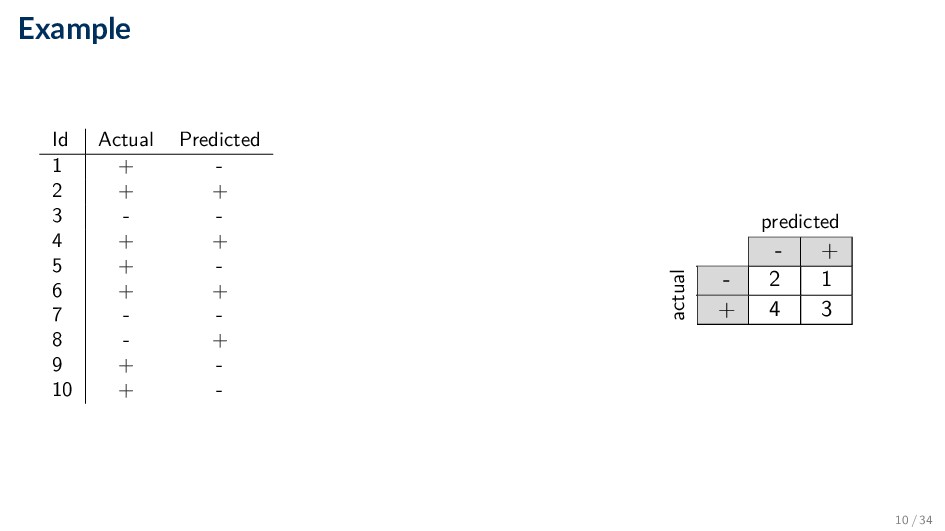
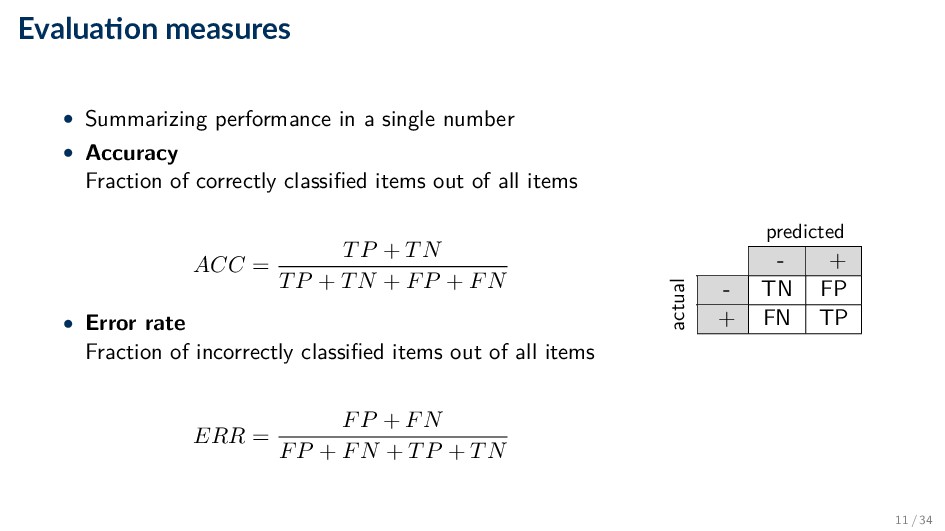
Comparing the predicted label y against the true label y for each document in some set dataset • Based on the number of records (documents) correctly and incorrectly predicted by the model • Counts are tabulated in a table called the confusion matrix • Compute various performance measures based on this matrix 2 / 34
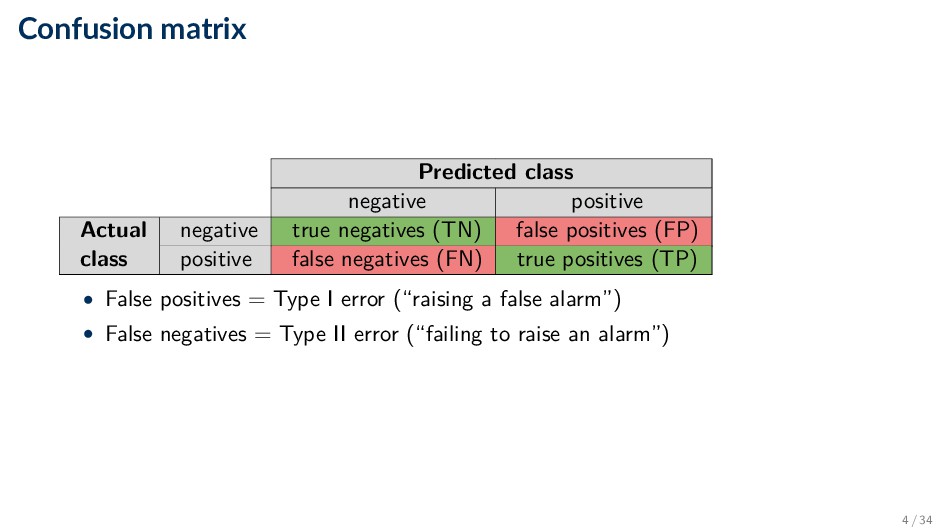
(TN) false positives (FP) class positive false negatives (FN) true positives (TP) • False positives = Type I error (“raising a false alarm”) • False negatives = Type II error (“failing to raise an alarm”) 4 / 34
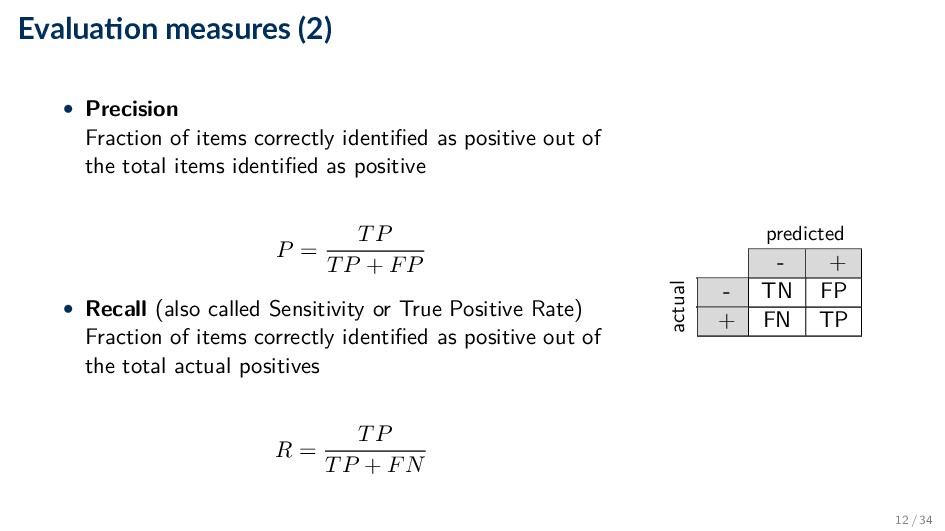
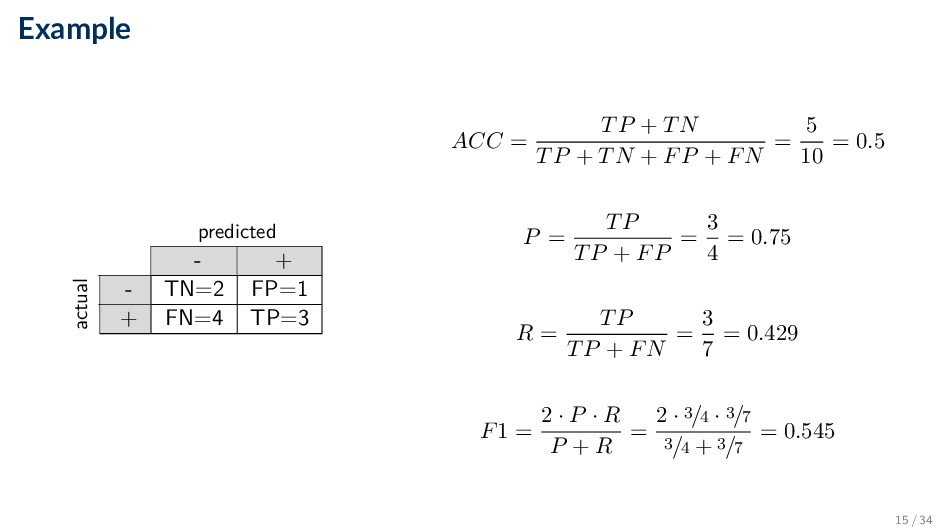
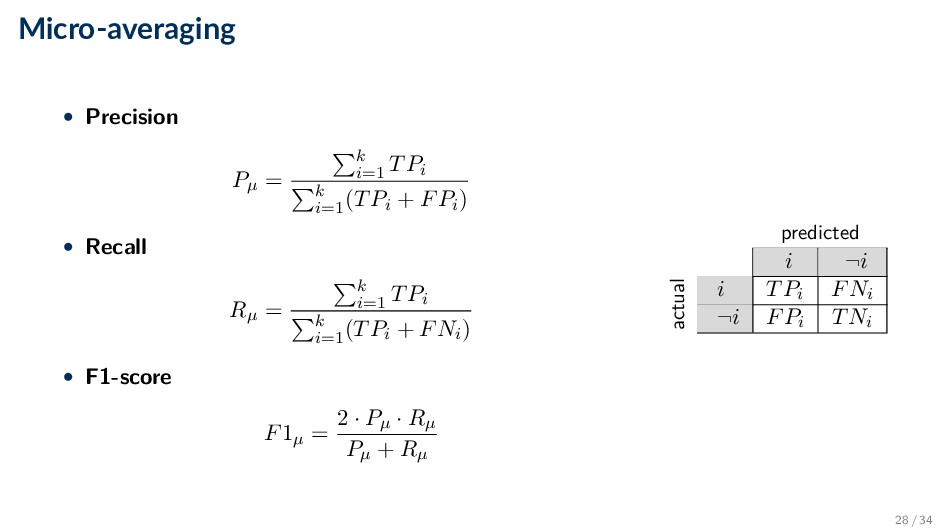
identified as positive out of the total items identified as positive P = TP TP + FP • Recall (also called Sensitivity or True Positive Rate) Fraction of items correctly identified as positive out of the total actual positives R = TP TP + FN predicted - + actual - TN FP + FN TP 12 / 34
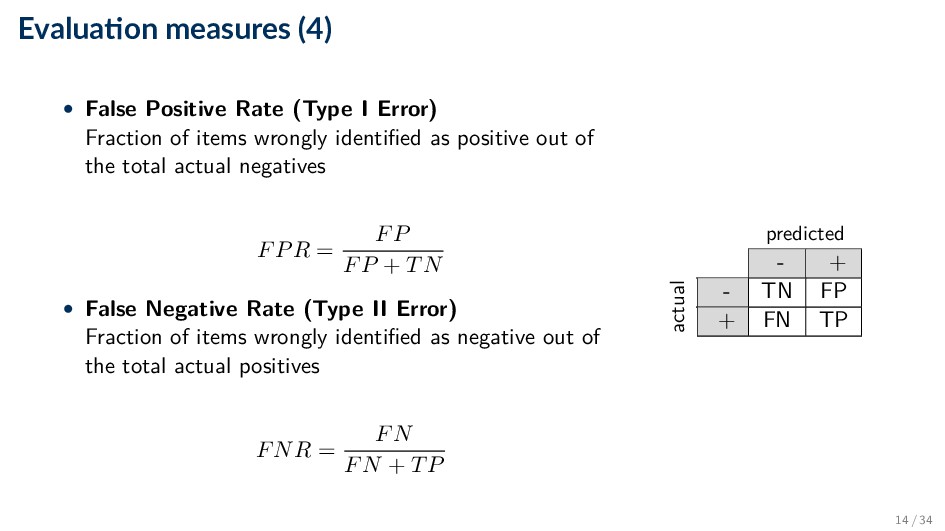
Error) Fraction of items wrongly identified as positive out of the total actual negatives FPR = FP FP + TN • False Negative Rate (Type II Error) Fraction of items wrongly identified as negative out of the total actual positives FNR = FN FN + TP predicted - + actual - TN FP + FN TP 14 / 34
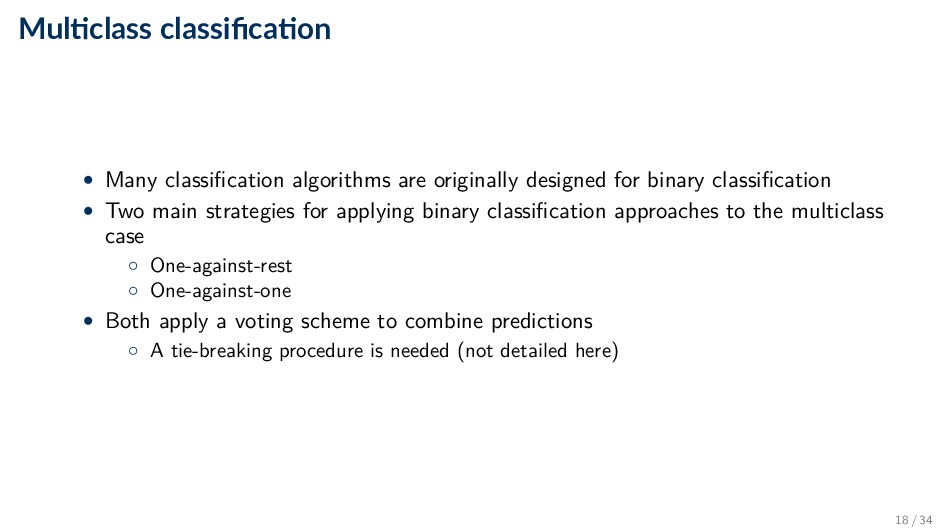
designed for binary classification • Two main strategies for applying binary classification approaches to the multiclass case ◦ One-against-rest ◦ One-against-one • Both apply a voting scheme to combine predictions ◦ A tie-breaking procedure is needed (not detailed here) 18 / 34
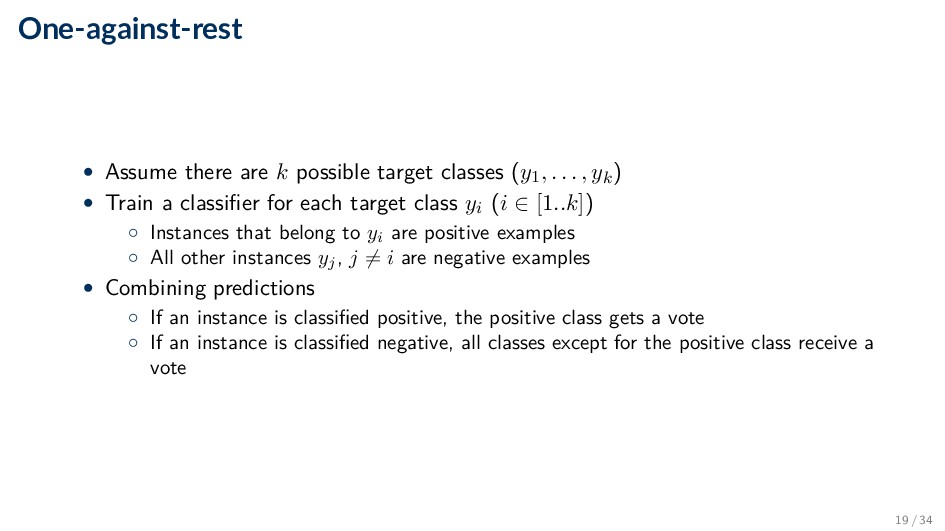
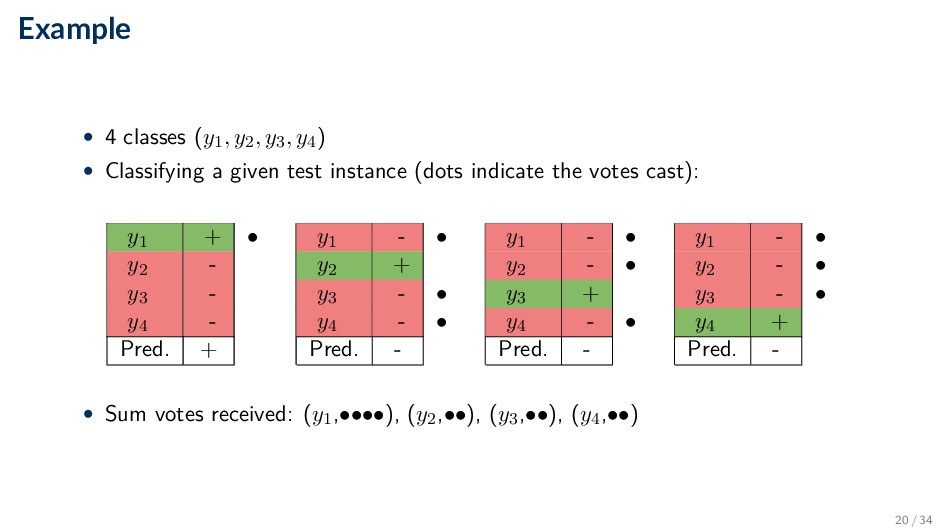
. . . , yk) • Train a classifier for each target class yi (i ∈ [1..k]) ◦ Instances that belong to yi are positive examples ◦ All other instances yj , j = i are negative examples • Combining predictions ◦ If an instance is classified positive, the positive class gets a vote ◦ If an instance is classified negative, all classes except for the positive class receive a vote 19 / 34
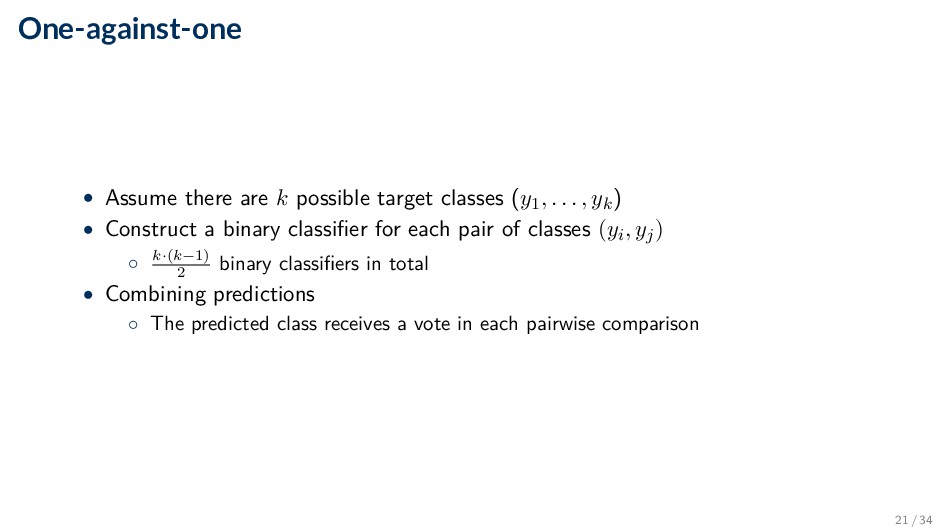
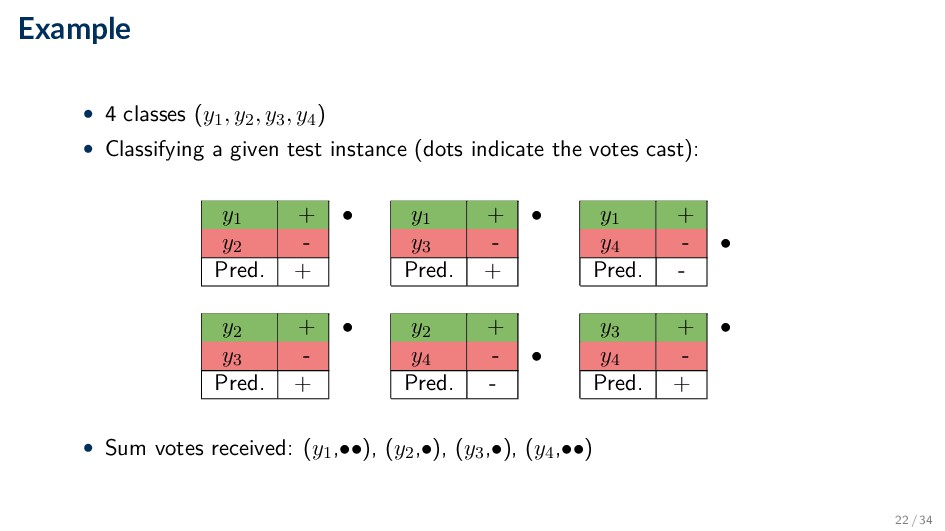
. . . , yk) • Construct a binary classifier for each pair of classes (yi, yj) ◦ k·(k−1) 2 binary classifiers in total • Combining predictions ◦ The predicted class receives a vote in each pairwise comparison 21 / 34
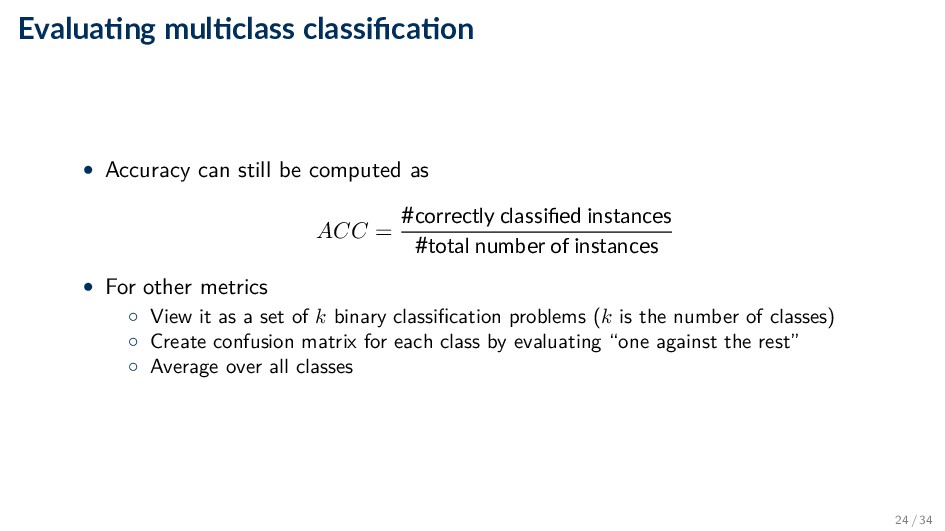
be computed as ACC = #correctly classified instances #total number of instances • For other metrics ◦ View it as a set of k binary classification problems (k is the number of classes) ◦ Create confusion matrix for each class by evaluating “one against the rest” ◦ Average over all classes 24 / 34
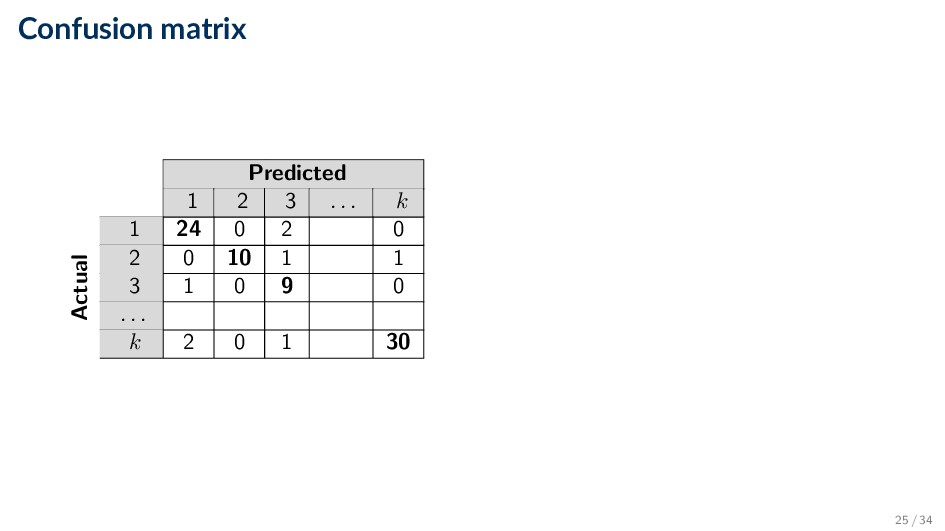
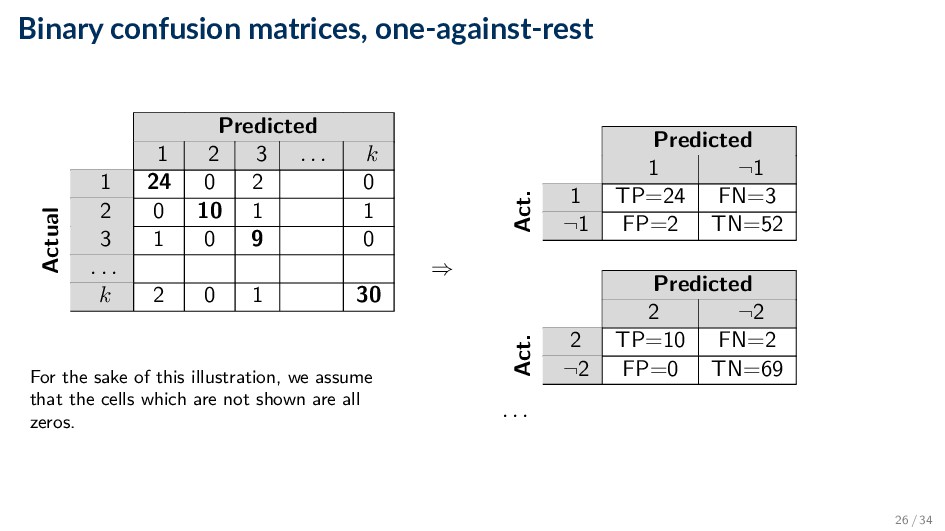
. k Actual 1 24 0 2 0 2 0 10 1 1 3 1 0 9 0 . . . k 2 0 1 30 For the sake of this illustration, we assume that the cells which are not shown are all zeros. ⇒ Predicted 1 ¬1 Act. 1 TP=24 FN=3 ¬1 FP=2 TN=52 Predicted 2 ¬2 Act. 2 TP=10 FN=2 ¬2 FP=0 TN=69 . . . 26 / 34
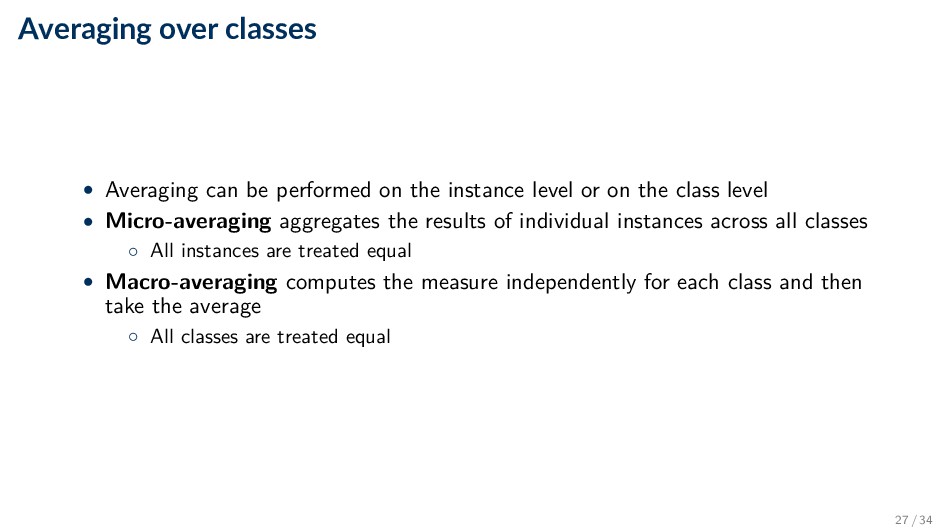
instance level or on the class level • Micro-averaging aggregates the results of individual instances across all classes ◦ All instances are treated equal • Macro-averaging computes the measure independently for each class and then take the average ◦ All classes are treated equal 27 / 34
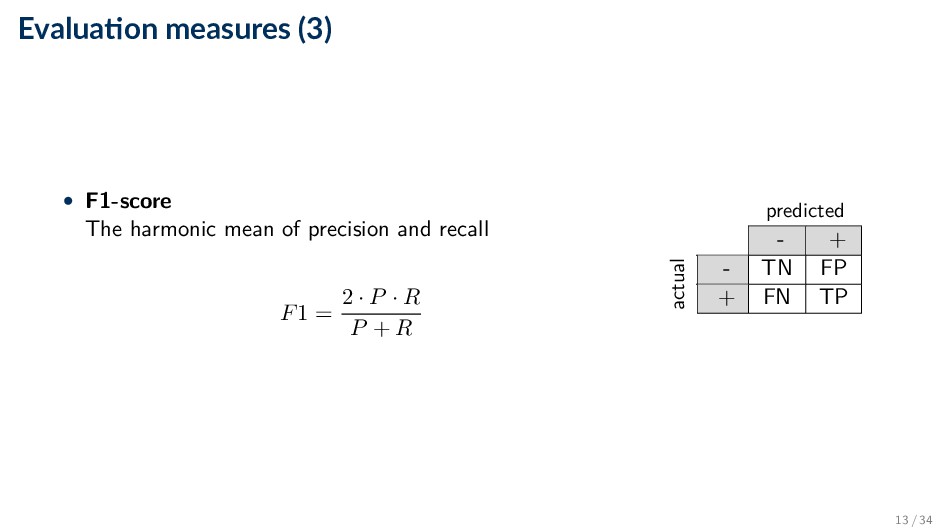
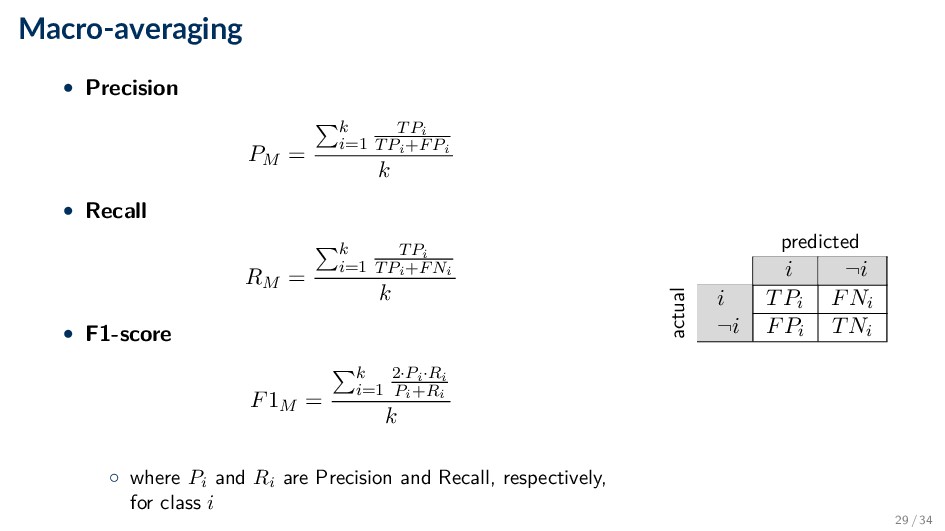
• Recall RM = k i=1 TPi TPi+FNi k • F1-score F1M = k i=1 2·Pi·Ri Pi+Ri k ◦ where Pi and Ri are Precision and Recall, respectively, for class i predicted i ¬i actual i TPi FNi ¬i FPi TNi 29 / 34
of the training data for testing into a validation set • Single train/validation split ◦ Split the training data into X% training split and 100 − X% validation split (an 80/20 split is common) 32 / 34
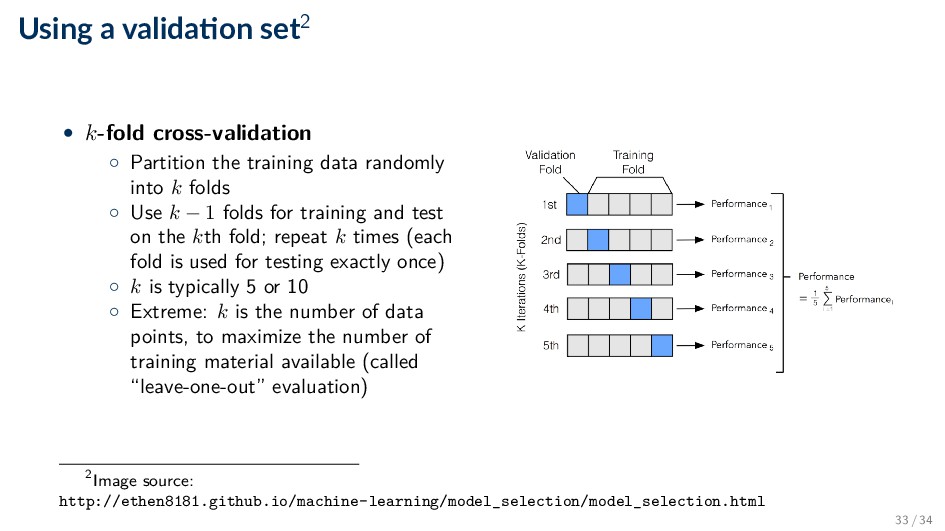
the training data randomly into k folds ◦ Use k − 1 folds for training and test on the kth fold; repeat k times (each fold is used for testing exactly once) ◦ k is typically 5 or 10 ◦ Extreme: k is the number of data points, to maximize the number of training material available (called “leave-one-out” evaluation) 2Image source: http://ethen8181.github.io/machine-learning/model_selection/model_selection.html 33 / 34
![Text Classifica on Evalua on [DAT640] Informa on Retrieval and](https://files.speakerdeck.com/presentations/c16cee8ca55e46159b9d88c619d154b1/slide_0.jpg)