the Cytoscape user interface. First of all we will look at the basic UI of Cytoscape. Then we will show all menu features of Cytoscape and the extended functionality provided by plugins. Cytoscape Layout and User Interface Launch Cytoscape. You should see a window that looks like this: • At the top of the Cytoscape Desktop window is the toolbar, which contains the command buttons. The name of each command button is shown when the mouse pointer hovers over it. • In the upper right is the Main Network View window, where network data will be displayed. This region is initially blank. • At left is the Control Panel (Network Management) Panel. This lists the available networks by name and provides information on the number of nodes and edges. • Immediately below the Control Panel is the Network Overview Pane • At lower right is the Data Panel which can be used to display node, edge, and network attribute data
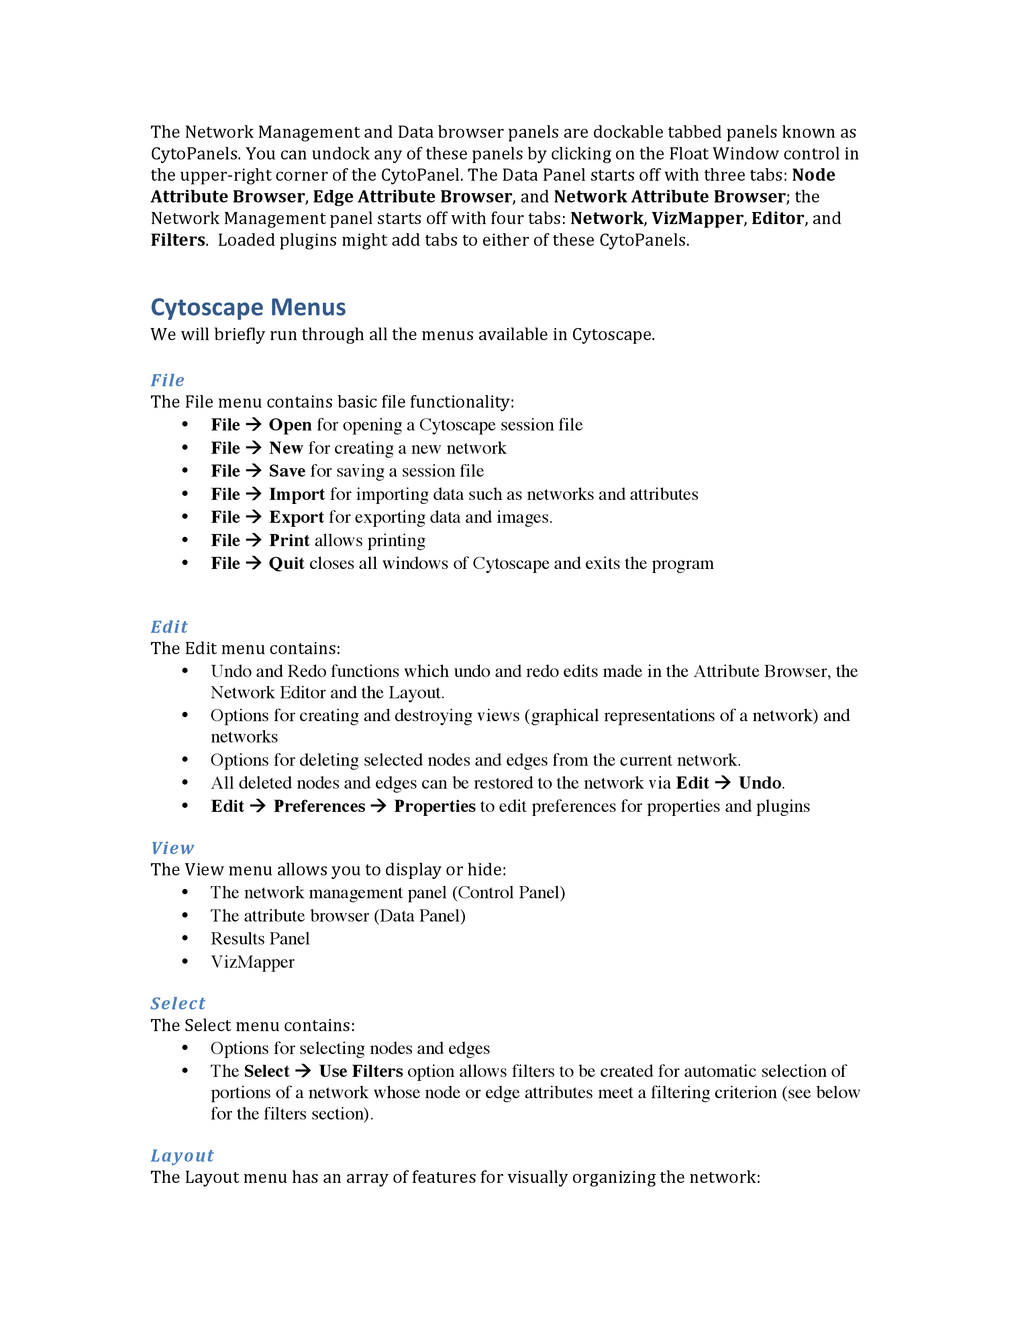
panels known as CytoPanels. You can undock any of these panels by clicking on the Float Window control in the upper-‐right corner of the CytoPanel. The Data Panel starts off with three tabs: Node Attribute Browser, Edge Attribute Browser, and Network Attribute Browser; the Network Management panel starts off with four tabs: Network, VizMapper, Editor, and Filters. Loaded plugins might add tabs to either of these CytoPanels. Cytoscape Menus We will briefly run through all the menus available in Cytoscape. File The File menu contains basic file functionality: • File à Open for opening a Cytoscape session file • File à New for creating a new network • File à Save for saving a session file • File à Import for importing data such as networks and attributes • File à Export for exporting data and images. • File à Print allows printing • File à Quit closes all windows of Cytoscape and exits the program Edit The Edit menu contains: • Undo and Redo functions which undo and redo edits made in the Attribute Browser, the Network Editor and the Layout. • Options for creating and destroying views (graphical representations of a network) and networks • Options for deleting selected nodes and edges from the current network. • All deleted nodes and edges can be restored to the network via Edit à Undo. • Edit à Preferences à Properties to edit preferences for properties and plugins View The View menu allows you to display or hide: • The network management panel (Control Panel) • The attribute browser (Data Panel) • Results Panel • VizMapper Select The Select menu contains: • Options for selecting nodes and edges • The Select à Use Filters option allows filters to be created for automatic selection of portions of a network whose node or edge attributes meet a filtering criterion (see below for the filters section). Layout The Layout menu has an array of features for visually organizing the network:
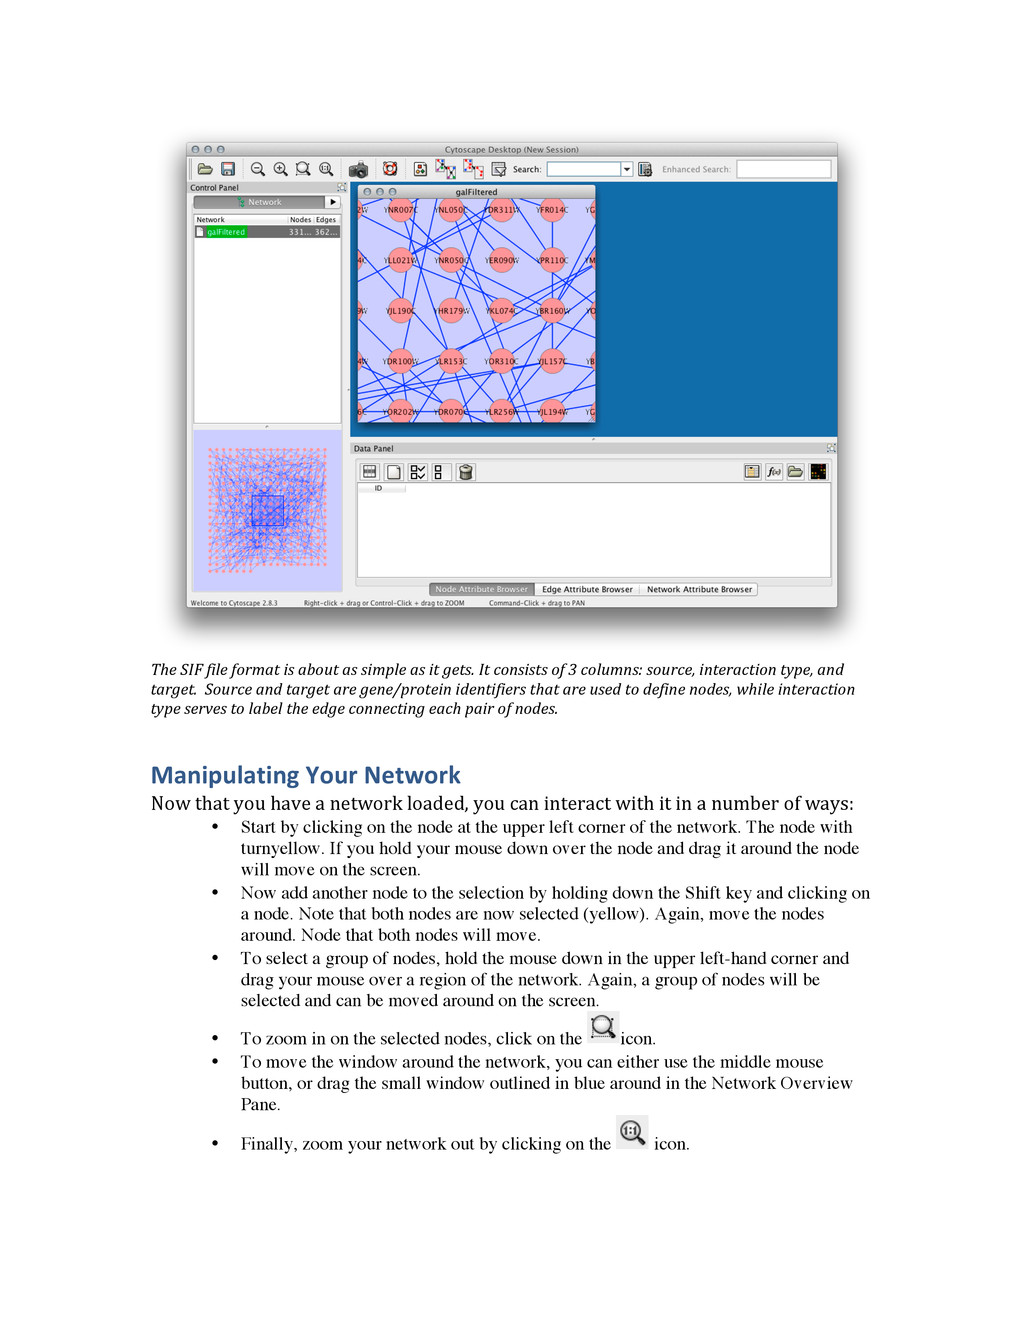
the network visualization. • The bottom section of the menu lists a variety of layout algorithms that automatically lay a network out. Plugins The Plugins menu contains options for managing your plugins (install/update/delete) and may have options added by plugins that have already been installed, such as the Agilent Literature Search or Merge Networks. • Depending on which plugins are loaded, the plugins that you see may be different than what appear here. Help • The Help menu allows you to launch the help viewer and browse the table of contents for this manual. • The About option displays information about the running version of Cytoscape. Loading a Simple Network • Go to File-> Import -> Network (multiple file types) • You should see the Import Network File Dialog • For Data Source Type select Local and then click Select • Open the sampleData folder and select galFiltered.sif and then click on Open and then Import You should see the following:
it gets. It consists of 3 columns: source, interaction type, and target. Source and target are gene/protein identifiers that are used to define nodes, while interaction type serves to label the edge connecting each pair of nodes. Manipulating Your Network Now that you have a network loaded, you can interact with it in a number of ways: • Start by clicking on the node at the upper left corner of the network. The node with turn
and difficult. However, you can specifically search for a node by name or attribute: • In the Search: box at the top of the screen, type in ynr050c. This will select that node and zoom the display to focus on it. The Search: box will also allow you to select nodes by other attributes, but first, we need to import more attributes... References [1]http://opentutorials.rbvi.ucsf.edu/index.php?title=Tutorial:Navigating_Cytoscape&ce_slide=tr ue&ce_style=Cytoscape [2]http://opentutorials.rbvi.ucsf.edu/index.php/File:Navigating_Cytoscape.pdf [3] http://cytoscape.wodaklab.org/wiki/CytoRetreat2007Tutorials
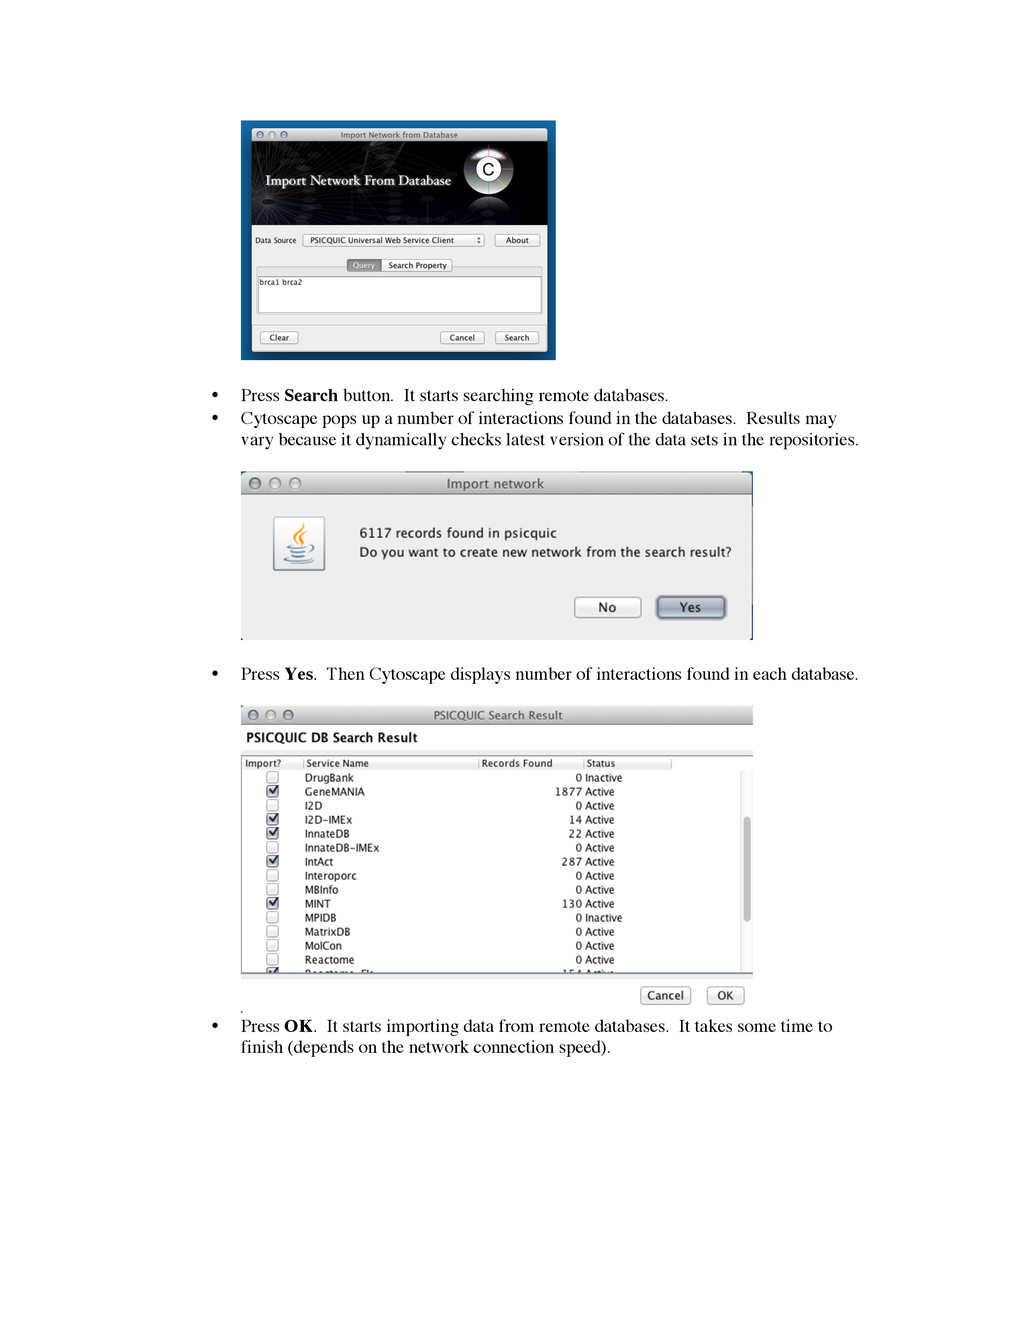
Like nucleotide sequences or protein structures, known molecular interactions and human-‐curated biological pathways are available as public database. Cytoscape can import those public data sets directly via network. In this tutorial, you will learn how to import interactions from public repositories. Install Necessary Plugins • Start Cytoscape • Under the Plugins menu, select Manage Plugins • In the Search dialog, type PSICQUIC • Find PSICQUICUniversalClient plugin and if it is not already installed, click the Install button. • Wait for the plugin to install • Repeat for the plugin EnhancedSearch • Close the Plugin Manager Import Network from Database In this section, you will learn how to search public interaction databases by PSICQUIC client plugin. PSICQUIC is a standardized mechanism for accessing public interaction databases. Cytoscape can import interactions directly from PSICQUIC-‐ compliant databases, including IntAct (http://www.ebi.ac.uk/intact/), STRING (http://string-‐db.org/), and Reactome (http://www.reactome.org). Search by list of gene ID • Under the file menu, select ImportàNetwork from Web Services… • Select PSICQUIC Universal Web Service Client from the Data Source. • In the Query box, type “brca1 brca2”
Cytoscape pops up a number of interactions found in the databases. Results may vary because it dynamically checks latest version of the data sets in the repositories. • Press Yes. Then Cytoscape displays number of interactions found in each database. • Press OK. It starts importing data from remote databases. It takes some time to finish (depends on the network connection speed).
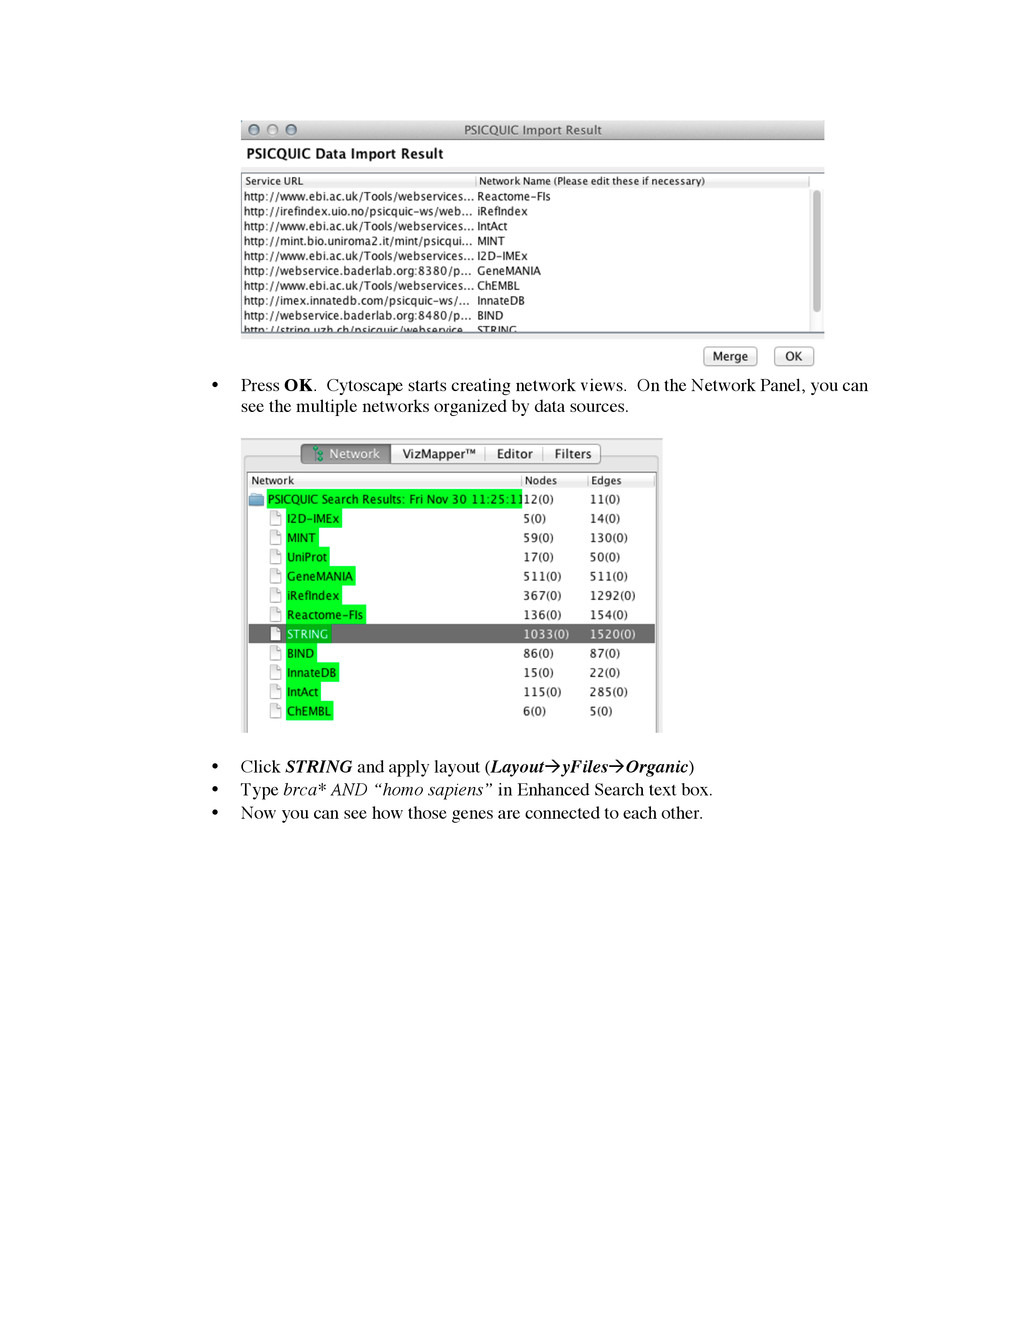
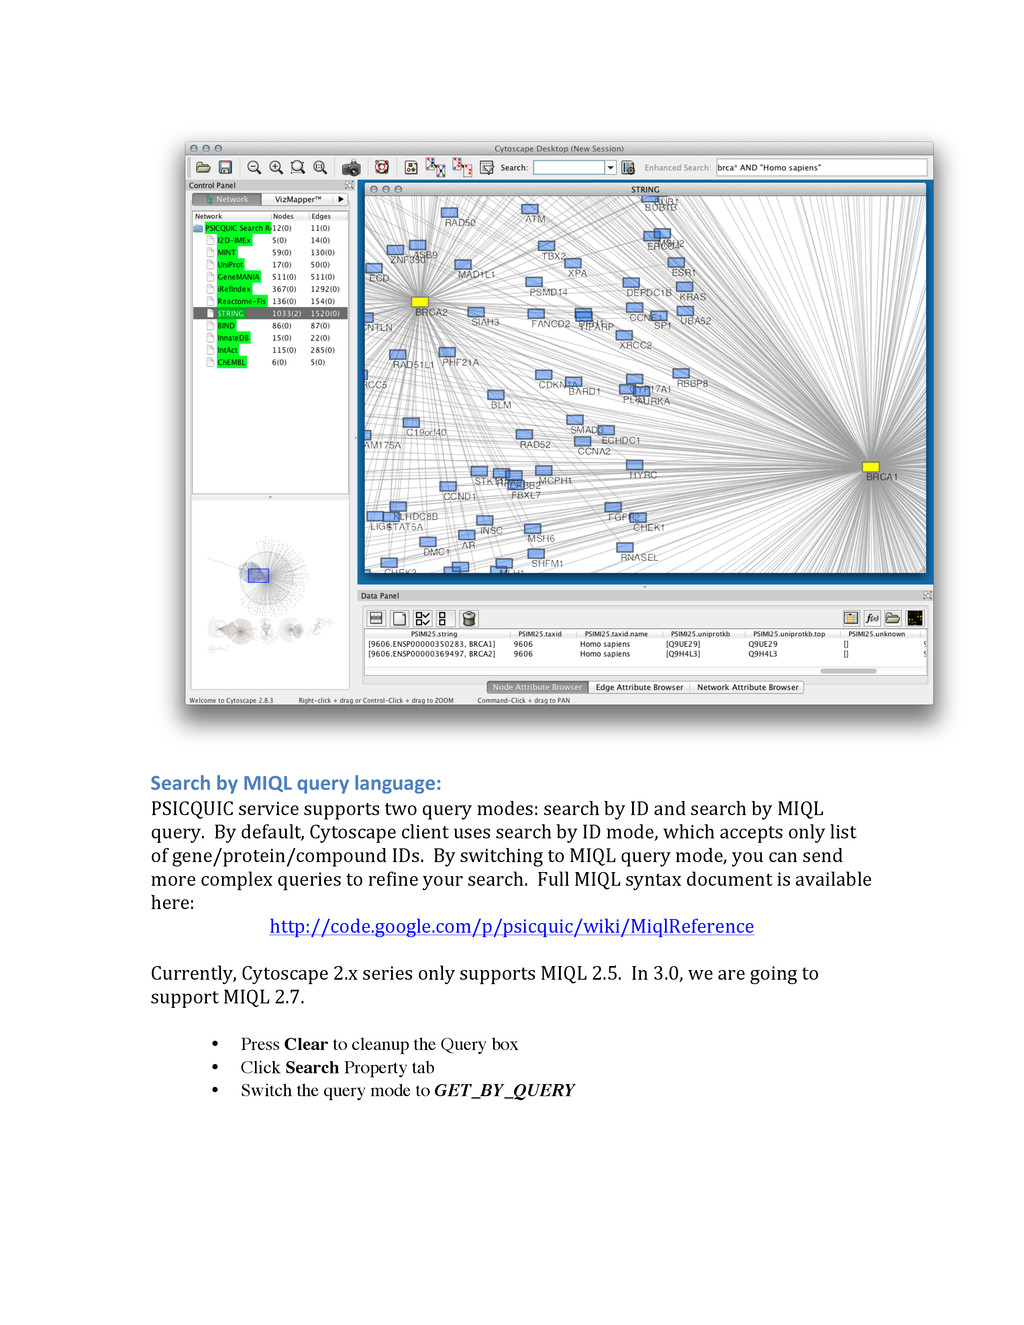
Network Panel, you can see the multiple networks organized by data sources. • Click STRING and apply layout (LayoutàyFilesàOrganic) • Type brca* AND “homo sapiens” in Enhanced Search text box. • Now you can see how those genes are connected to each other.
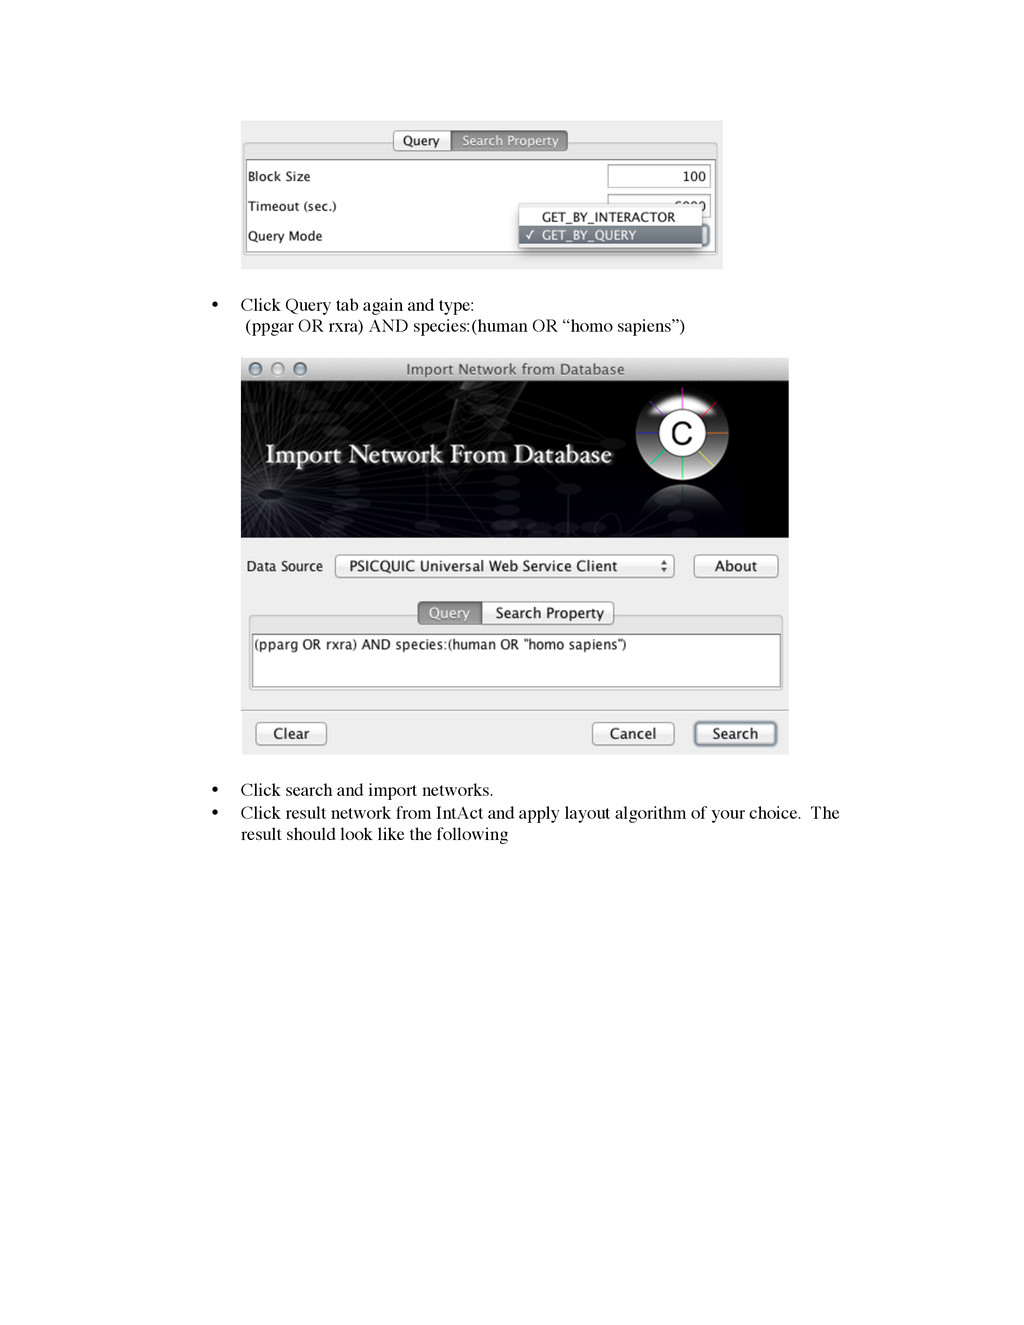
two query modes: search by ID and search by MIQL query. By default, Cytoscape client uses search by ID mode, which accepts only list of gene/protein/compound IDs. By switching to MIQL query mode, you can send more complex queries to refine your search. Full MIQL syntax document is available here: http://code.google.com/p/psicquic/wiki/MiqlReference Currently, Cytoscape 2.x series only supports MIQL 2.5. In 3.0, we are going to support MIQL 2.7. • Press Clear to cleanup the Query box • Click Search Property tab • Switch the query mode to GET_BY_QUERY
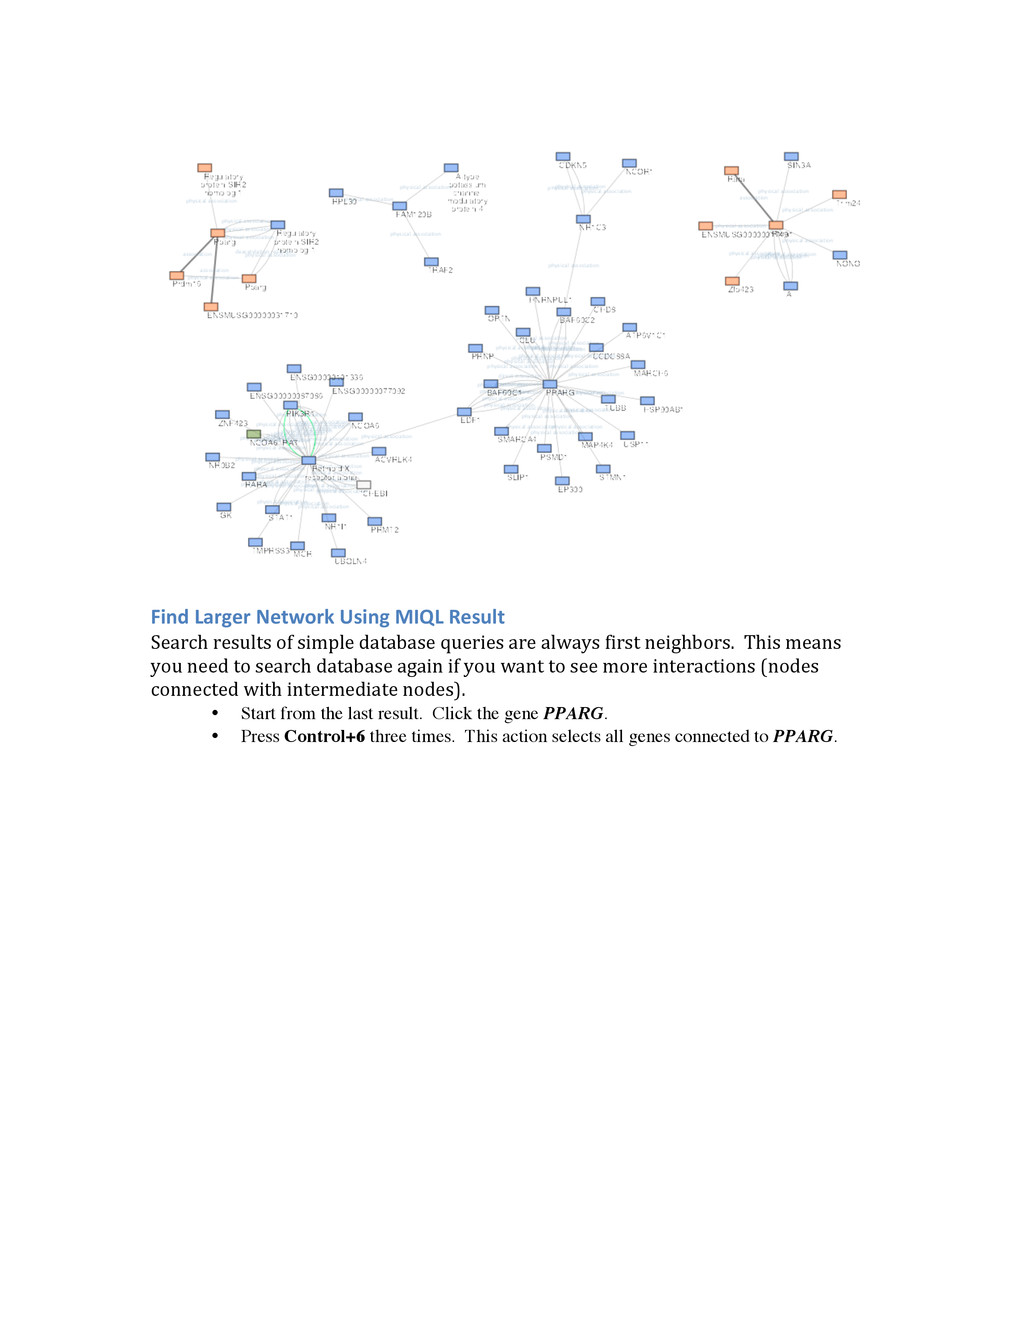
AND species:(human OR “homo sapiens”) • Click search and import networks. • Click result network from IntAct and apply layout algorithm of your choice. The result should look like the following
of simple database queries are always first neighbors. This means you need to search database again if you want to see more interactions (nodes connected with intermediate nodes). • Start from the last result. Click the gene PPARG. • Press Control+6 three times. This action selects all genes connected to PPARG.
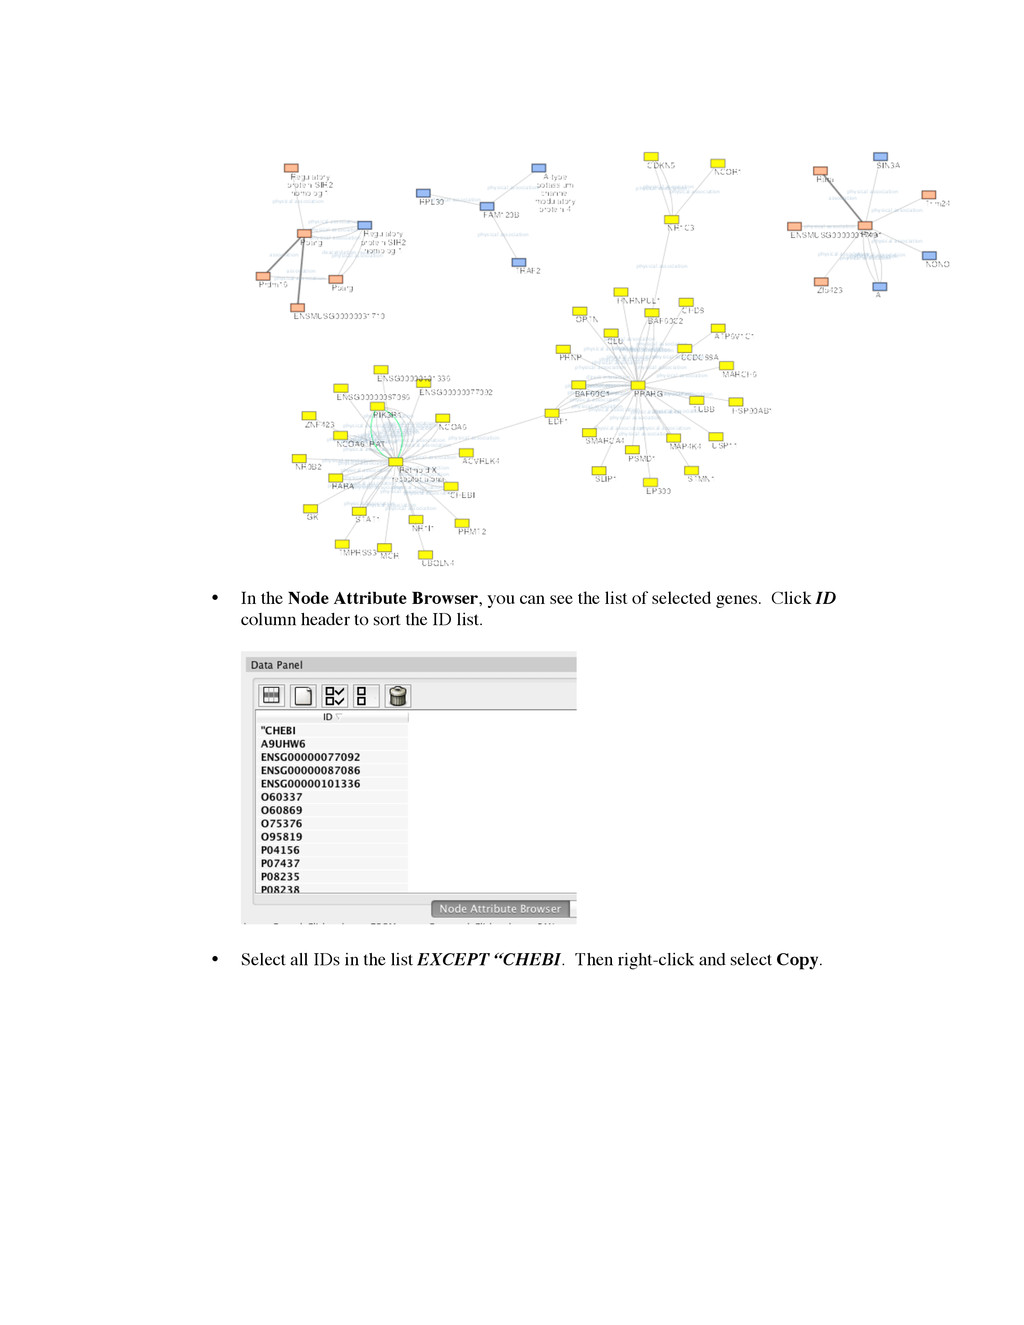
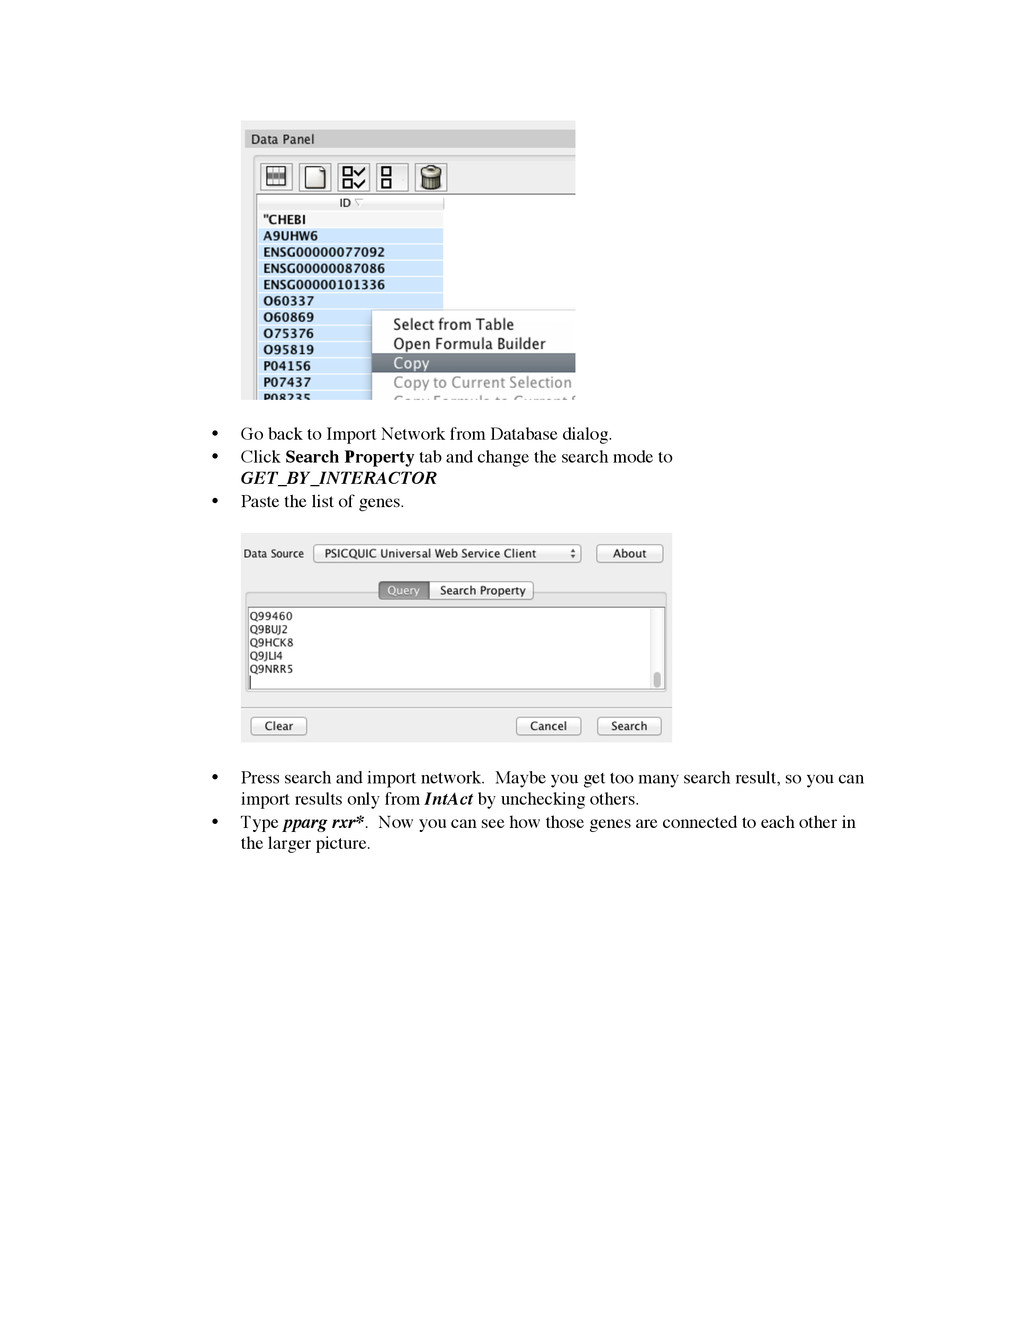
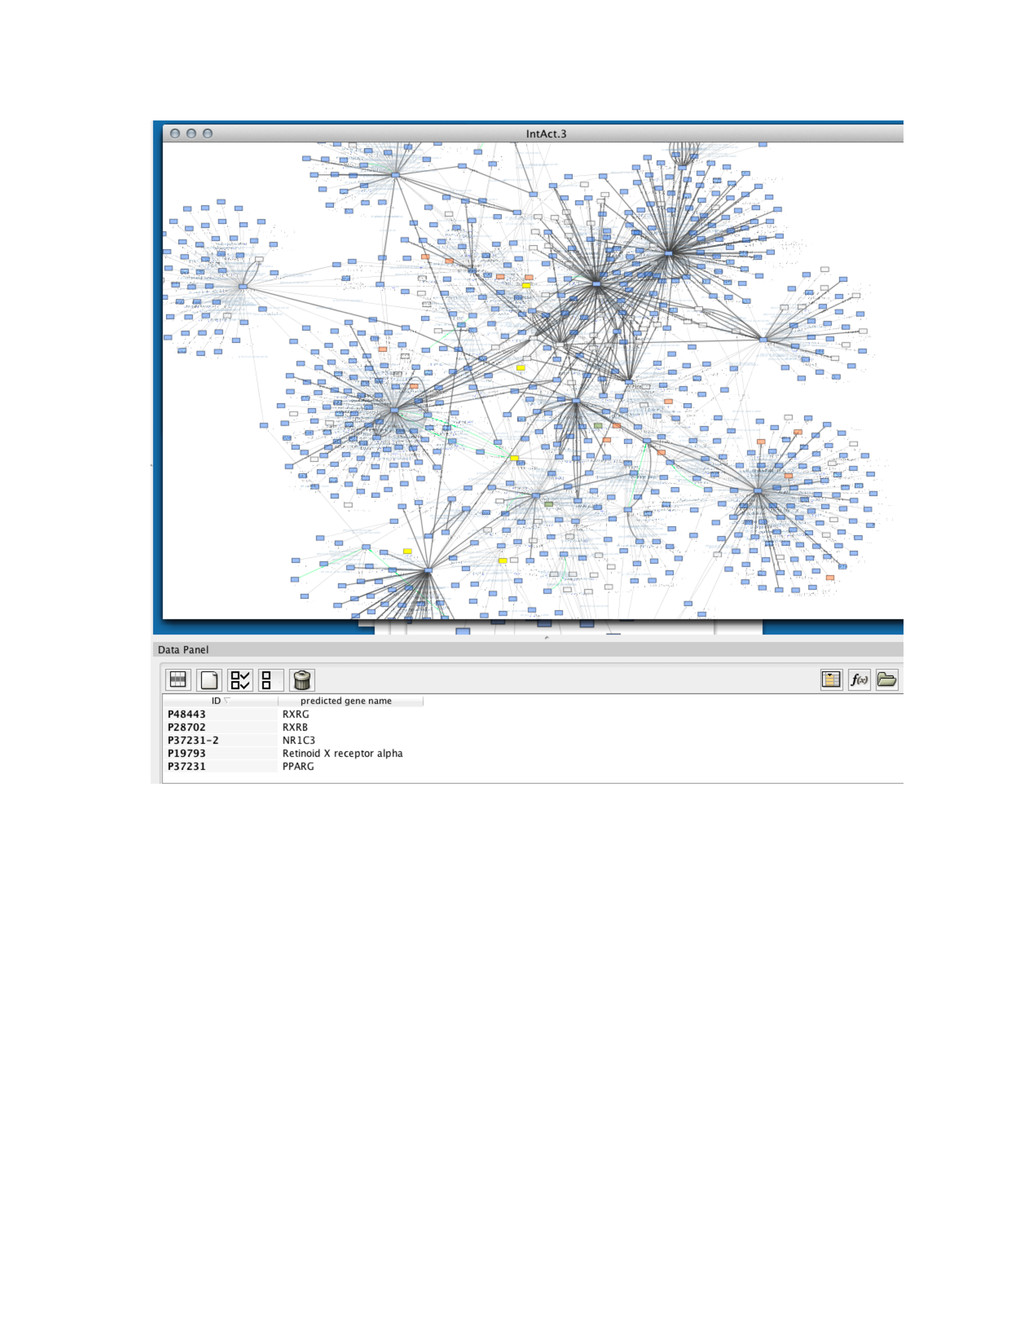
Click Search Property tab and change the search mode to GET_BY_INTERACTOR • Paste the list of genes. • Press search and import network. Maybe you get too many search result, so you can import results only from IntAct by unchecking others. • Type pparg rxr*. Now you can see how those genes are connected to each other in the larger picture.
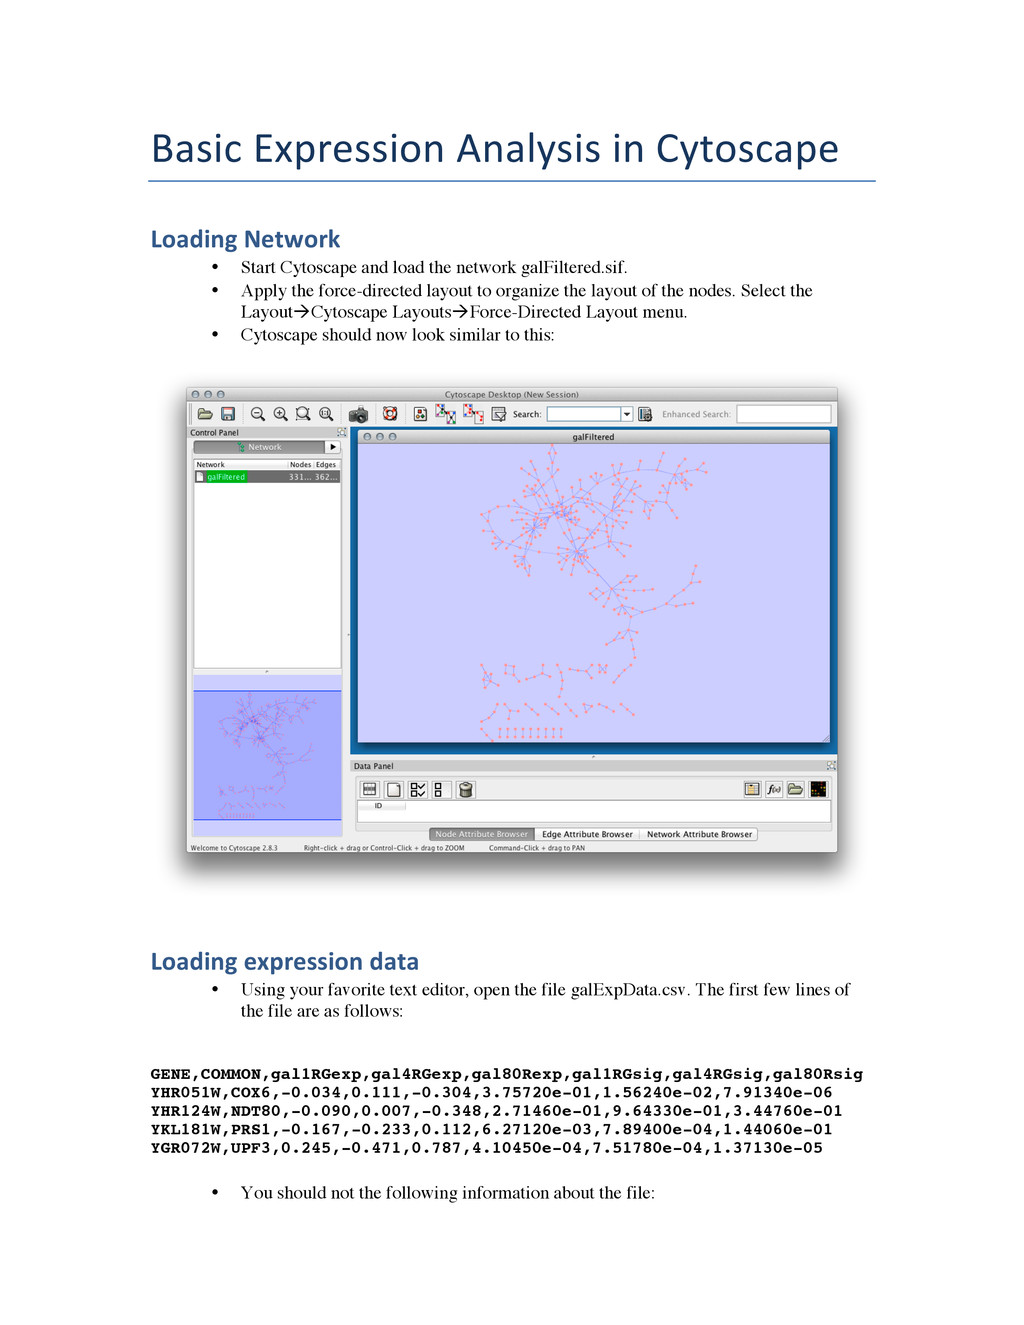
• Start Cytoscape and load the network galFiltered.sif. • Apply the force-directed layout to organize the layout of the nodes. Select the LayoutàCytoscape
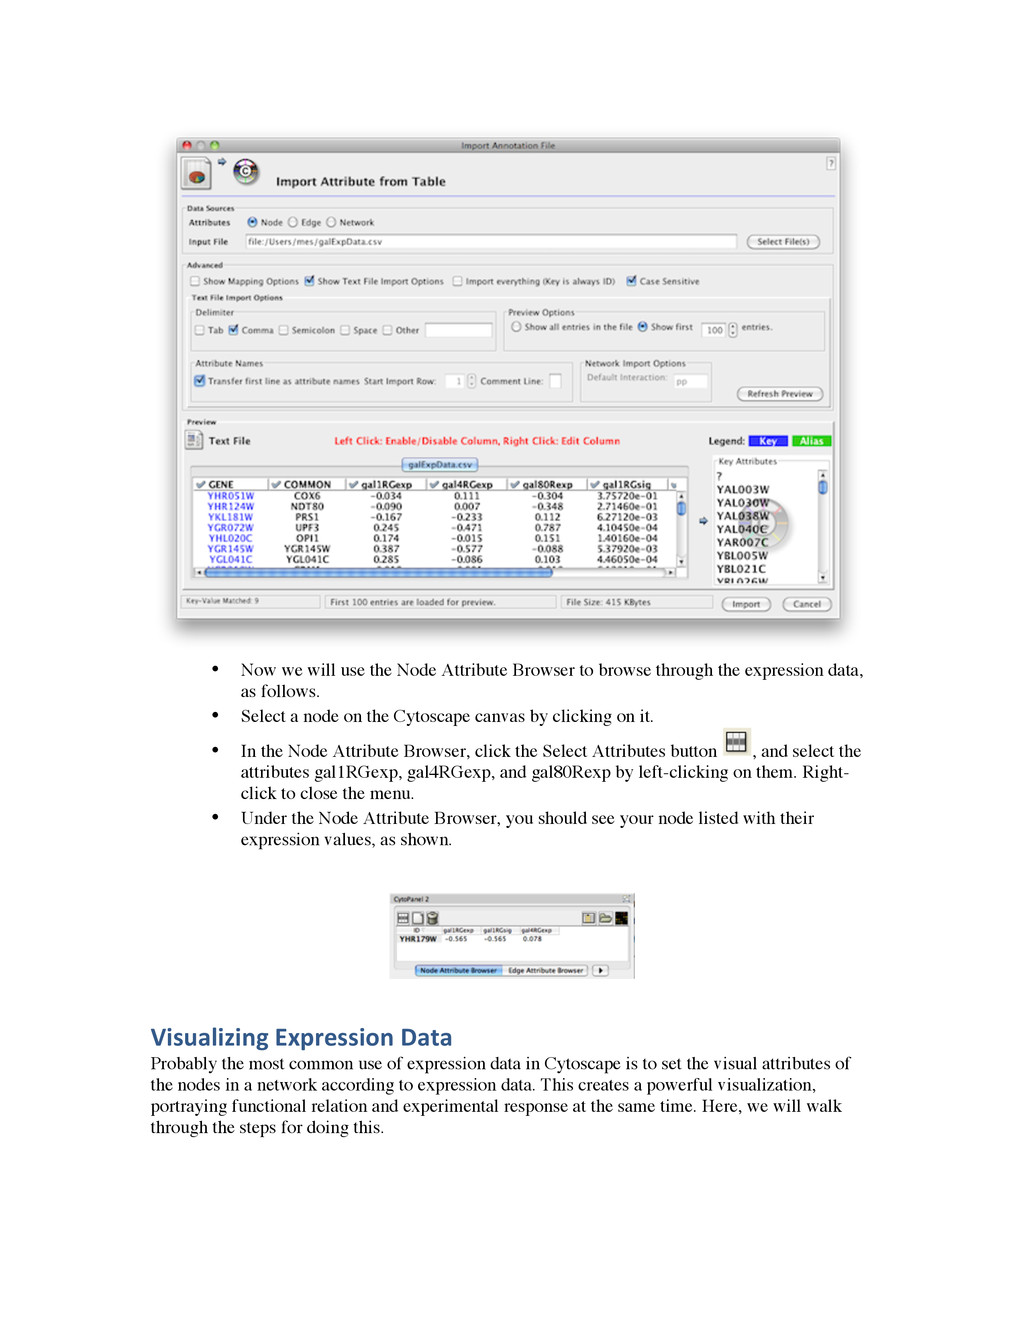
are separated by a single comma character. • The first column contains node names, and must match the names of the nodes in your network exactly! • The second column contains common locus names. This column is optional, and the data is not currently used
browse through the expression data, as follows. • Select a node on the Cytoscape canvas by clicking on it. • In the Node Attribute Browser, click the Select Attributes button , and select the attributes gal1RGexp, gal4RGexp, and gal80Rexp by left-clicking on them. Right- click to close the menu. • Under the Node Attribute Browser, you should see your node listed with their expression values, as shown. Visualizing Expression Data Probably the most common use of expression data in Cytoscape is to set the visual attributes of the nodes in a network according to expression data. This creates a powerful visualization, portraying functional relation and experimental response at the same time. Here, we will walk through the steps for doing this.
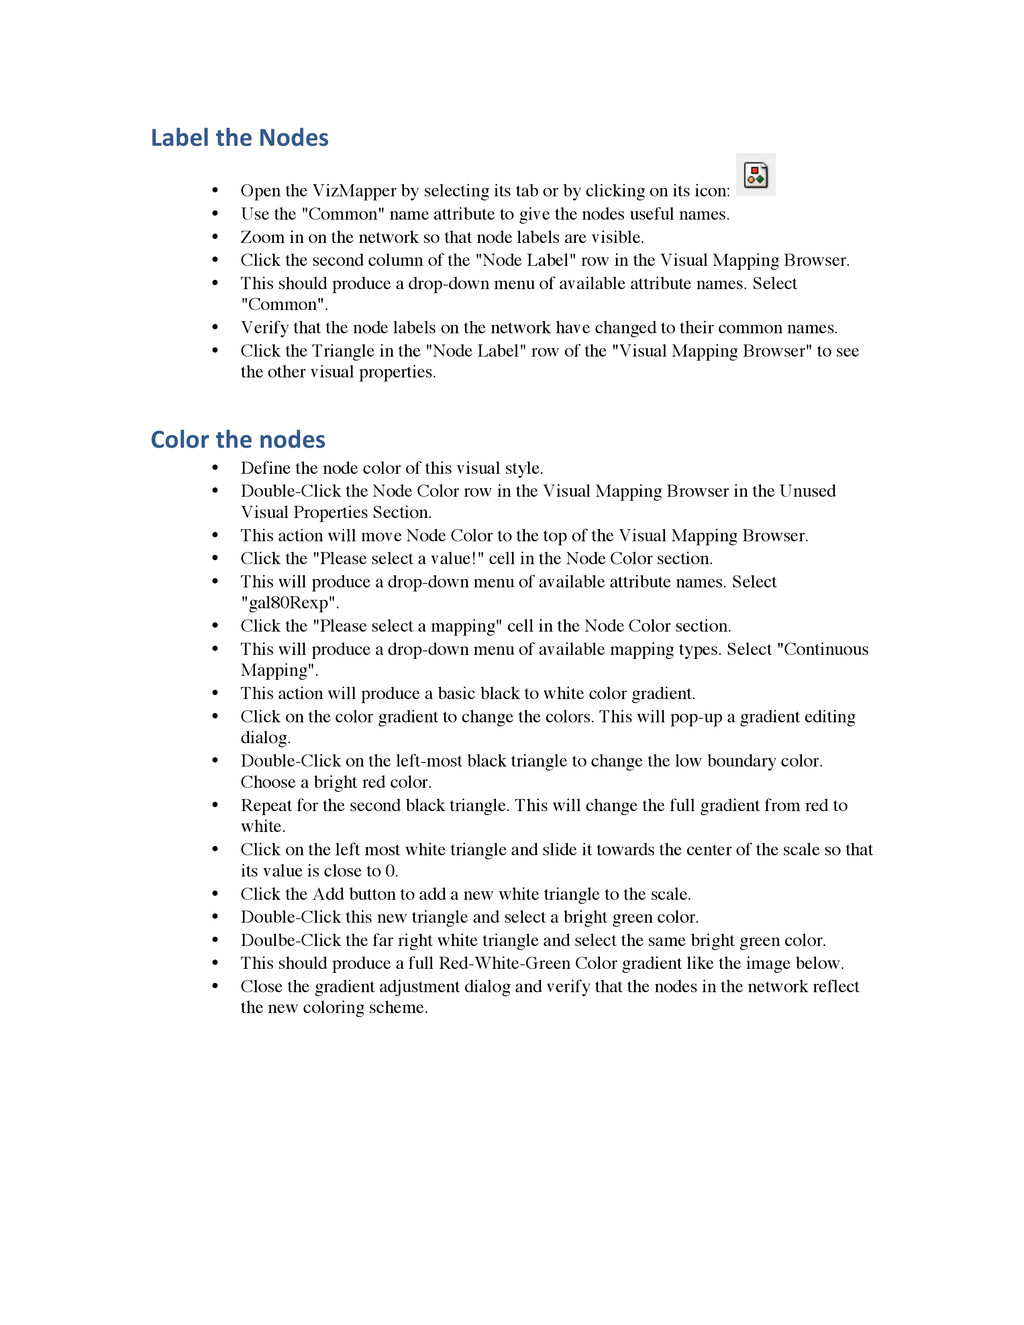
selecting its tab or by clicking on its icon: • Use the "Common" name attribute to give the nodes useful names. • Zoom in on the network so that node labels are visible. • Click the second column of the "Node Label" row in the Visual Mapping Browser. • This should produce a drop-down menu of available attribute names. Select "Common". • Verify that the node labels on the network have changed to their common names. • Click the Triangle in the "Node Label" row of the "Visual Mapping Browser" to see the other visual properties. Color the nodes • Define the node color of this visual style. • Double-Click the Node Color row in the Visual Mapping Browser in the Unused Visual Properties Section. • This action will move Node Color to the top of the Visual Mapping Browser. • Click the "Please select a value!" cell in the Node Color section. • This will produce a drop-down menu of available attribute names. Select "gal80Rexp". • Click the "Please select a mapping" cell in the Node Color section. • This will produce a drop-down menu of available mapping types. Select "Continuous Mapping". • This action will produce a basic black to white color gradient. • Click on the color gradient to change the colors. This will pop-up a gradient editing dialog. • Double-Click on the left-most black triangle to change the low boundary color. Choose a bright red color. • Repeat for the second black triangle. This will change the full gradient from red to white. • Click on the left most white triangle and slide it towards the center of the scale so that its value is close to 0. • Click the Add button to add a new white triangle to the scale. • Double-Click this new triangle and select a bright green color. • Doulbe-Click the far right white triangle and select the same bright green color. • This should produce a full Red-White-Green Color gradient like the image below. • Close the gradient adjustment dialog and verify that the nodes in the network reflect the new coloring scheme.
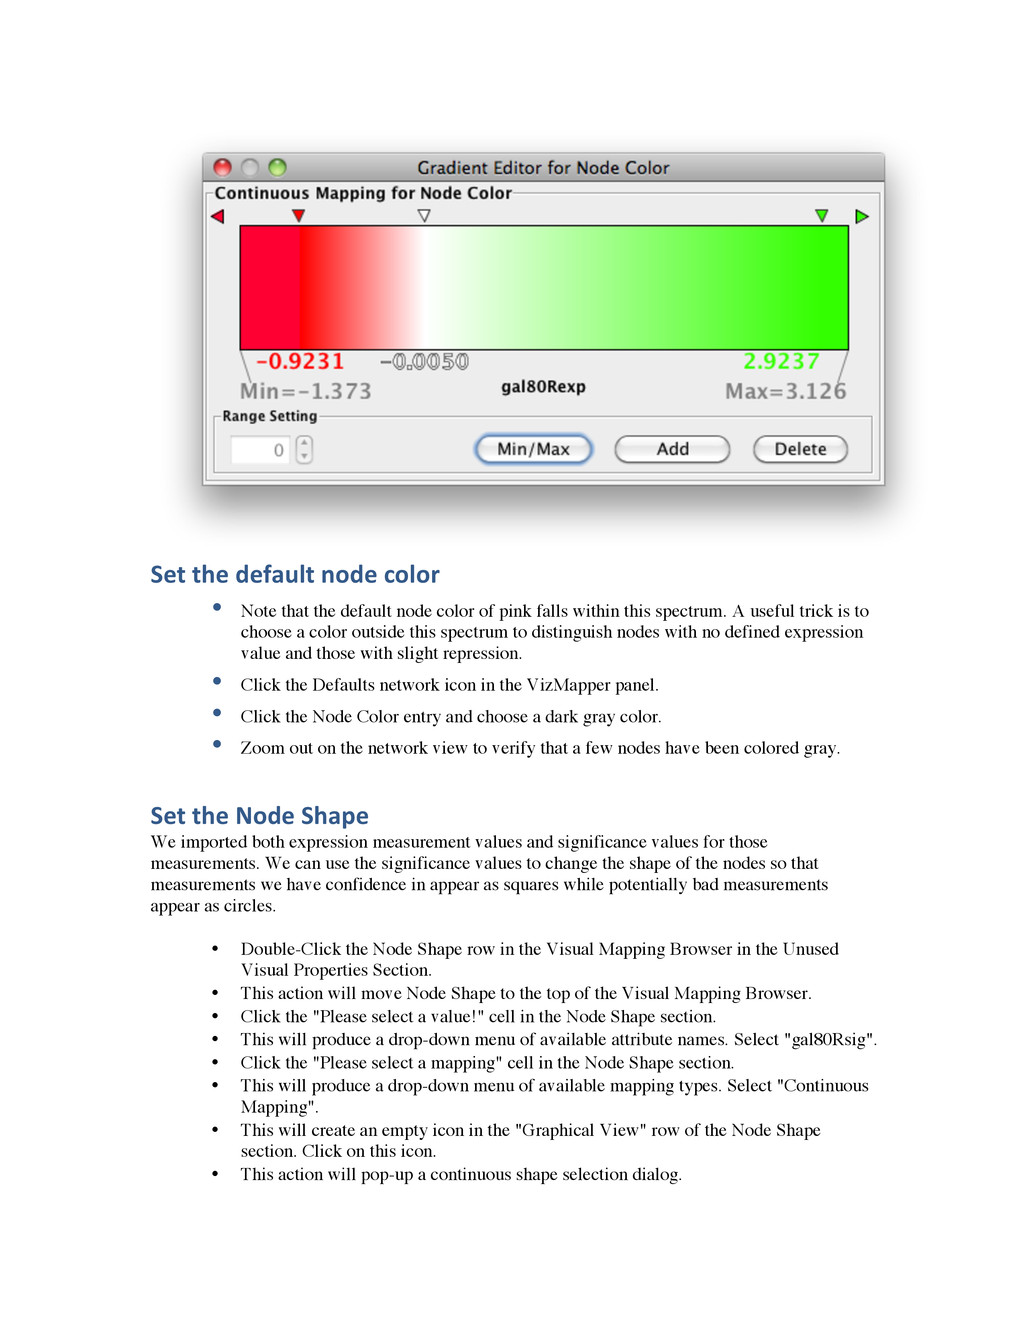
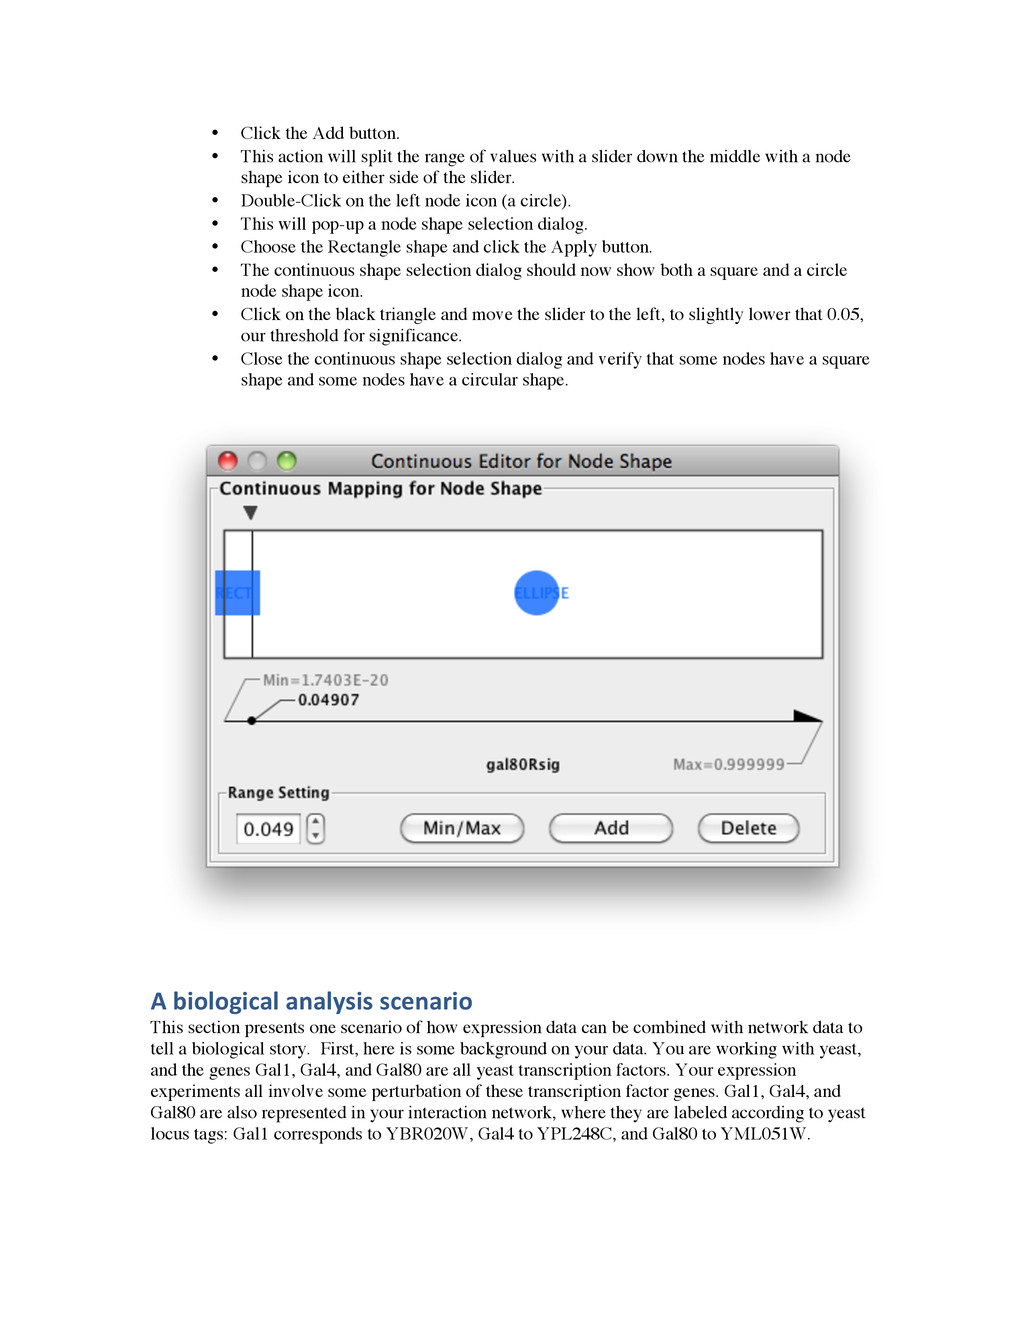
default node color of pink falls within this spectrum. A useful trick is to choose a color outside this spectrum to distinguish nodes with no defined expression value and those with slight repression. • Click the Defaults network icon in the VizMapper panel. • Click the Node Color entry and choose a dark gray color. • Zoom out on the network view to verify that a few nodes have been colored gray. Set the Node Shape We imported both expression measurement values and significance values for those measurements. We can use the significance values to change the shape of the nodes so that measurements we have confidence in appear as squares while potentially bad measurements appear as circles. • Double-Click the Node Shape row in the Visual Mapping Browser in the Unused Visual Properties Section. • This action will move Node Shape to the top of the Visual Mapping Browser. • Click the "Please select a value!" cell in the Node Shape section. • This will produce a drop-down menu of available attribute names. Select "gal80Rsig". • Click the "Please select a mapping" cell in the Node Shape section. • This will produce a drop-down menu of available mapping types. Select "Continuous Mapping". • This will create an empty icon in the "Graphical View" row of the Node Shape section. Click on this icon. • This action will pop-up a continuous shape selection dialog.
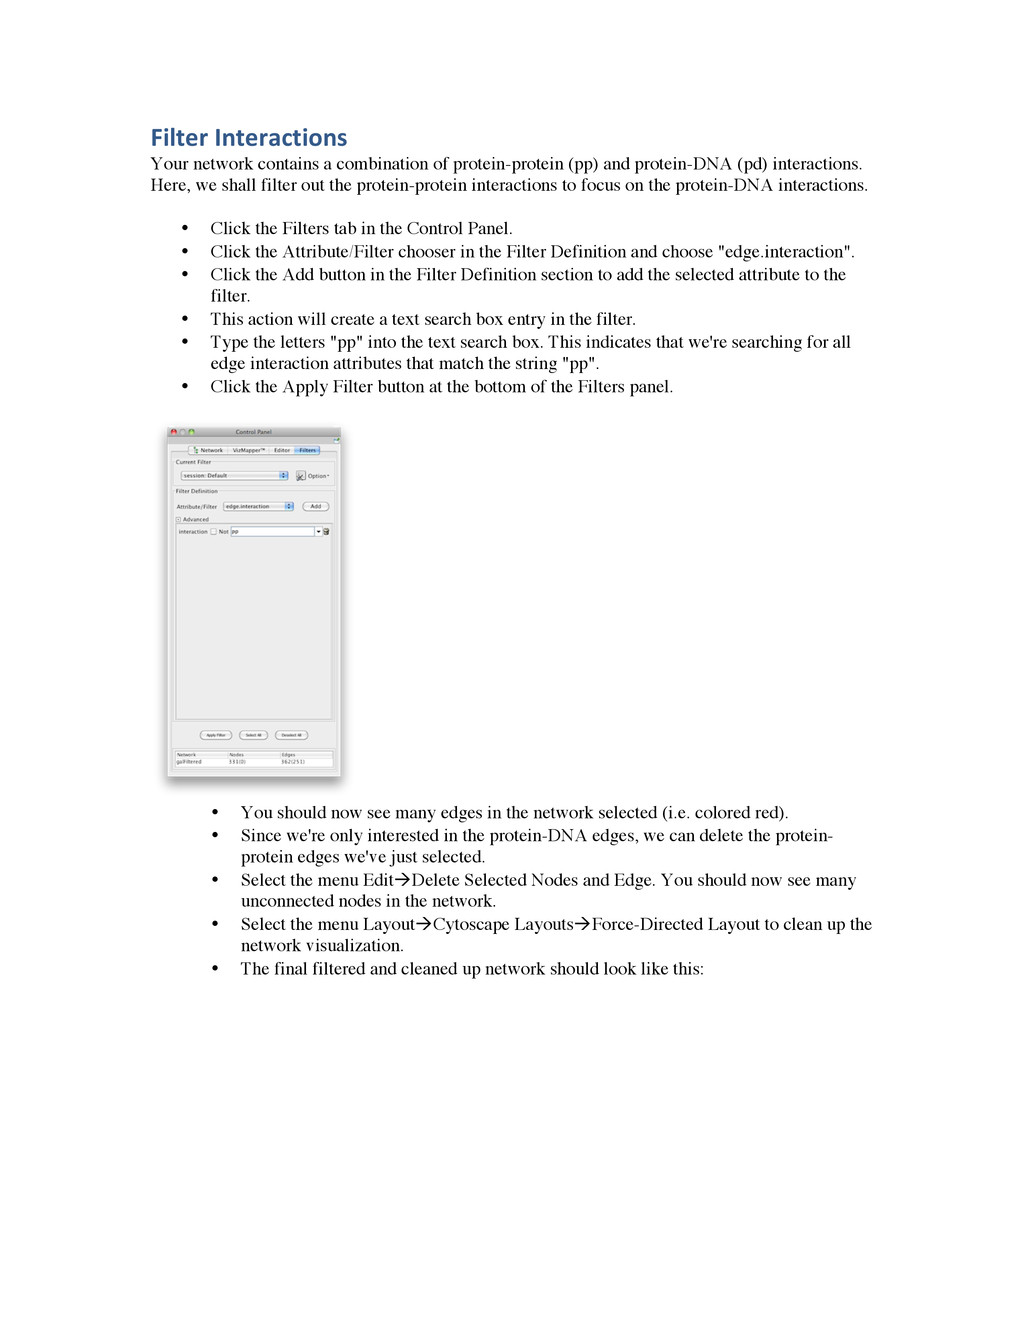
(pp) and protein-DNA (pd) interactions. Here, we shall filter out the protein-protein interactions to focus on the protein-DNA interactions. • Click the Filters tab in the Control Panel. • Click the Attribute/Filter chooser in the Filter Definition and choose "edge.interaction". • Click the Add button in the Filter Definition section to add the selected attribute to the filter. • This action will create a text search box entry in the filter. • Type the letters "pp" into the text search box. This indicates that we're searching for all edge interaction attributes
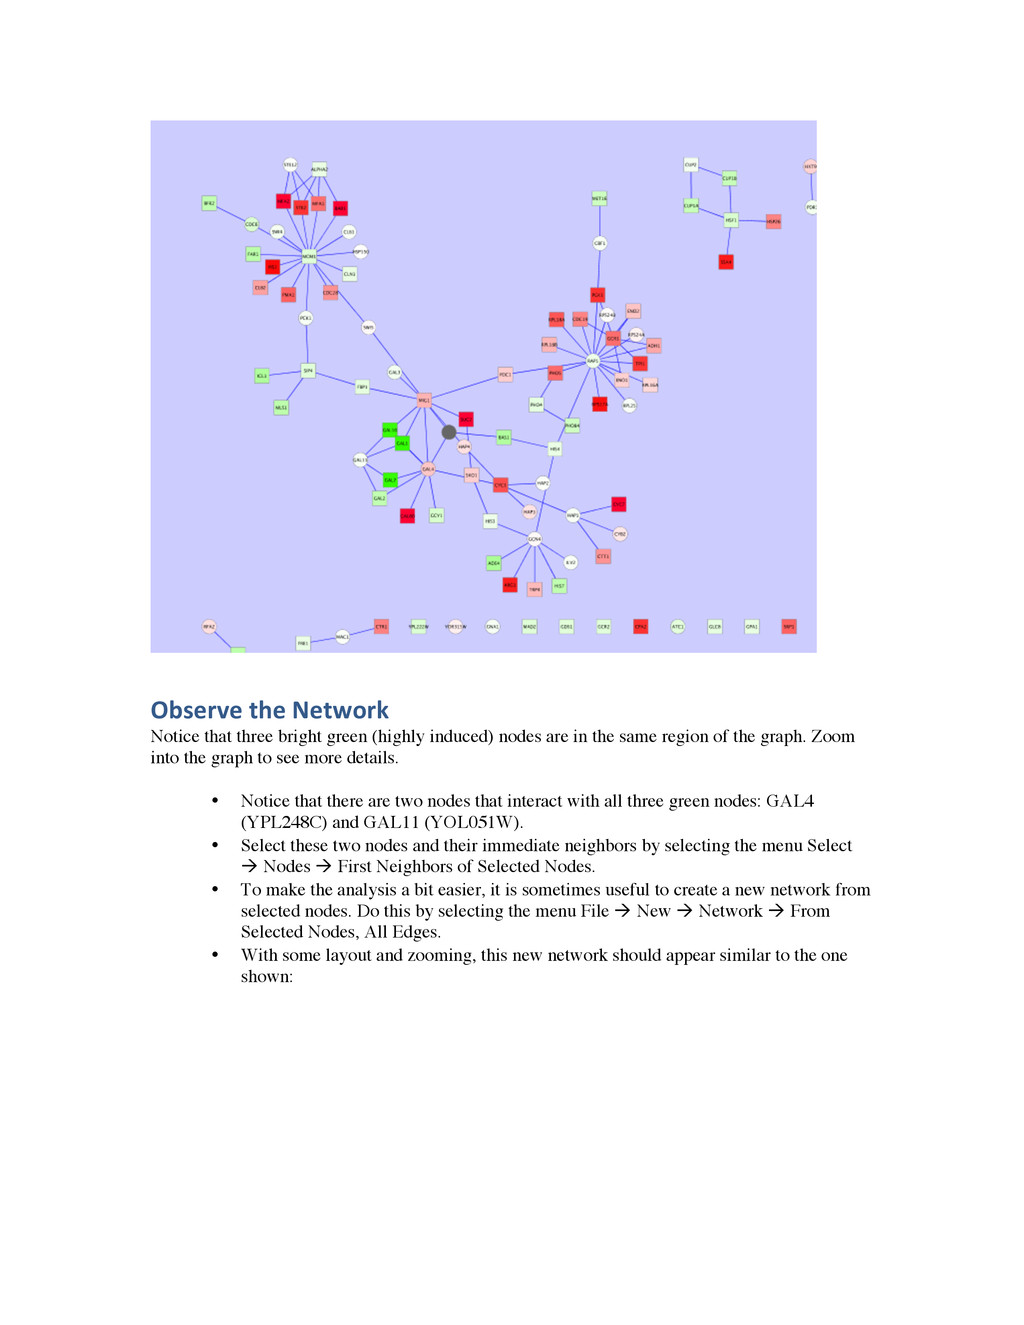
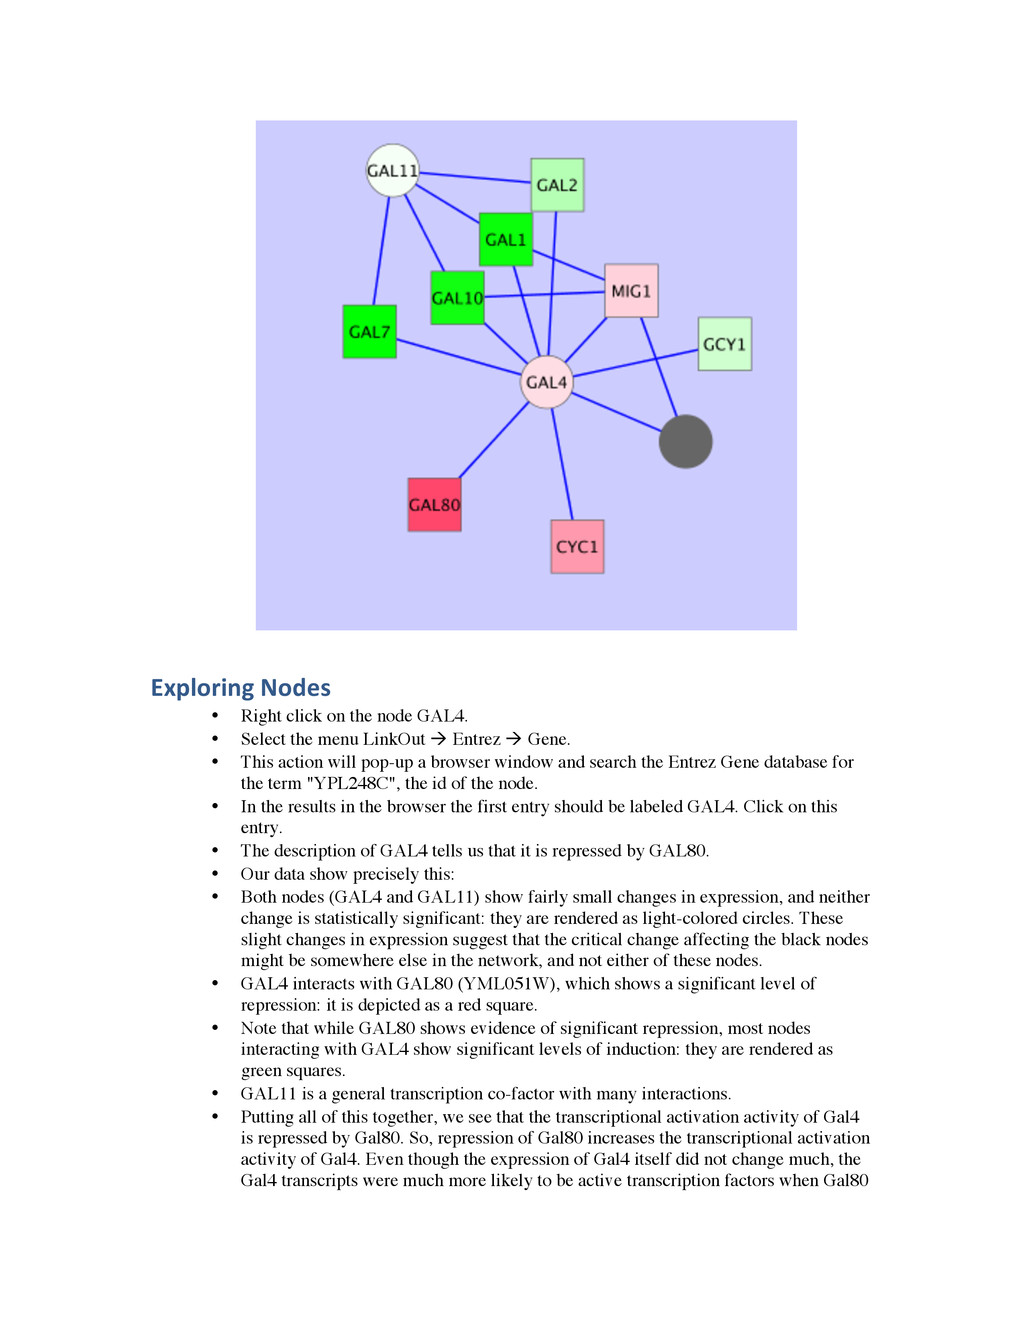
induced) nodes are in the same region of the graph. Zoom into the graph to see more details. • Notice that there are two nodes that interact with all three green nodes: GAL4 (YPL248C) and GAL11 (YOL051W). • Select these two nodes and their immediate neighbors by selecting the menu Select à Nodes à First Neighbors of Selected Nodes. • To make the analysis a bit easier, it is sometimes useful to create a new network from selected nodes. Do this by selecting the menu File à New à Network à From Selected Nodes, All Edges. • With some layout and zooming, this new network should appear similar to the one shown:
GAL4. • Select the menu LinkOut à Entrez à Gene. • This action will pop-up a browser window and search the Entrez Gene database for the term "YPL248C", the id
• Cytoscape App Store: http://apps.cytoscape.org/ • Open Tutorials: http://opentutorials.cgl.ucsf.edu/index.php/Portal:Cytoscape • Cytoscape Wiki: http://wiki.cytoscape.org/ • Cytoscape Help Desk: https://groups.google.com/forum/?fromgroups#!forum/cytoscape-helpdesk • Cytoscape Discussion: https://groups.google.com/forum/?fromgroups#!forum/cytoscape-discuss Publications about Cytoscape A travel guide to Cytoscape plugins Rintaro Saito, Michael E Smoot, Keiichiro Ono, Johannes Ruscheinski, Peng-‐Liang Wang, Samad Lotia, Alexander R Pico, Gary D Bader, Trey Ideker (2012) Nature Methods 9 (11) p. 1069-‐1076 Cytoscape 2.8: new features for data integration and network visualization Michael Smoot, Keiichiro Ono, Johannes Ruscheinski, Peng-‐Liang Wang, Trey Ideker Bioinformatics. 2011 February 1; 27(3): 431–432.Published online 2010 December 12. Integration of biological networks and gene expression data using Cytoscape Melissa S Cline, Michael Smoot, Ethan Cerami, Allan Kuchinsky, et al. Nature Protocols 2, 2366 -‐ 2382 (2007) Published online: 27 September 2007 | doi:10.1038/nprot.2007.324