of the Washington DC R-Ladies Meetup I work in a cross-functional group at RStudio, serving our customers, sales team, support team and product engineering teams. My favorite thing we make is RStudio Connect!
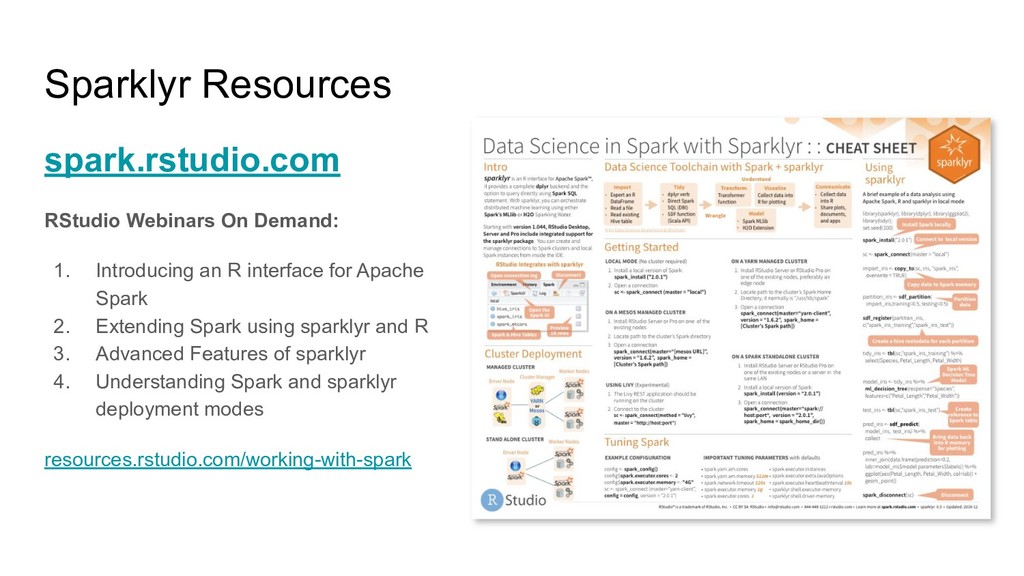
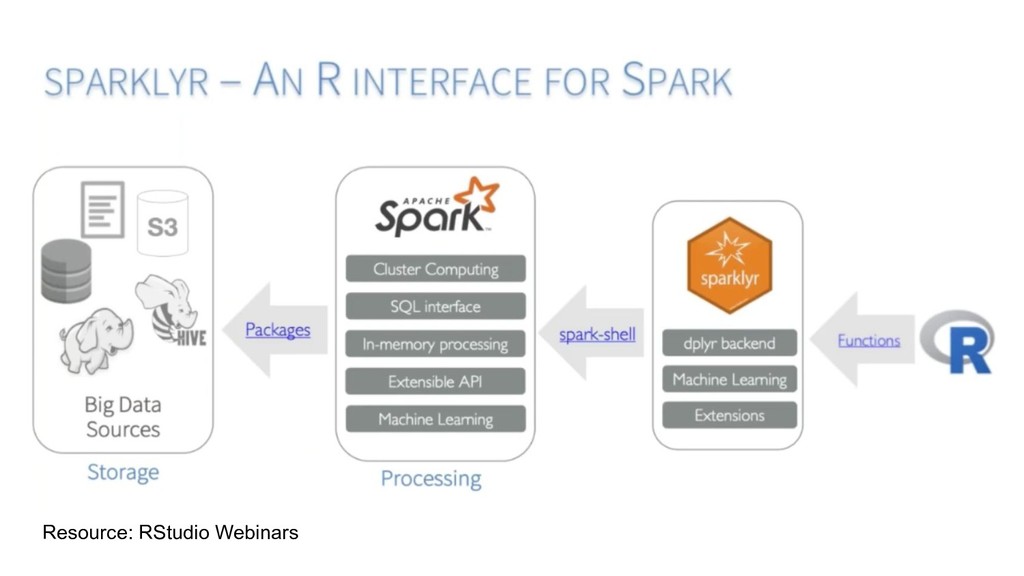
R interface for Apache Spark 2. Extending Spark using sparklyr and R 3. Advanced Features of sparklyr 4. Understanding Spark and sparklyr deployment modes resources.rstudio.com/working-with-spark
Pro) Introduction to Spark and R Analysis with Sparklyr (DBI, dplyr review) Modeling (super basic) Sparklyr Skills: - Patterns for reading and writing data - Working with streaming data - The mechanics of distributing R code
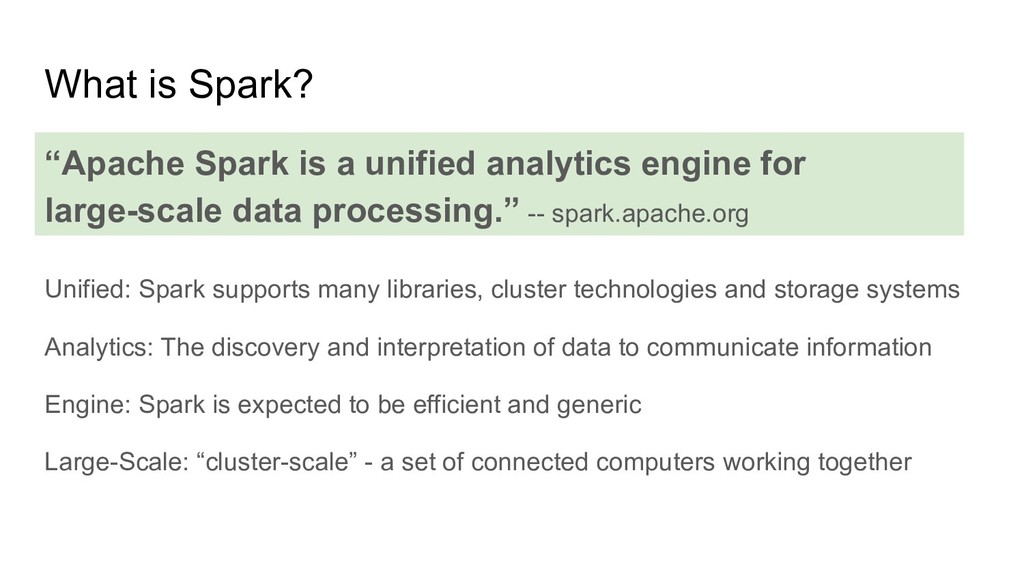
and storage systems Analytics: The discovery and interpretation of data to communicate information Engine: Spark is expected to be efficient and generic Large-Scale: “cluster-scale” - a set of connected computers working together “Apache Spark is a unified analytics engine for large-scale data processing.” -- spark.apache.org
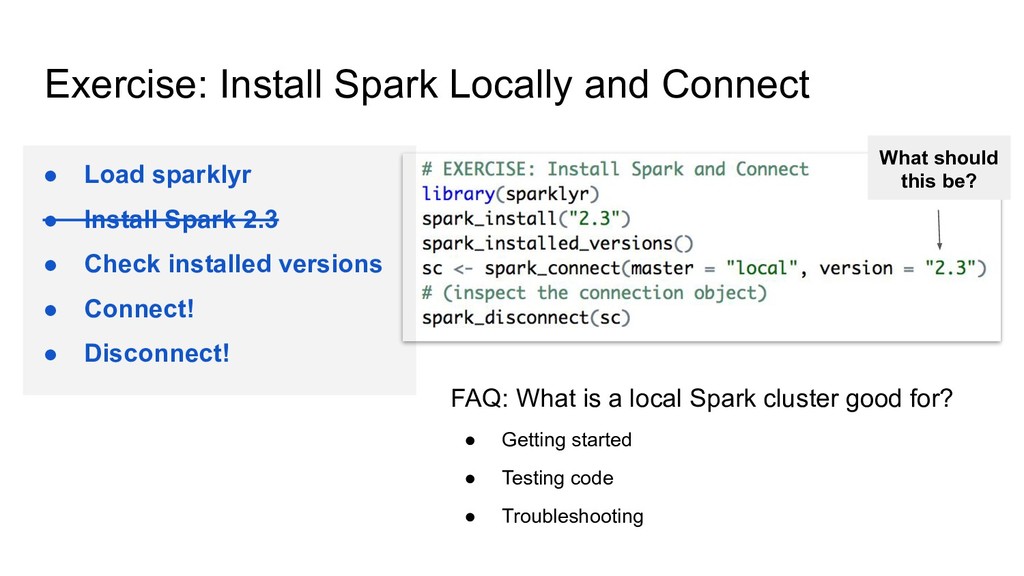
Install Spark 2.3 • Check installed versions • Connect! • Disconnect! FAQ: What is a local Spark cluster good for? • Getting started • Testing code • Troubleshooting What should this be?
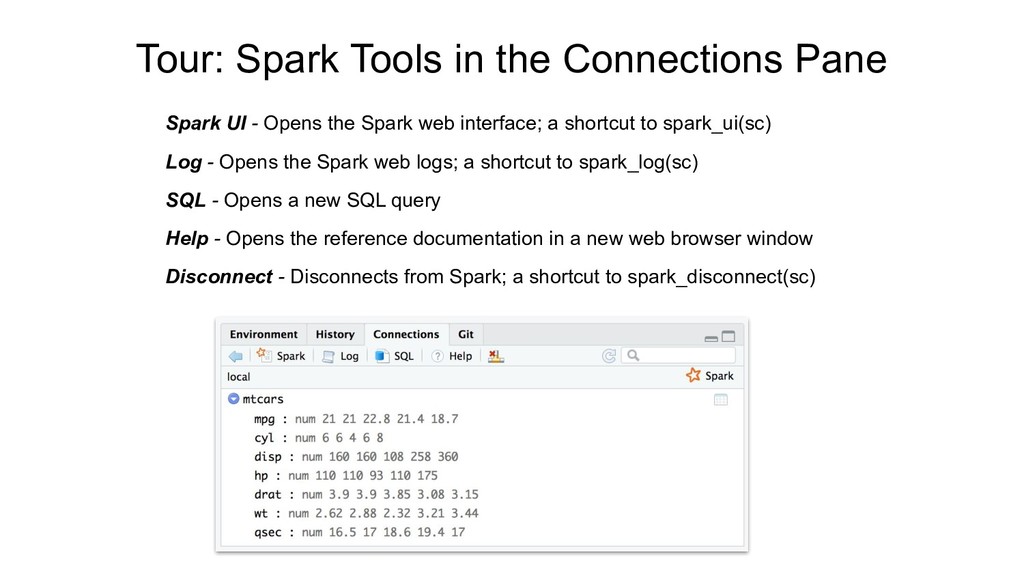
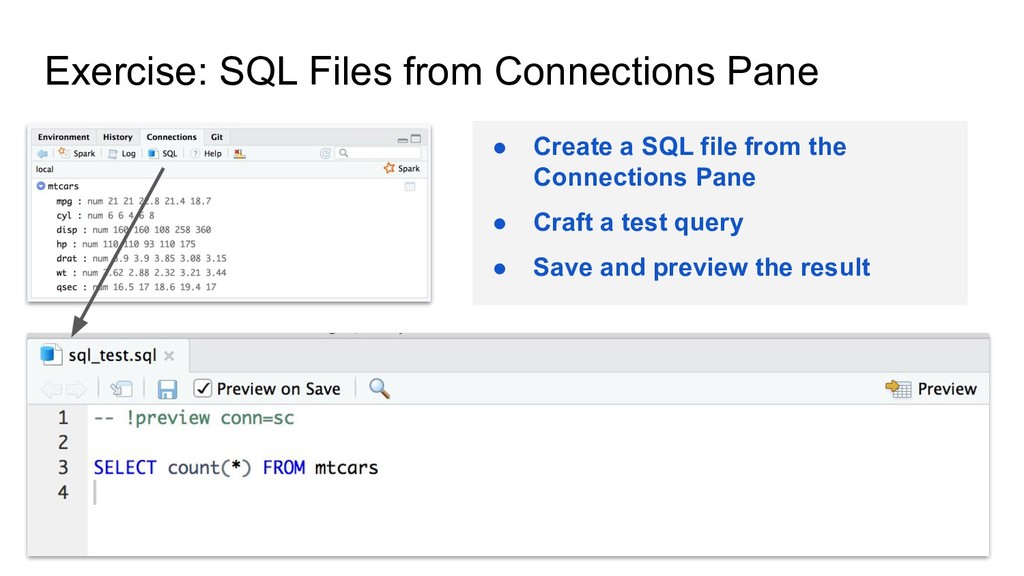
Opens the Spark web interface; a shortcut to spark_ui(sc) Log - Opens the Spark web logs; a shortcut to spark_log(sc) SQL - Opens a new SQL query Help - Opens the reference documentation in a new web browser window Disconnect - Disconnects from Spark; a shortcut to spark_disconnect(sc)
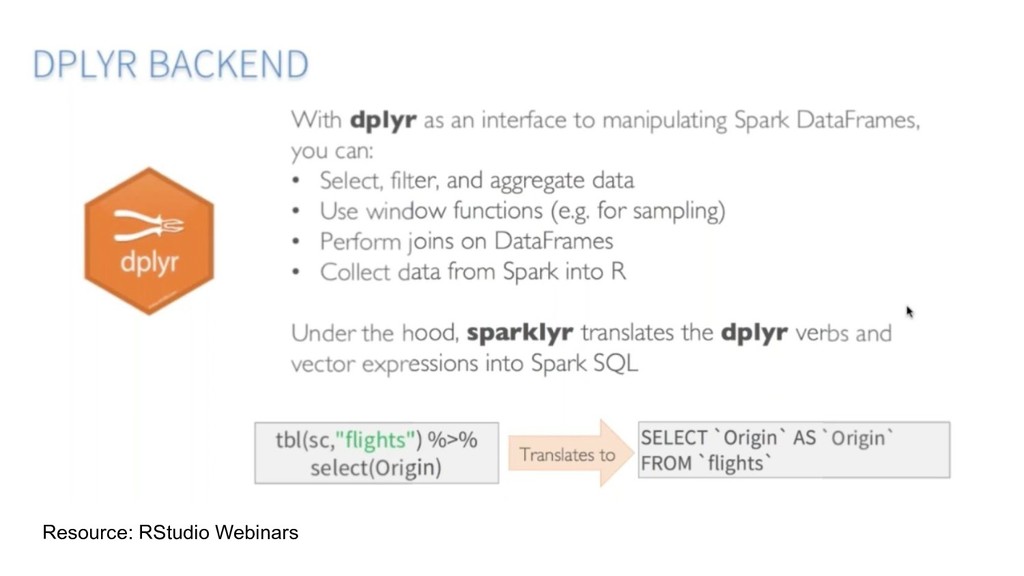
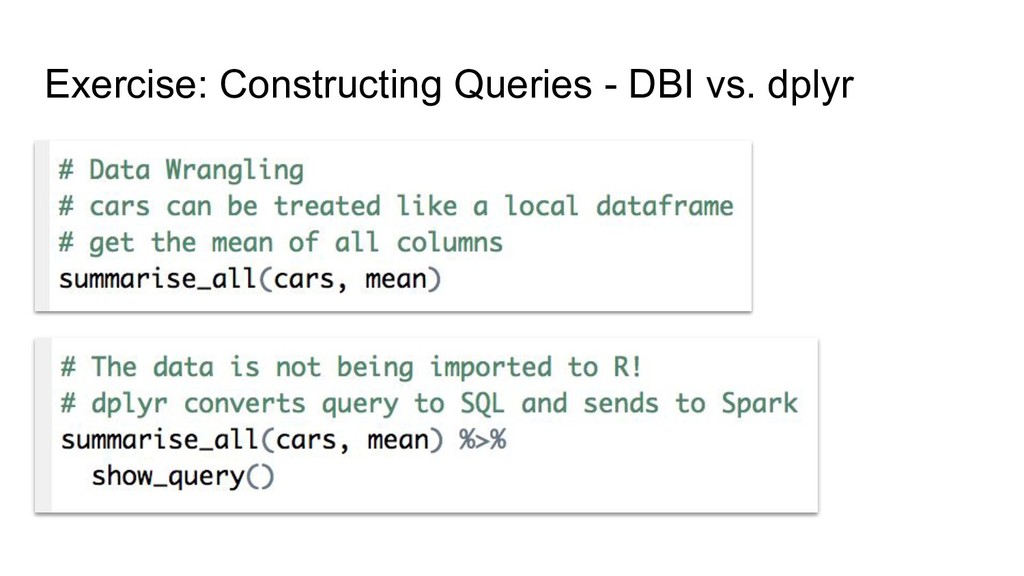
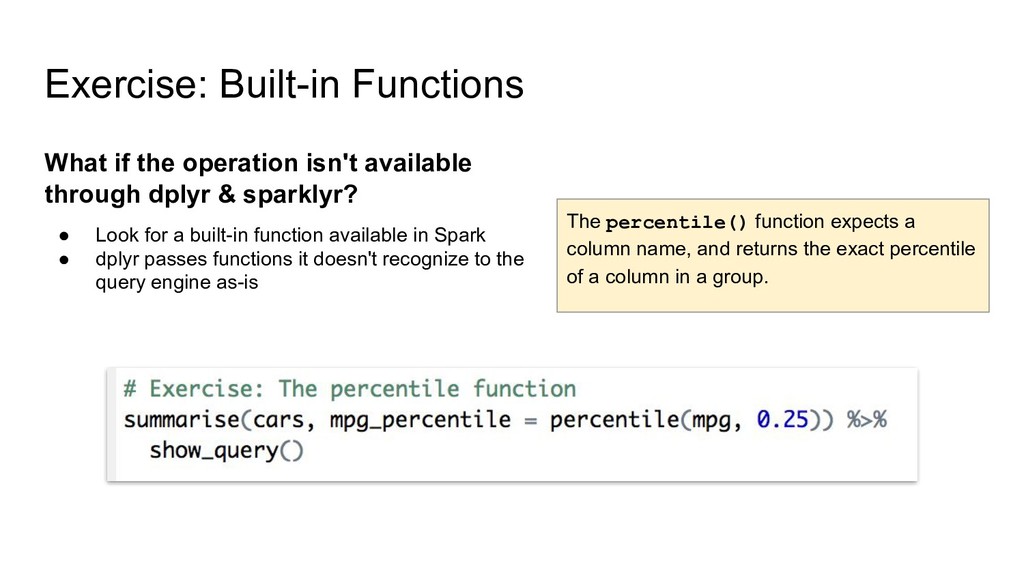
and returns the exact percentile of a column in a group. What if the operation isn't available through dplyr & sparklyr? • Look for a built-in function available in Spark • dplyr passes functions it doesn't recognize to the query engine as-is
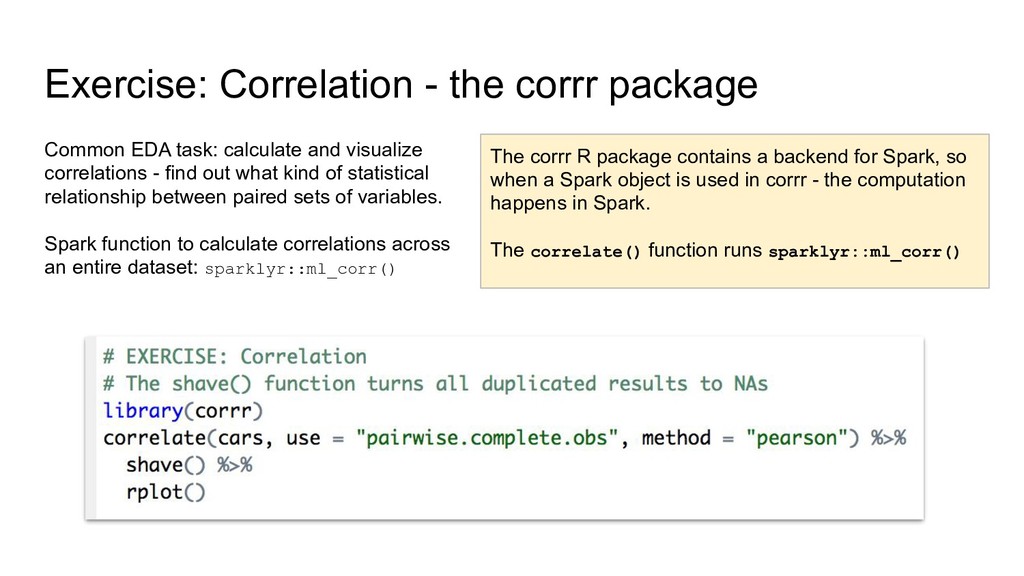
and visualize correlations - find out what kind of statistical relationship between paired sets of variables. Spark function to calculate correlations across an entire dataset: sparklyr::ml_corr() The corrr R package contains a backend for Spark, so when a Spark object is used in corrr - the computation happens in Spark. The correlate() function runs sparklyr::ml_corr()
to Spark will help with this problem because the data must be plotted in individual dots Alternative is to find a plot type that represents the x/y relationship and concentration in a way that it is easy to perceive and to “physically” plot Use dbplot_raster() to create a scatter-like plot in Spark, while only collecting a small subset of the remote dataset
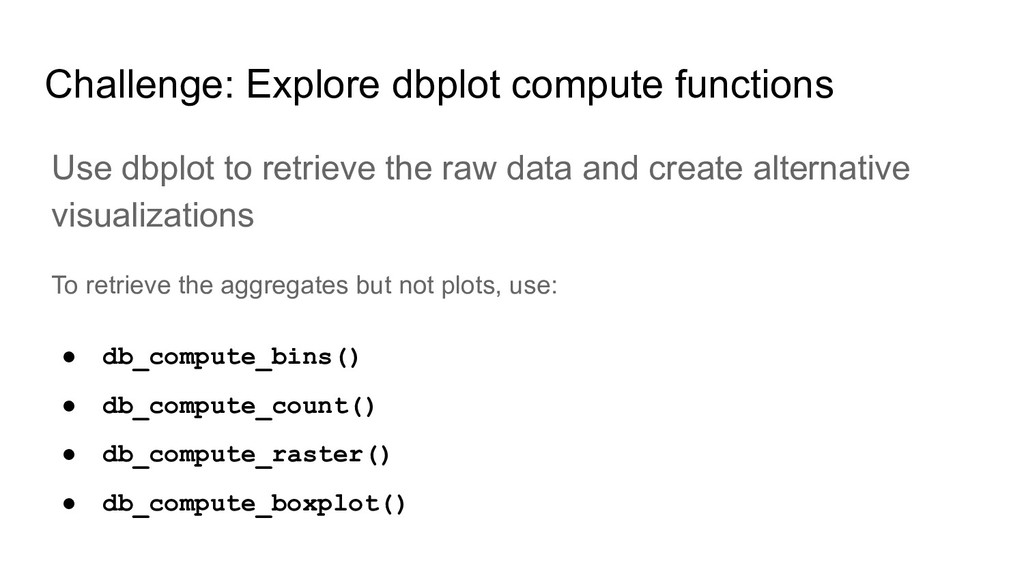
raw data and create alternative visualizations To retrieve the aggregates but not plots, use: • db_compute_bins() • db_compute_count() • db_compute_raster() • db_compute_boxplot()
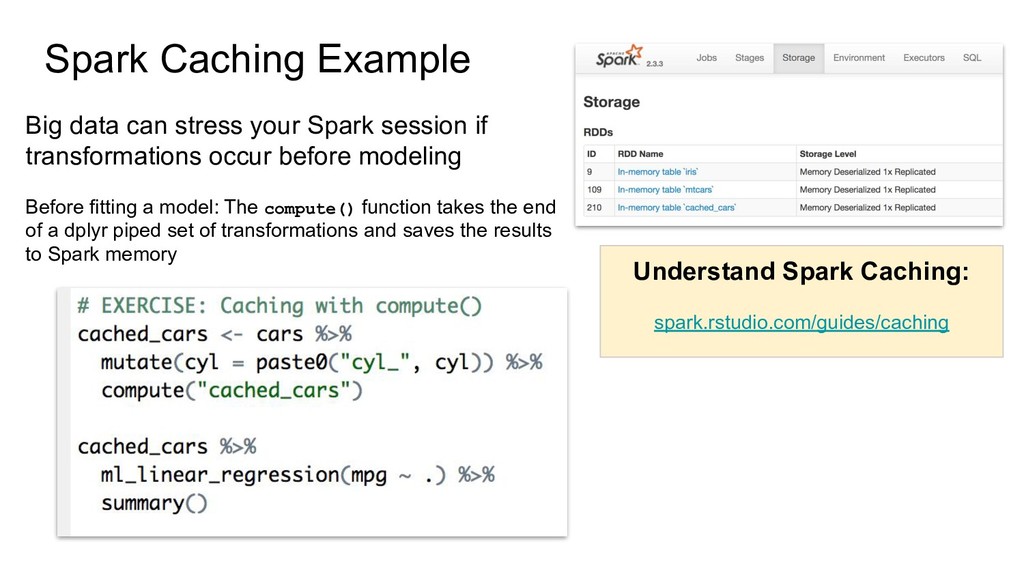
if transformations occur before modeling Before fitting a model: The compute() function takes the end of a dplyr piped set of transformations and saves the results to Spark memory Understand Spark Caching: spark.rstudio.com/guides/caching
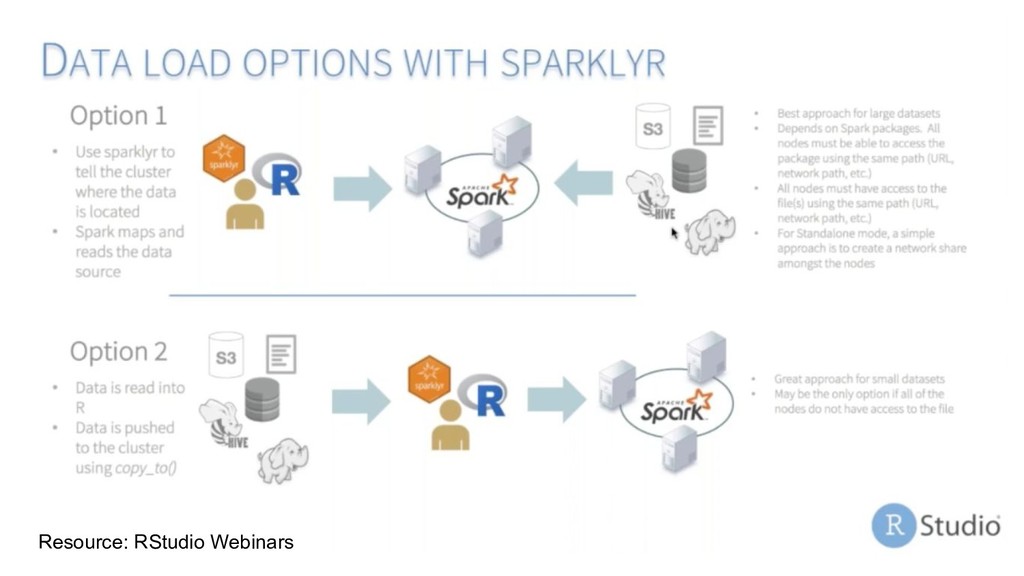
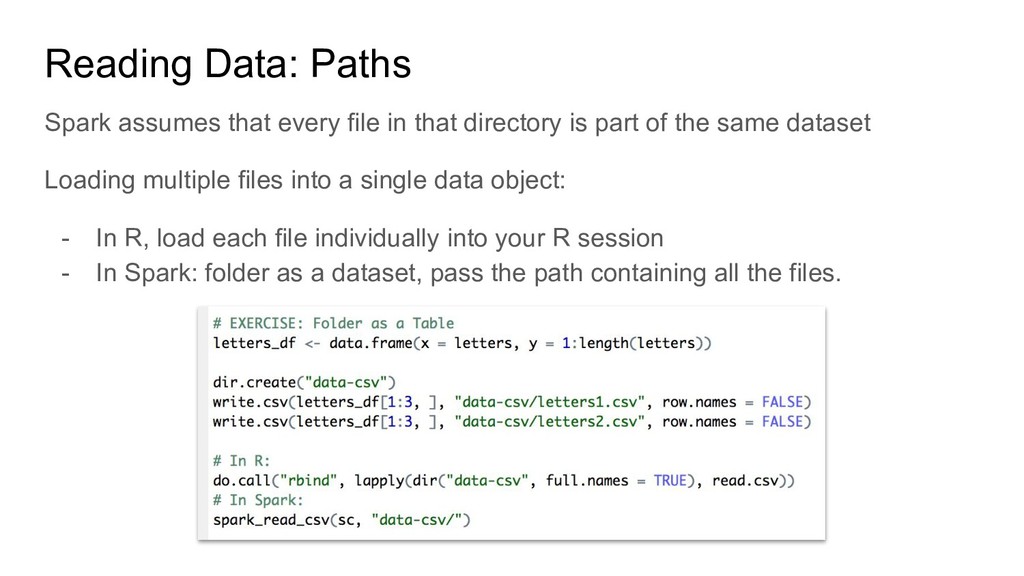
directory is part of the same dataset Loading multiple files into a single data object: - In R, load each file individually into your R session - In Spark: folder as a dataset, pass the path containing all the files.
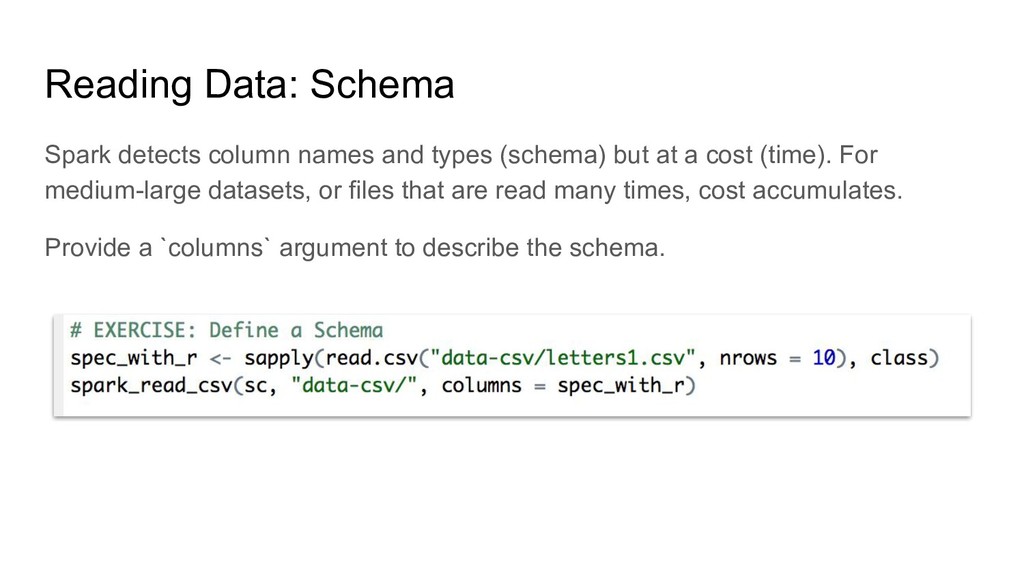
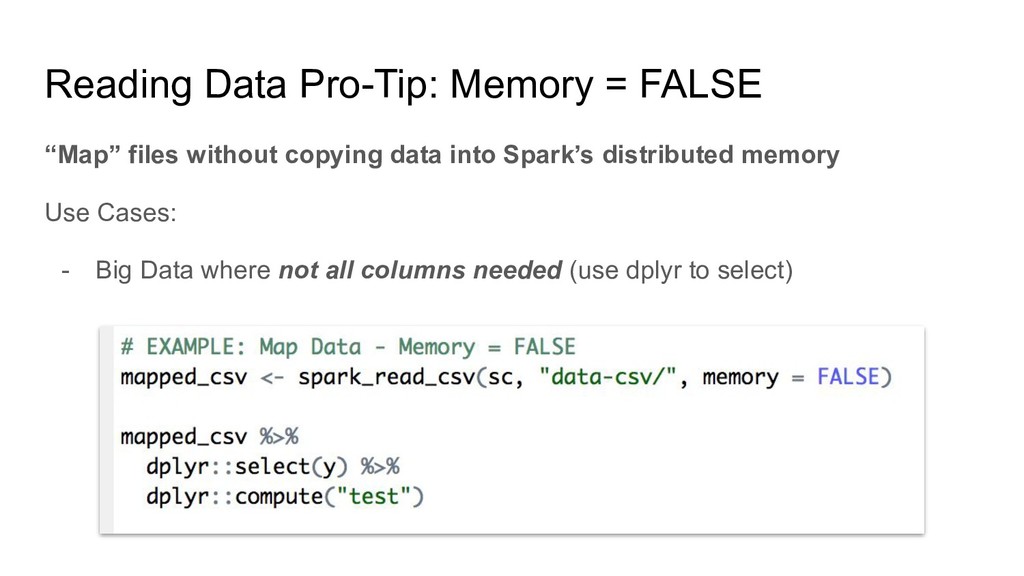
but at a cost (time). For medium-large datasets, or files that are read many times, cost accumulates. Provide a `columns` argument to describe the schema.
CSV files: Use in sparklyr by passing to the options argument Permissive Inserts NULL values for missing tokens Drop Malformed Drops lines that are malformed Fail Fast Aborts if it encounters any malformed line
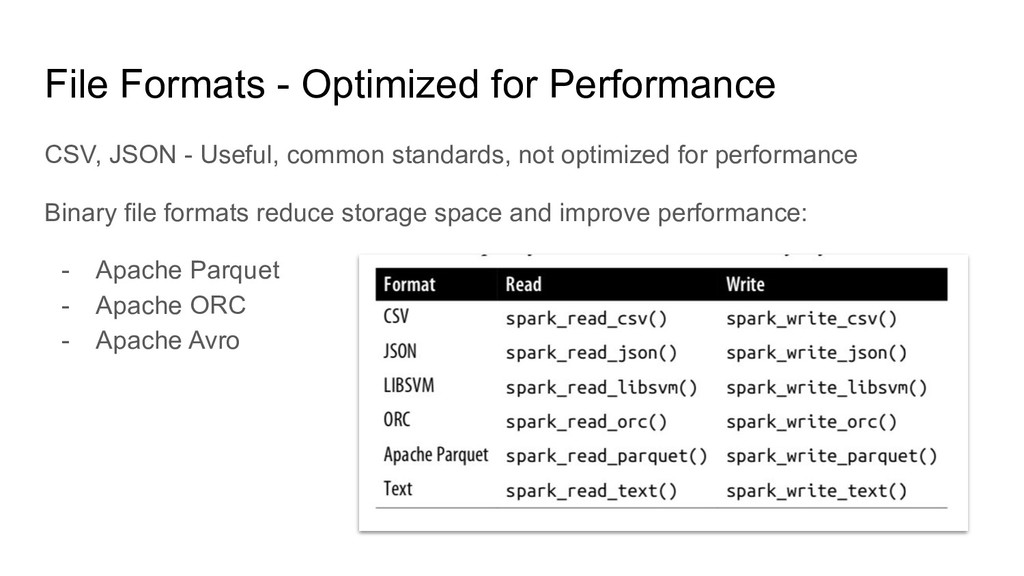
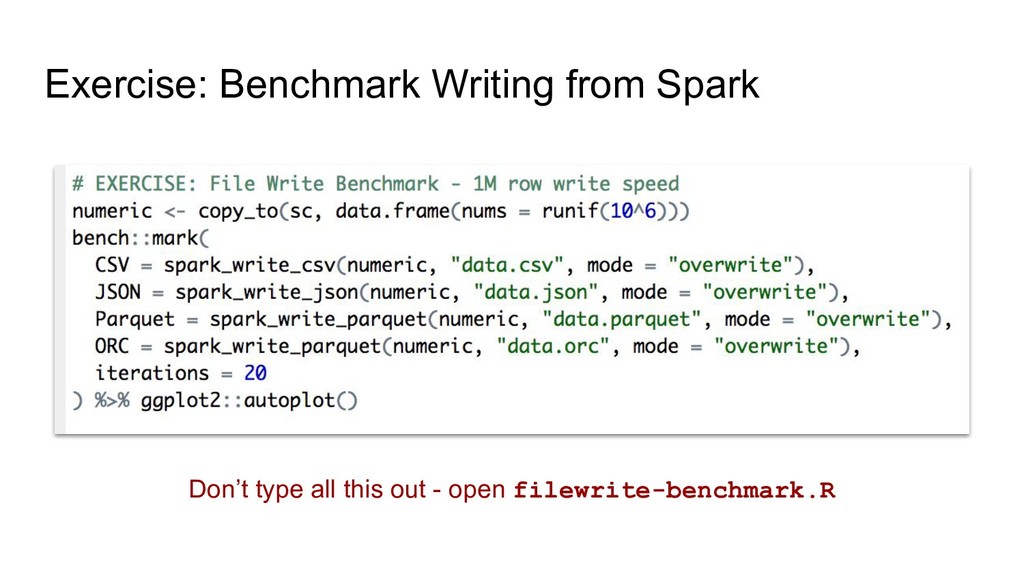
common standards, not optimized for performance Binary file formats reduce storage space and improve performance: - Apache Parquet - Apache ORC - Apache Avro
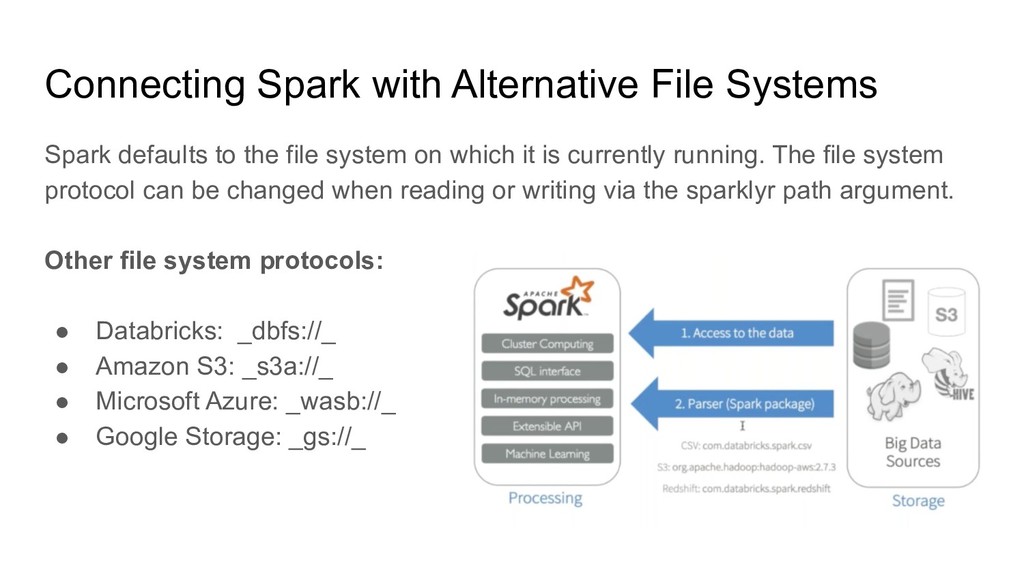
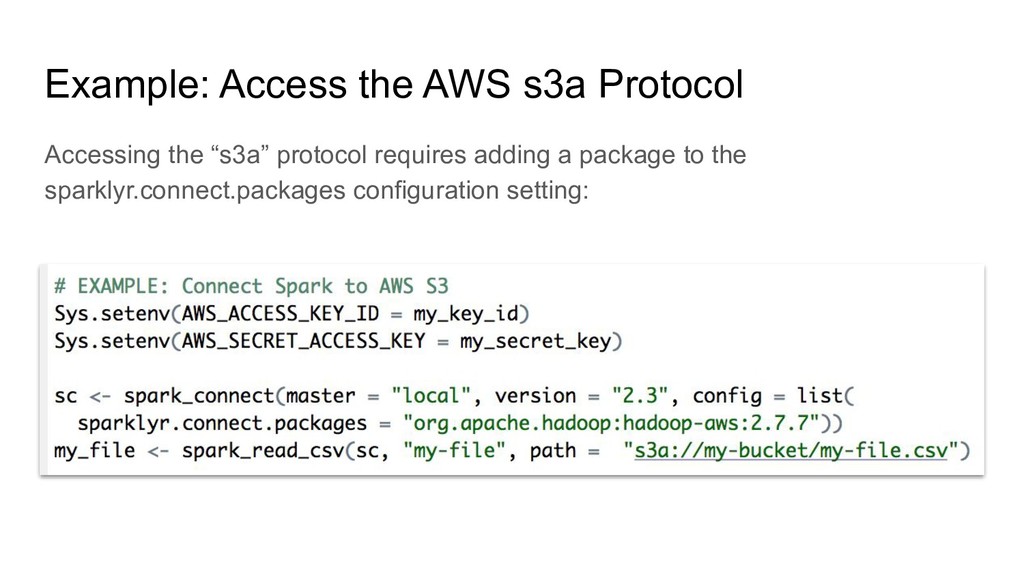
file system on which it is currently running. The file system protocol can be changed when reading or writing via the sparklyr path argument. Other file system protocols: • Databricks: _dbfs://_ • Amazon S3: _s3a://_ • Microsoft Azure: _wasb://_ • Google Storage: _gs://_
sources Transform: dplyr, SQL, feature transformers, scoring pipelines, distributed R code Write: stream_write_*() functions - define one or more sinks
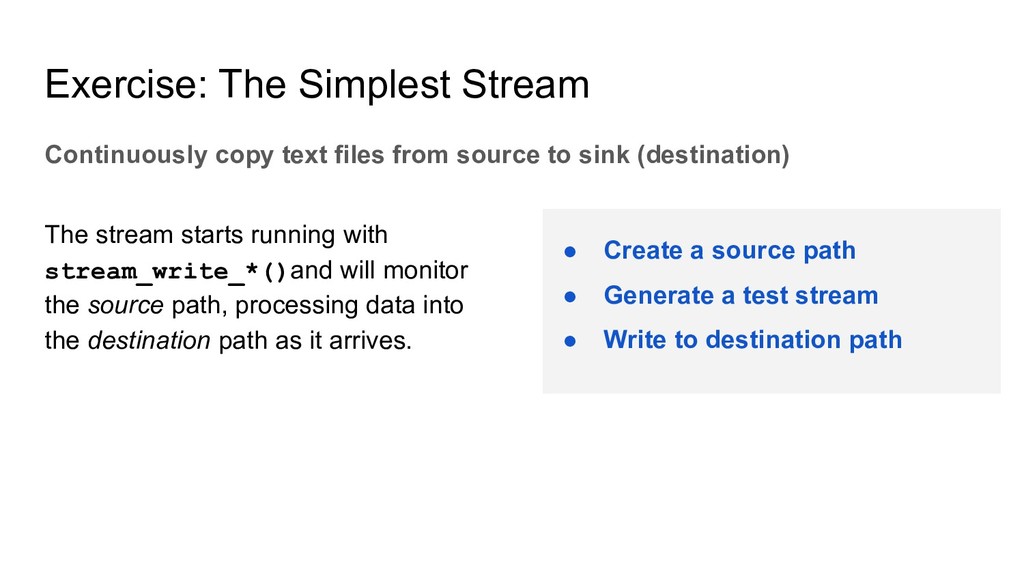
to sink (destination) • Create a source path • Generate a test stream • Write to destination path The stream starts running with stream_write_*()and will monitor the source path, processing data into the destination path as it arrives.
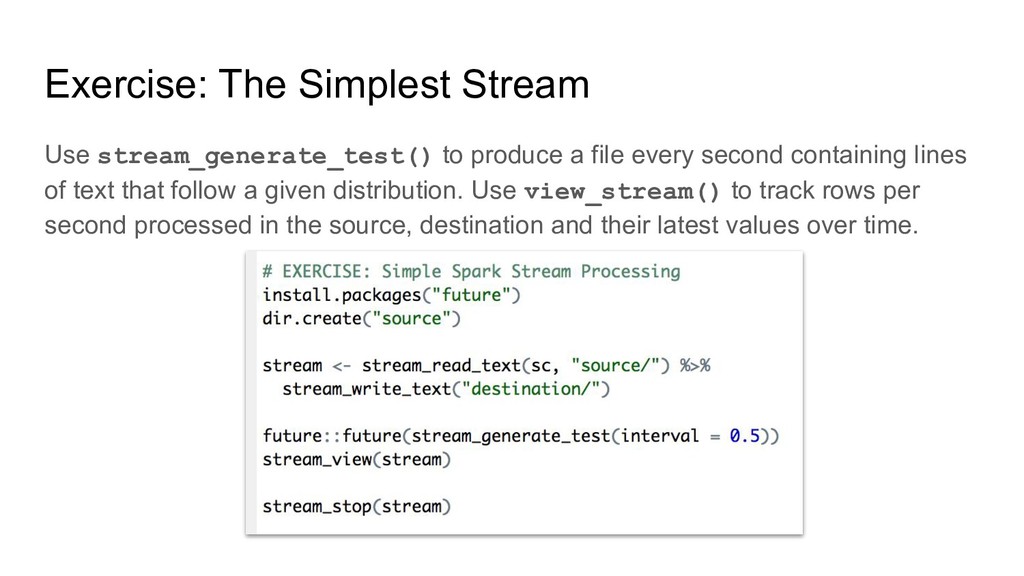
every second containing lines of text that follow a given distribution. Use view_stream() to track rows per second processed in the source, destination and their latest values over time.
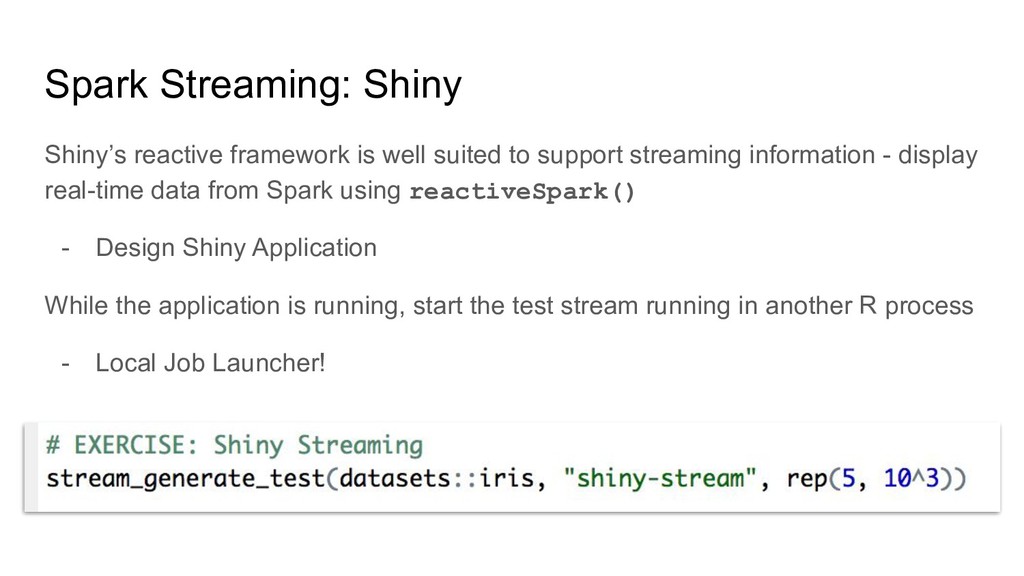
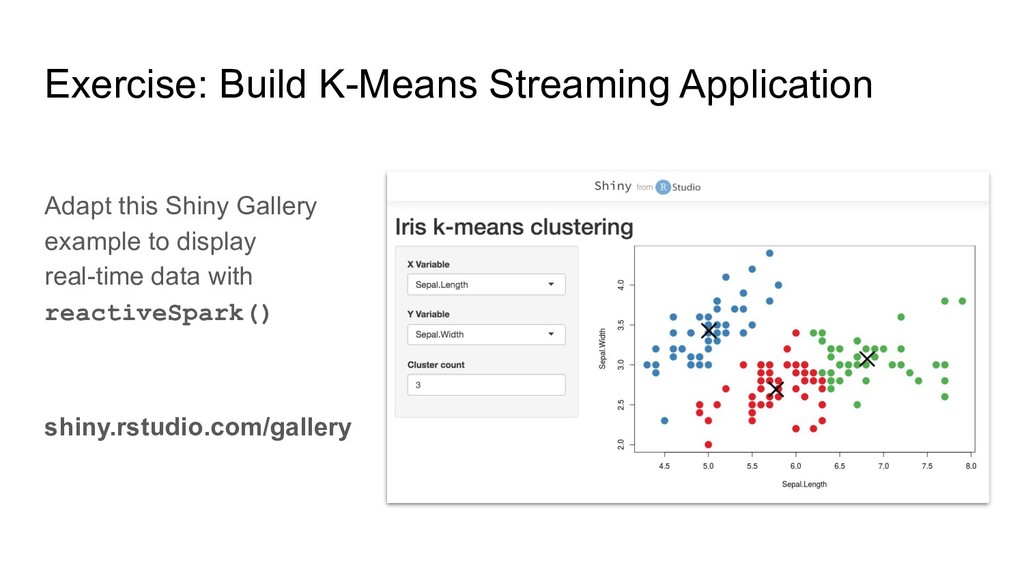
support streaming information - display real-time data from Spark using reactiveSpark() - Design Shiny Application While the application is running, start the test stream running in another R process - Local Job Launcher!