Upgrade to Pro — share decks privately, control downloads, hide ads and more …

AIBugHunter 2.0: Automated Defect Prediction, Explanation, Localization, and Repair

AIBugHunter 2.0: Automated Defect Prediction, Explanation, Localization, and Repair

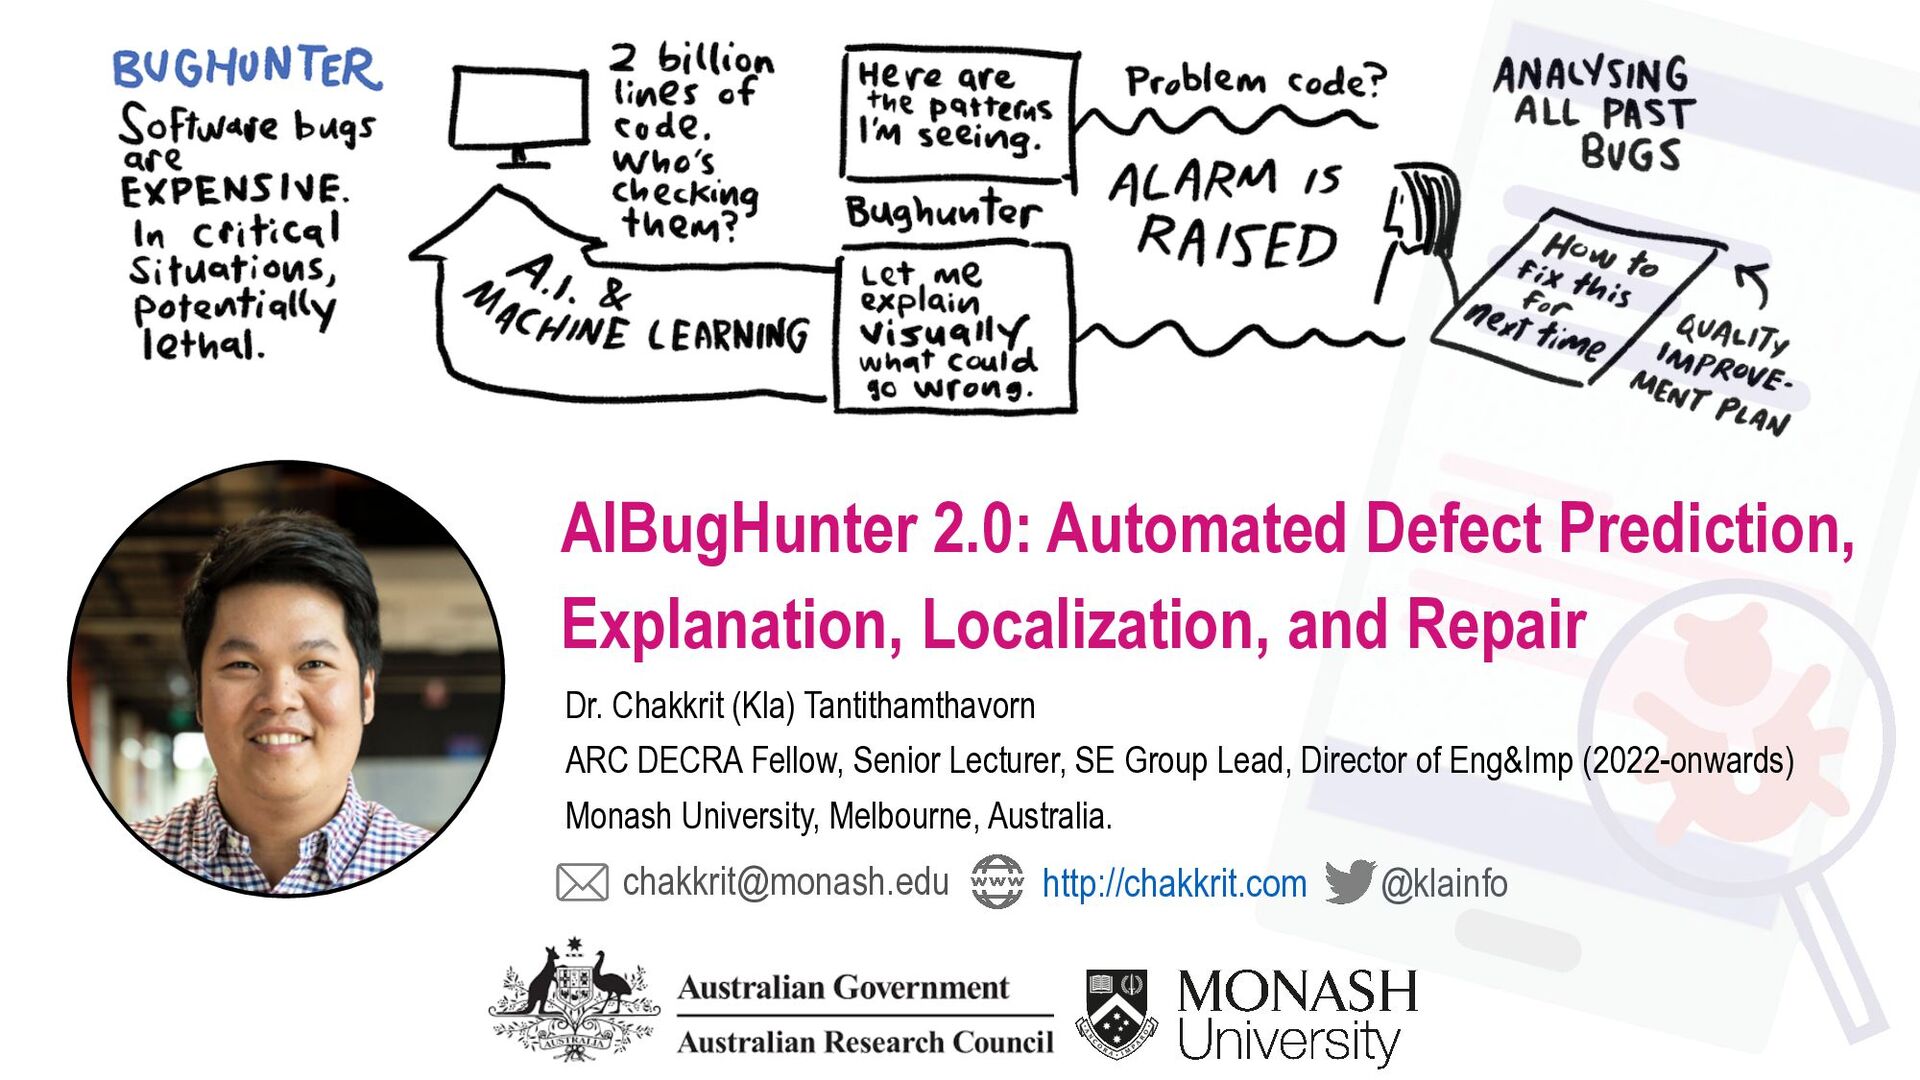
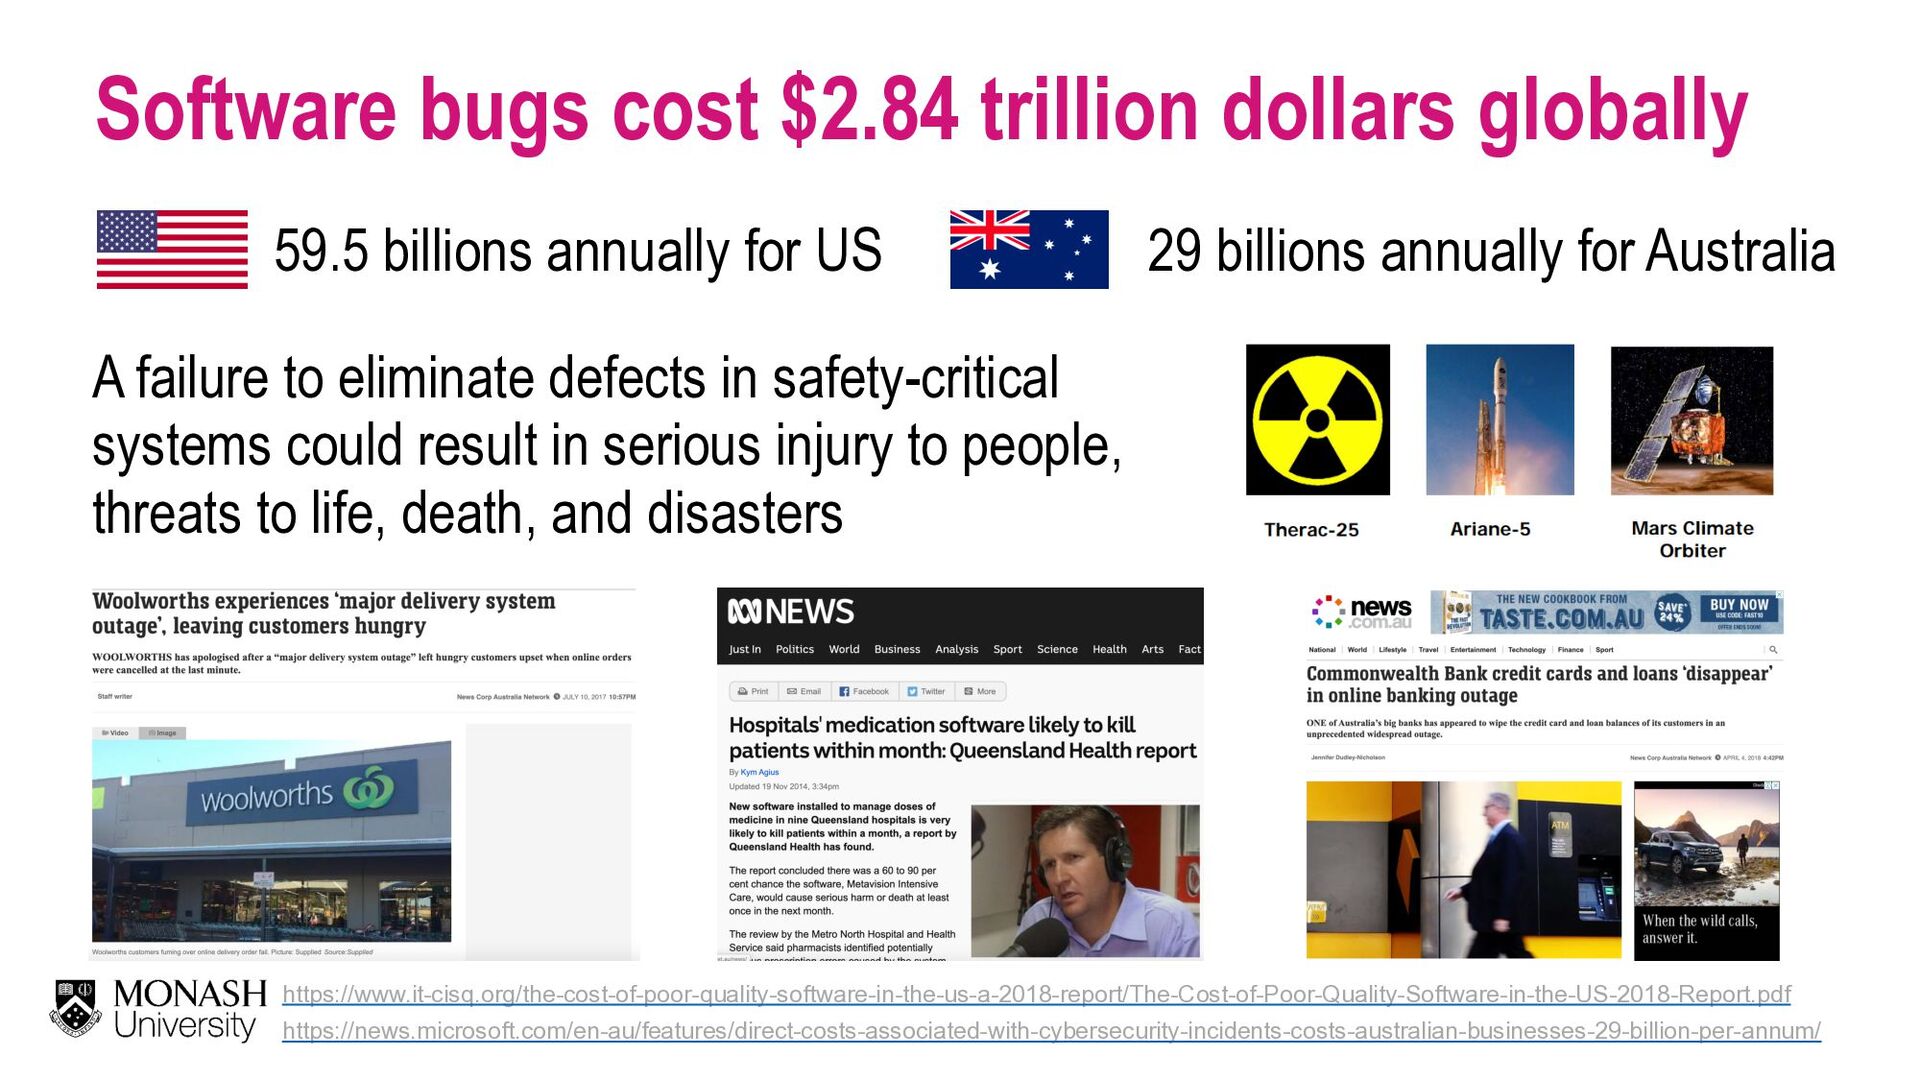
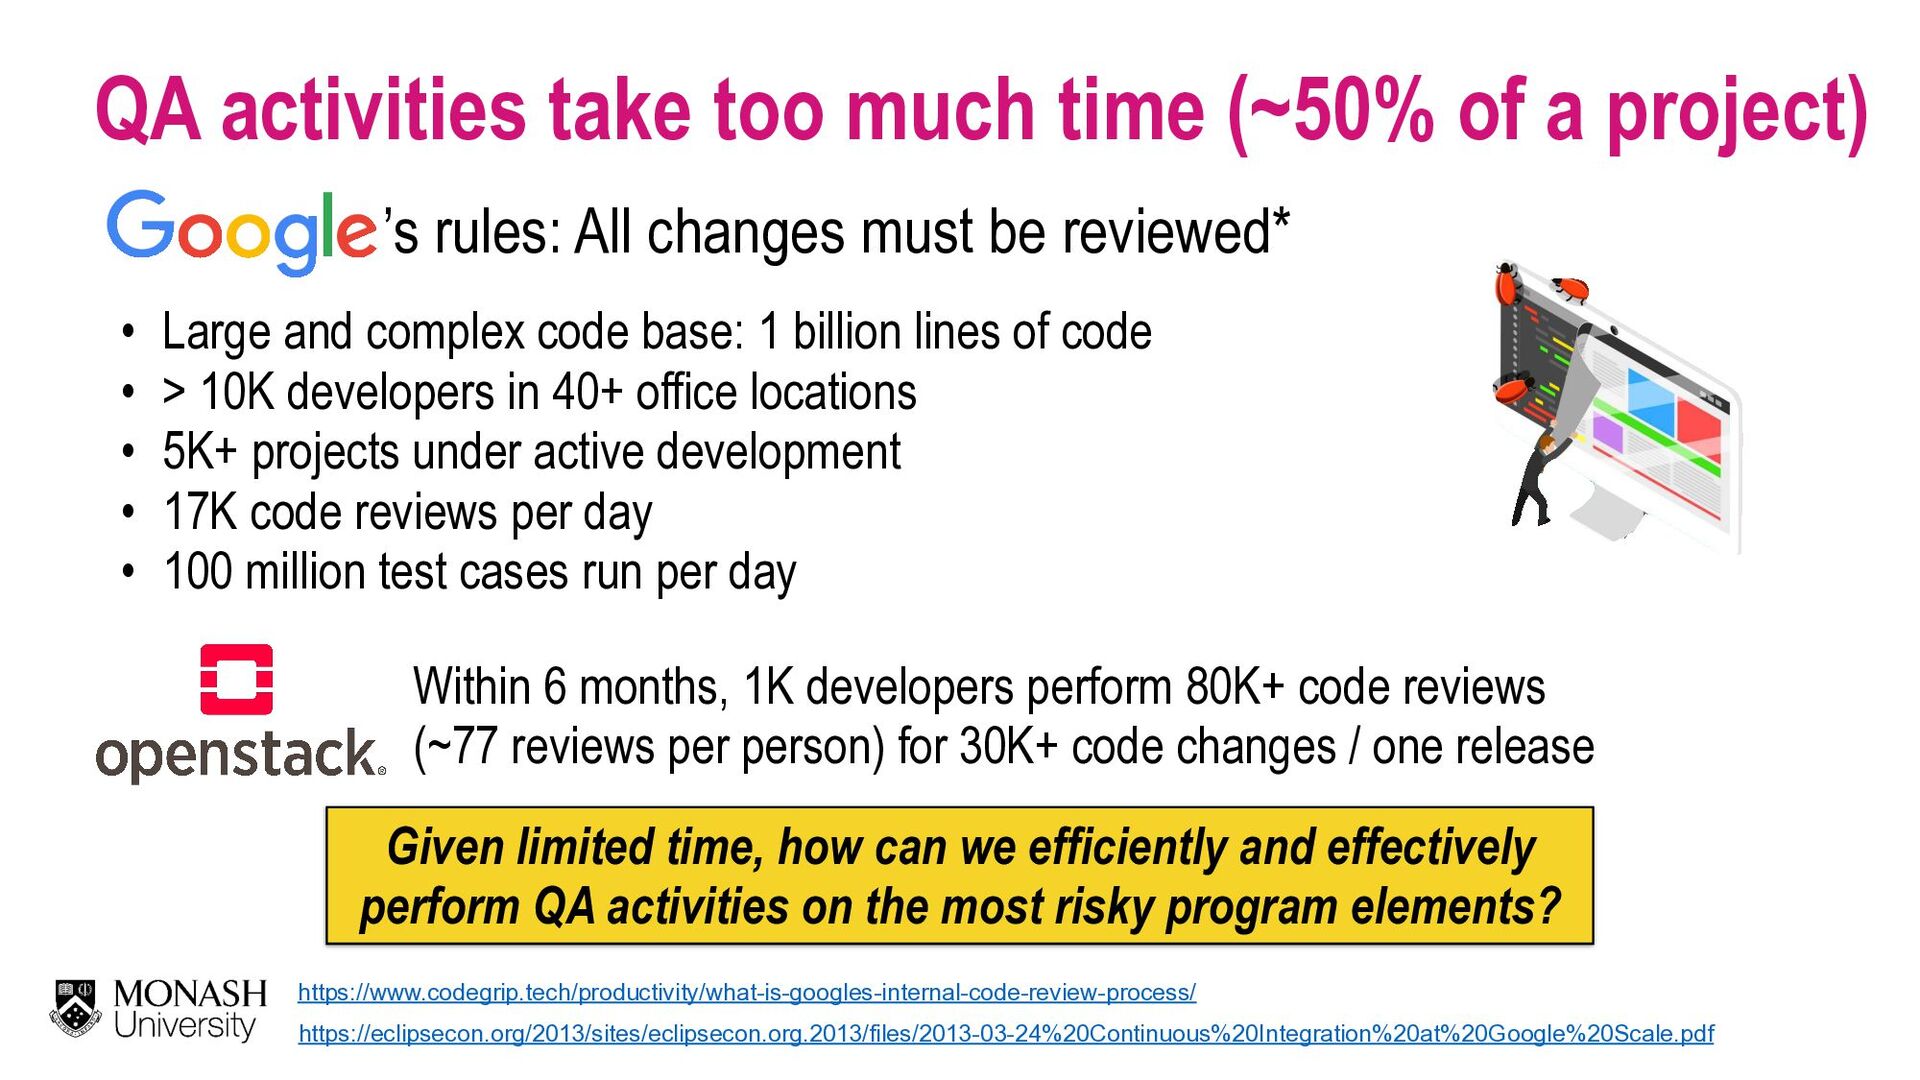
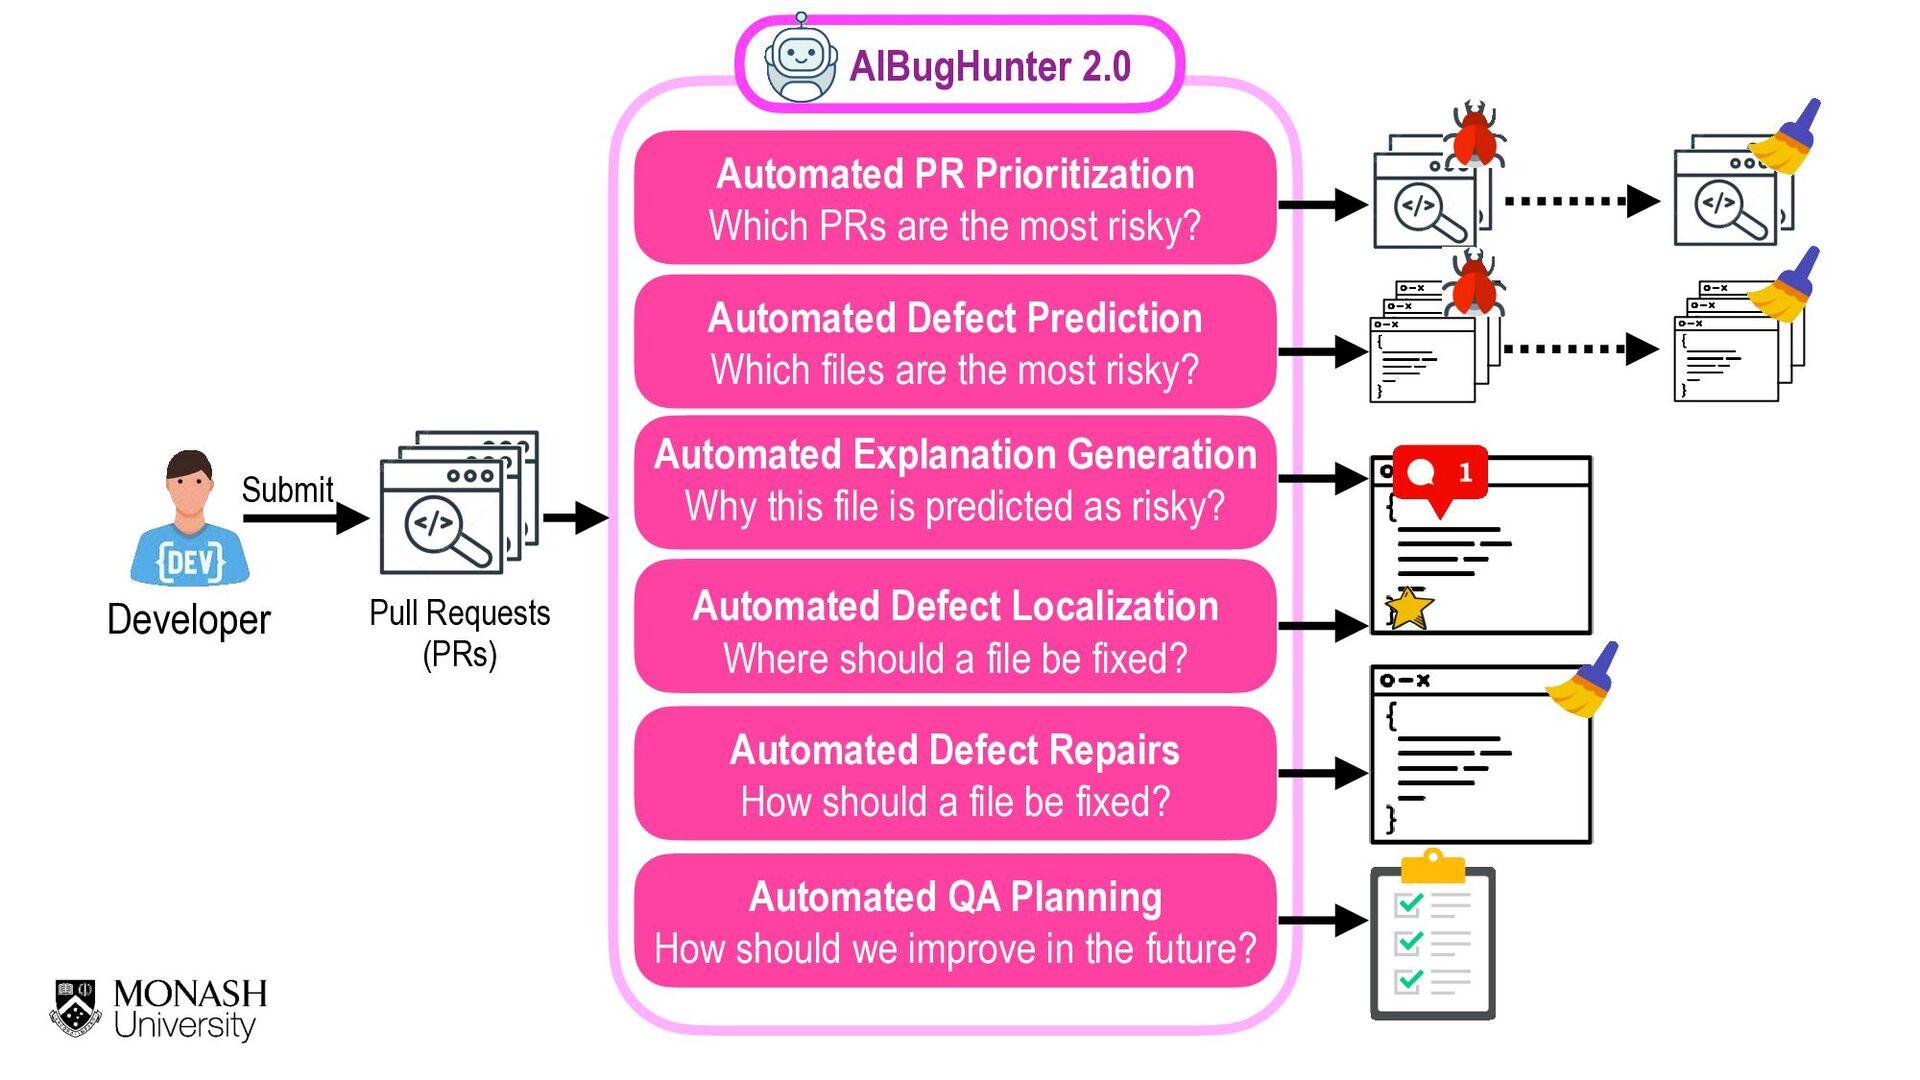
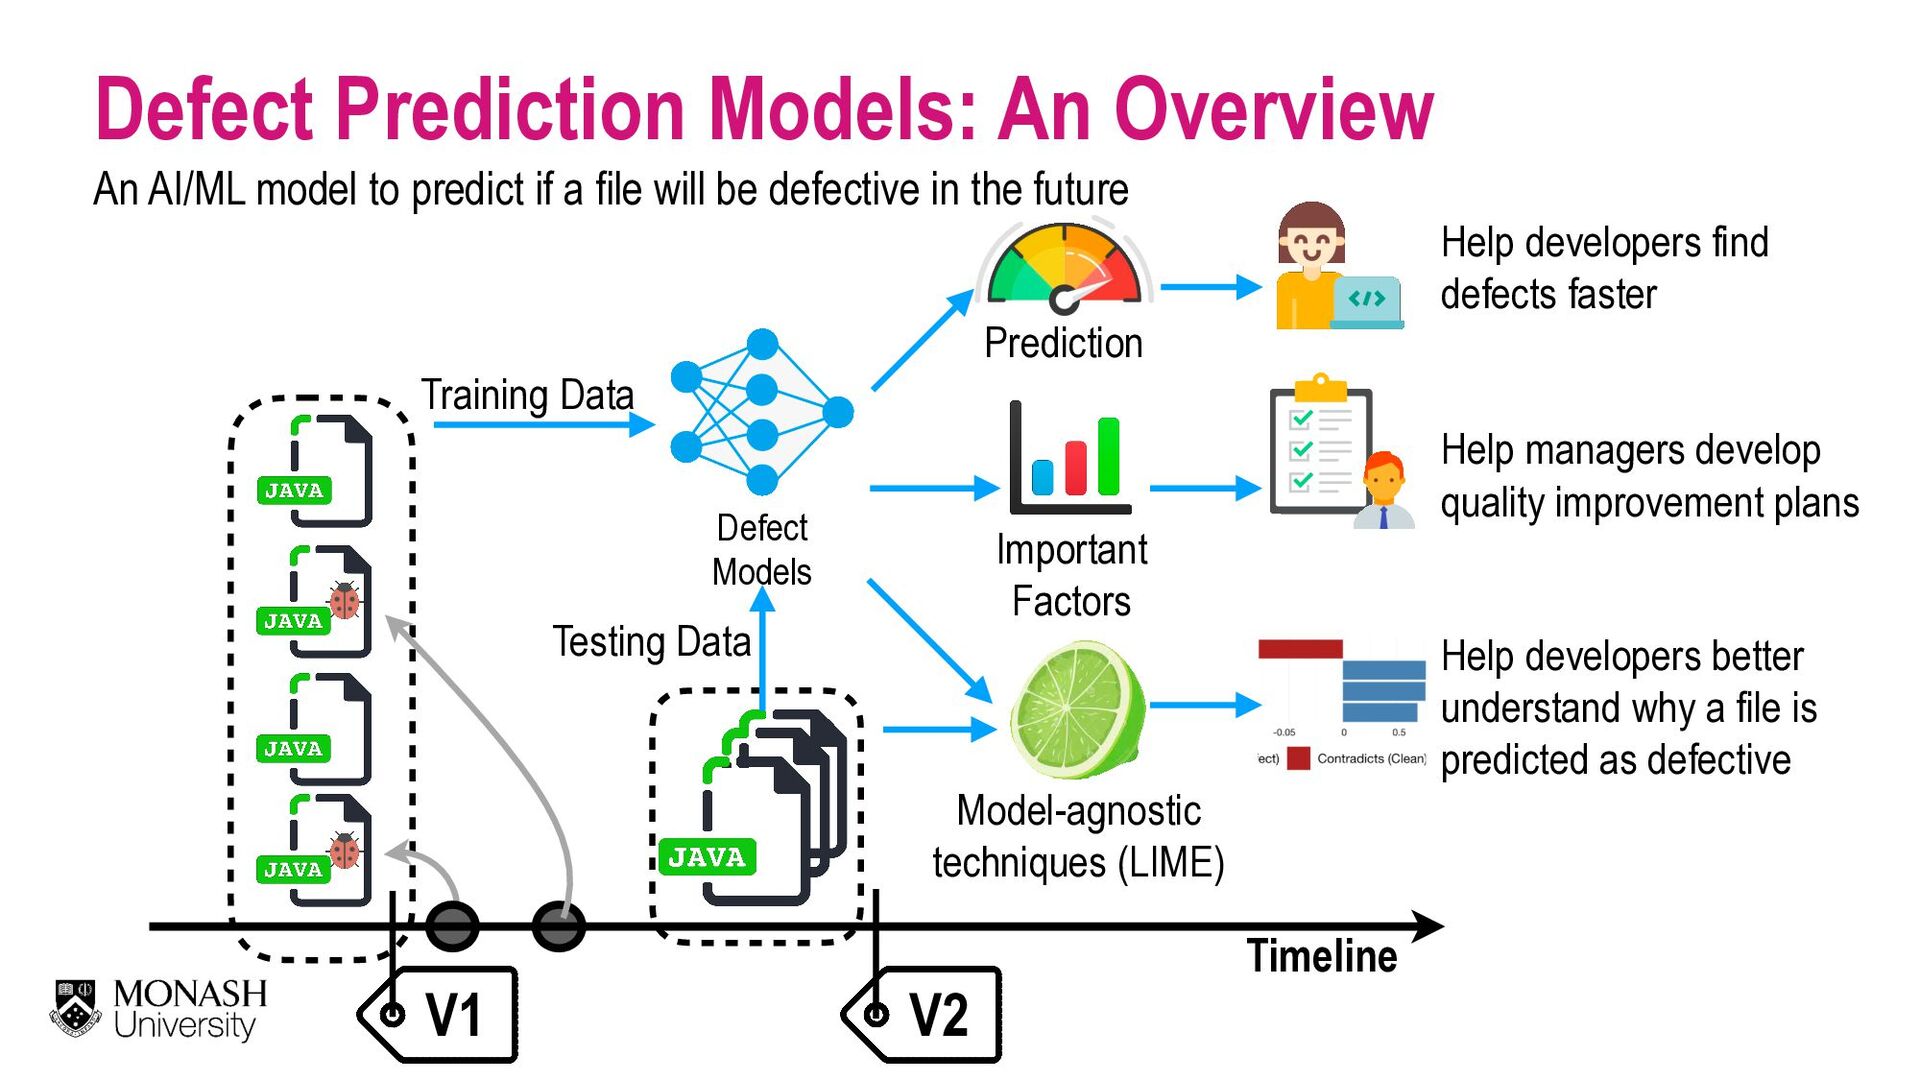
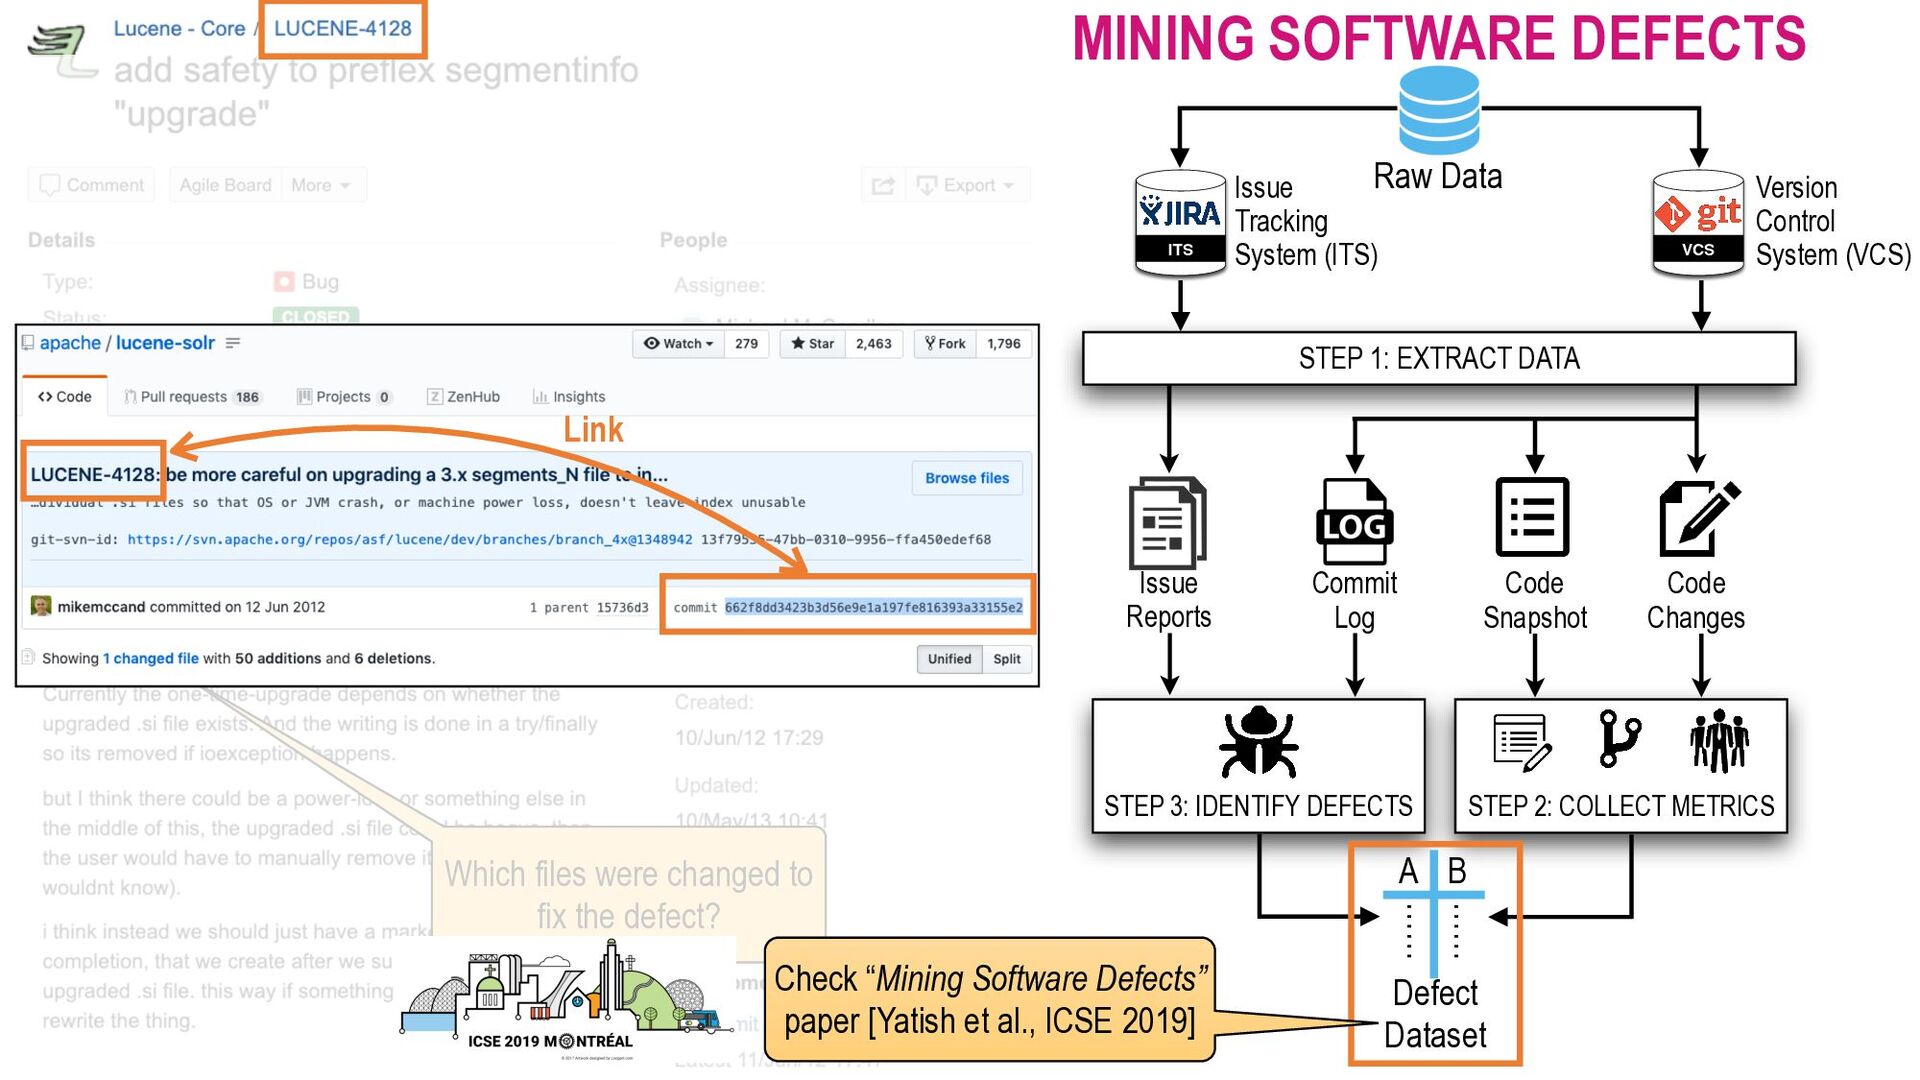
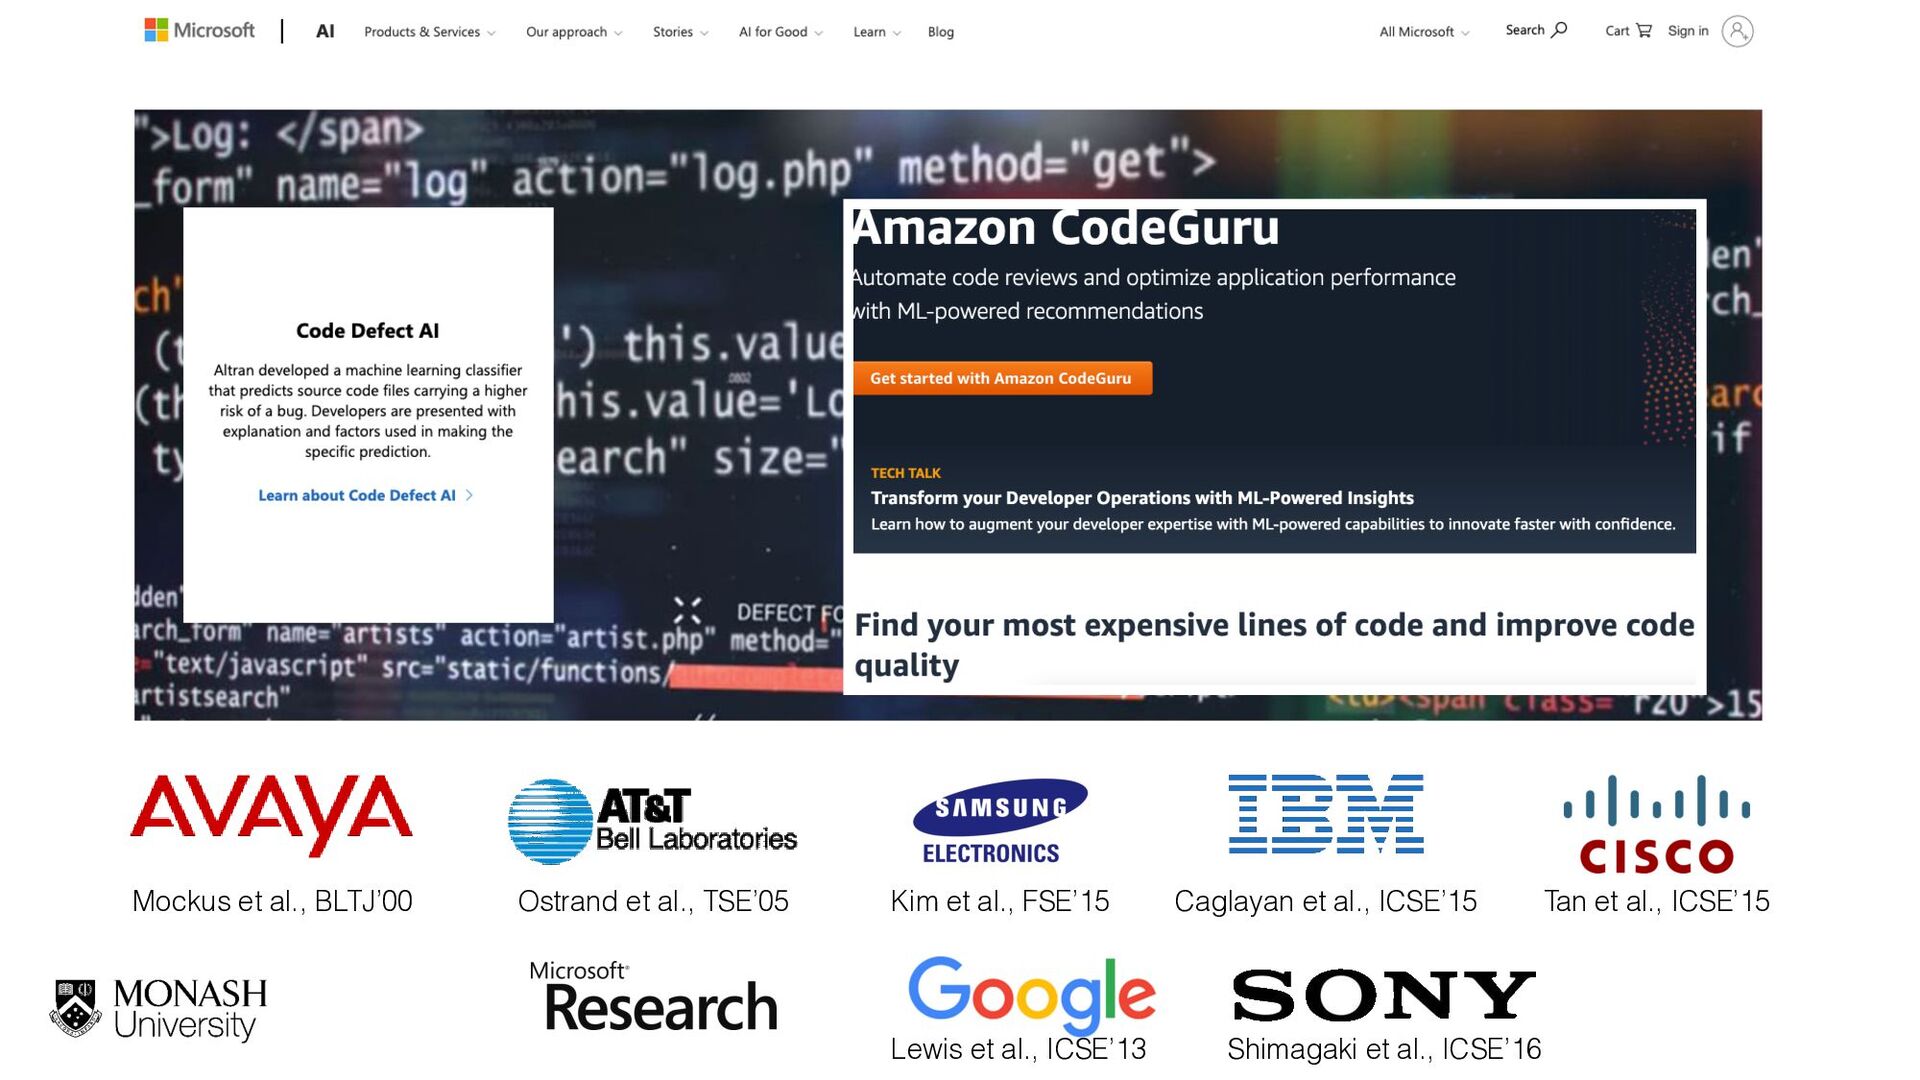
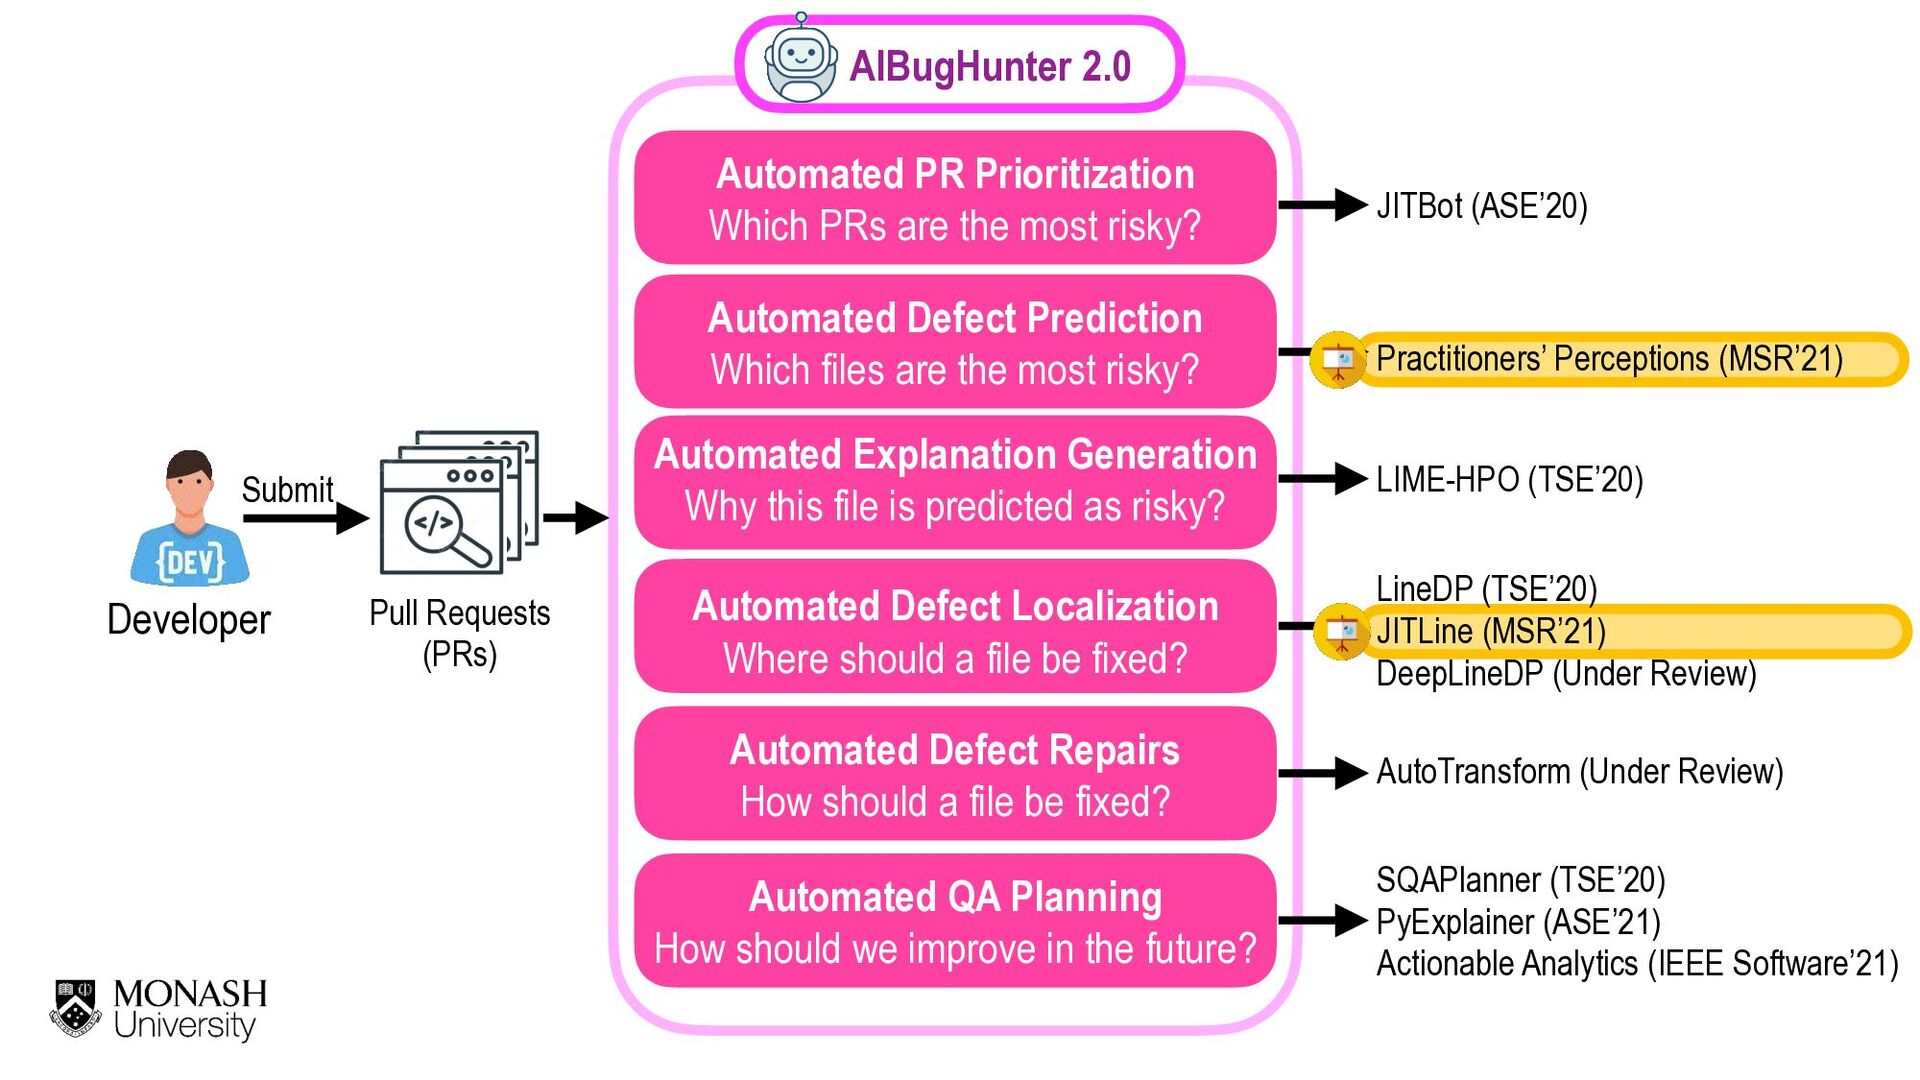
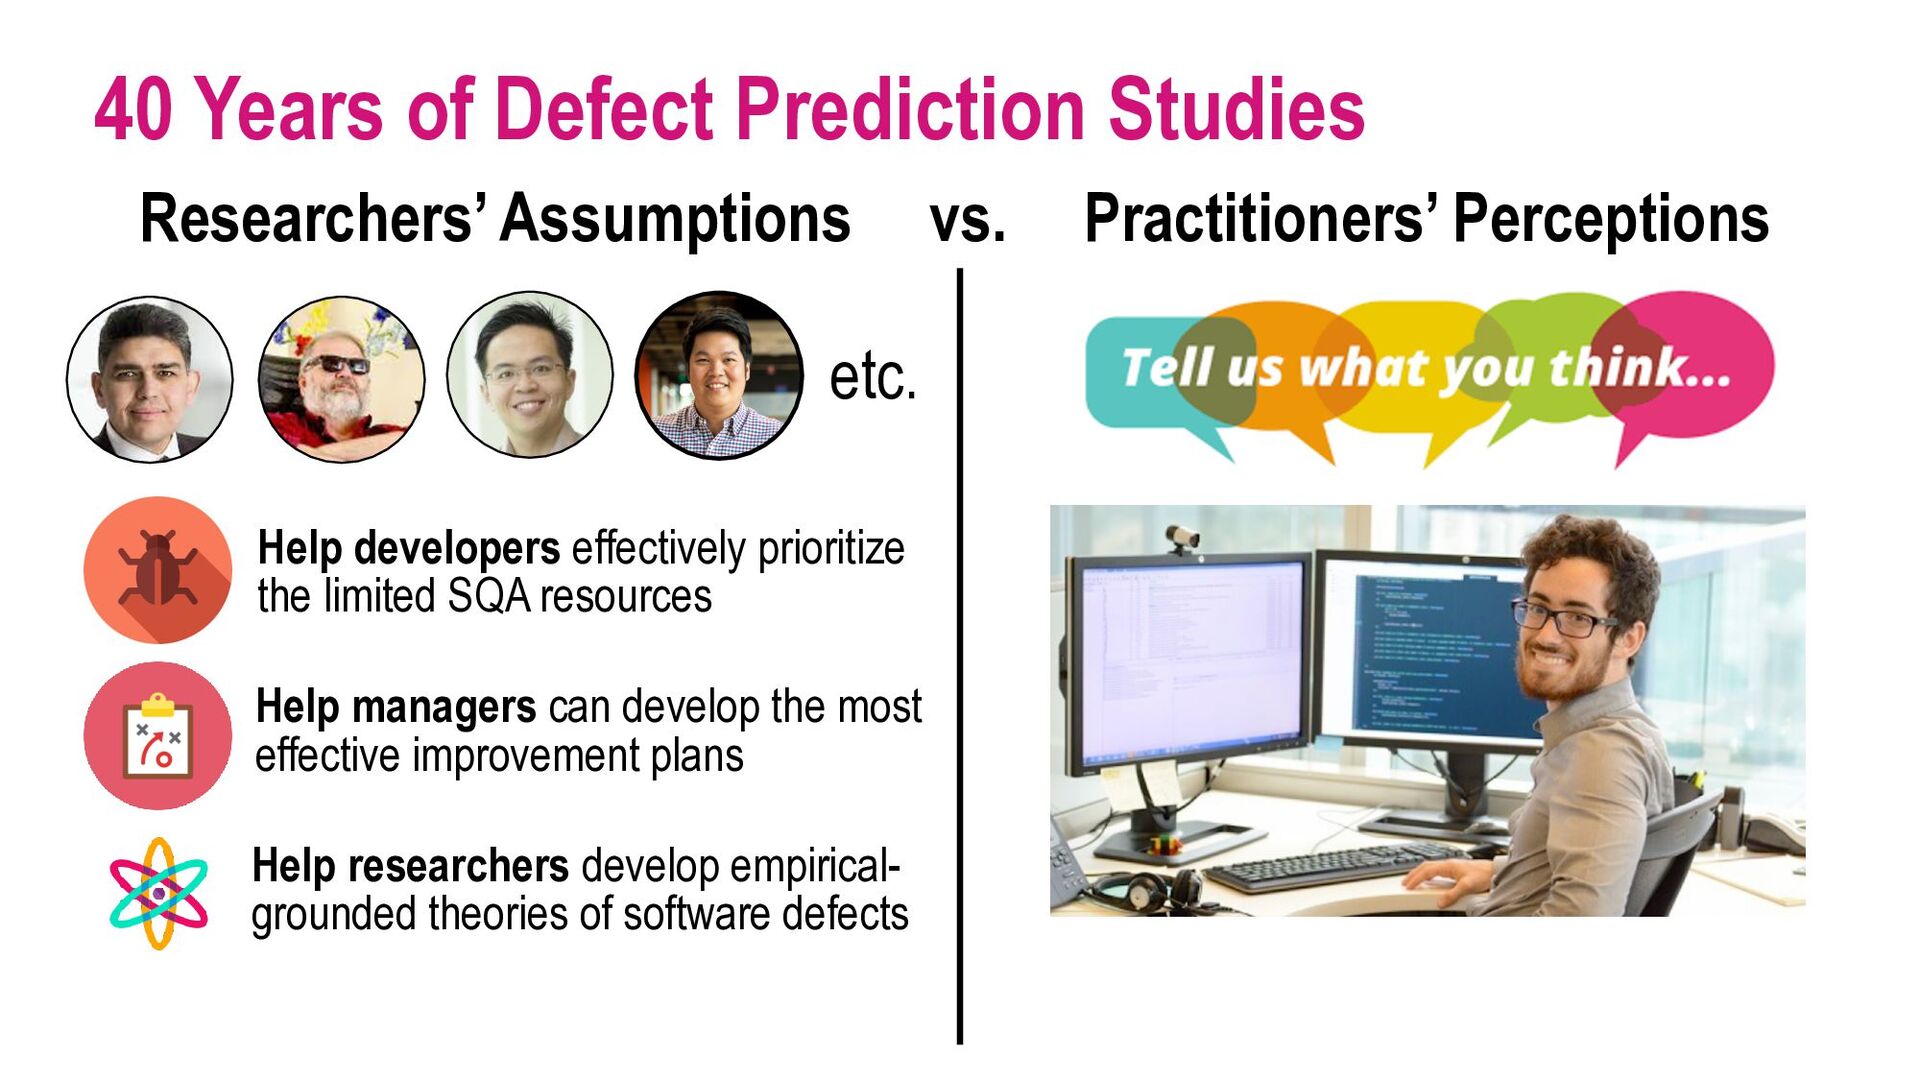
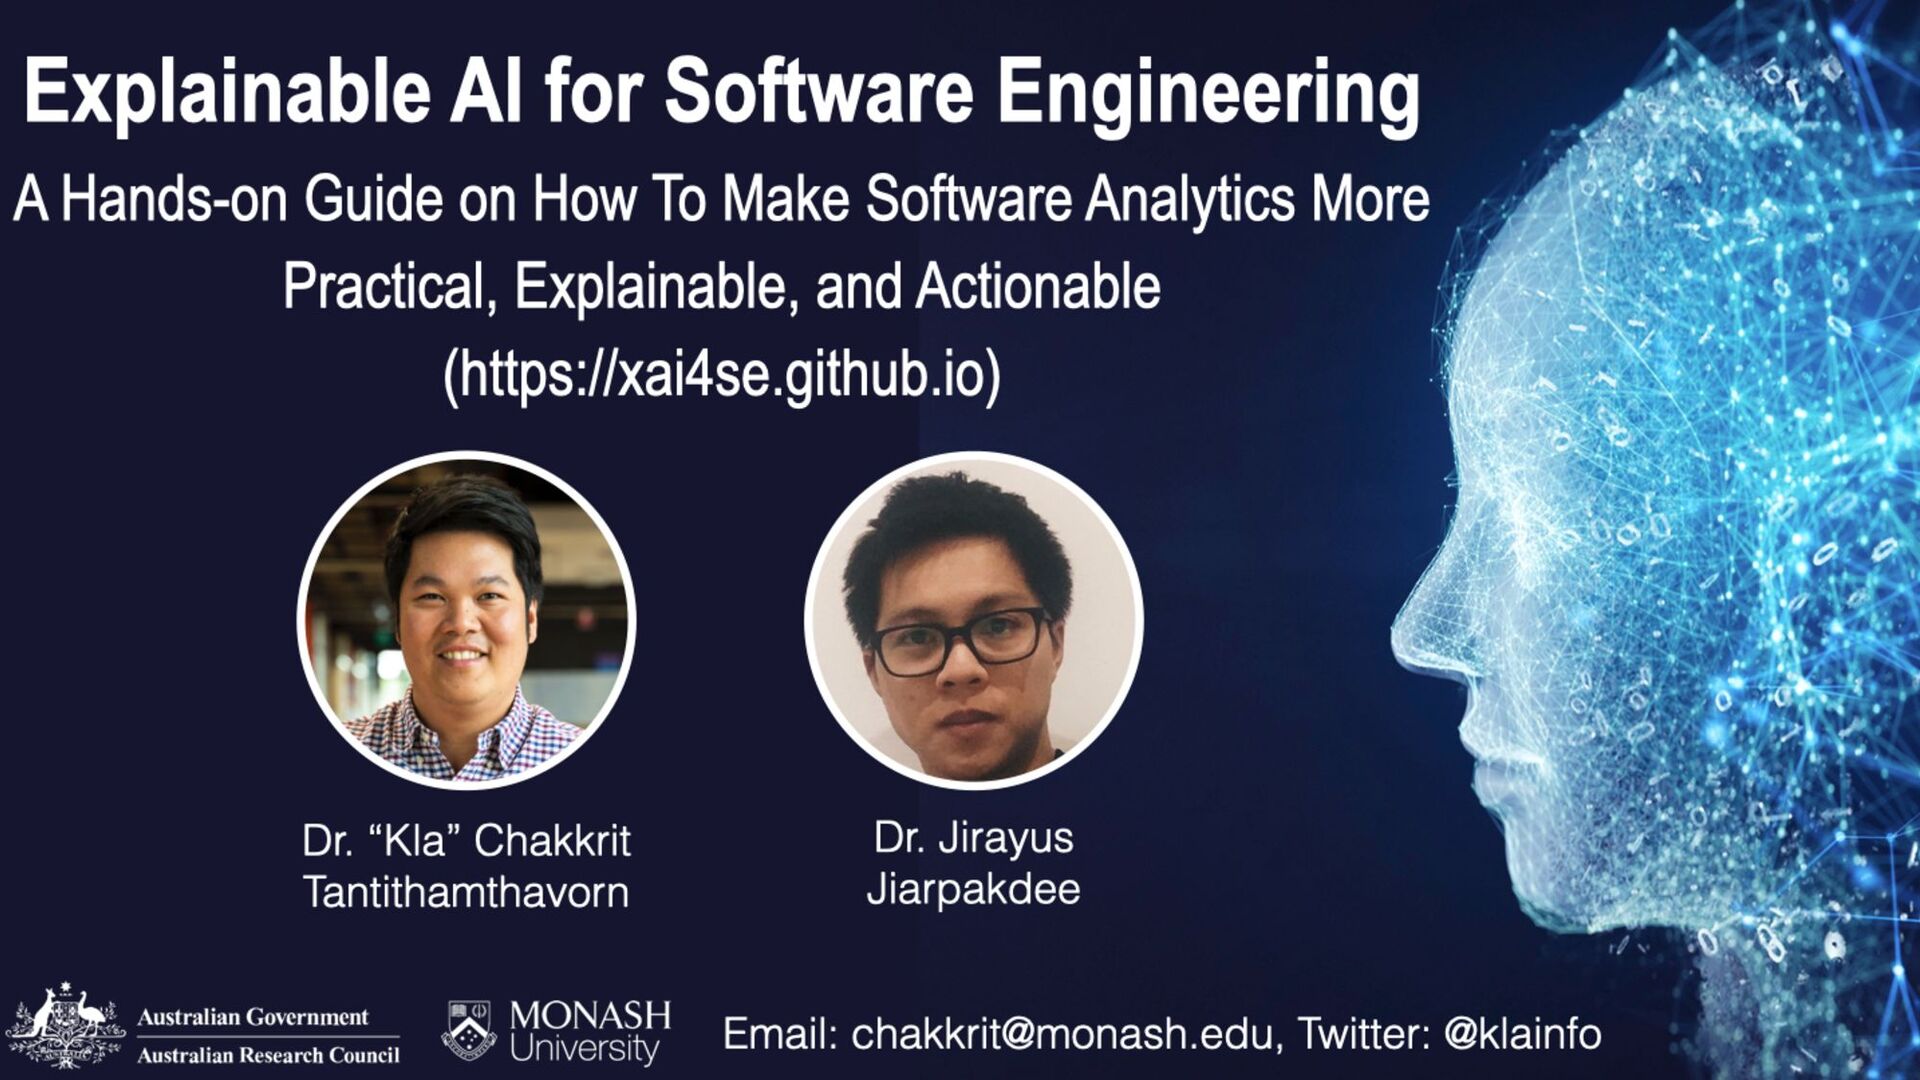
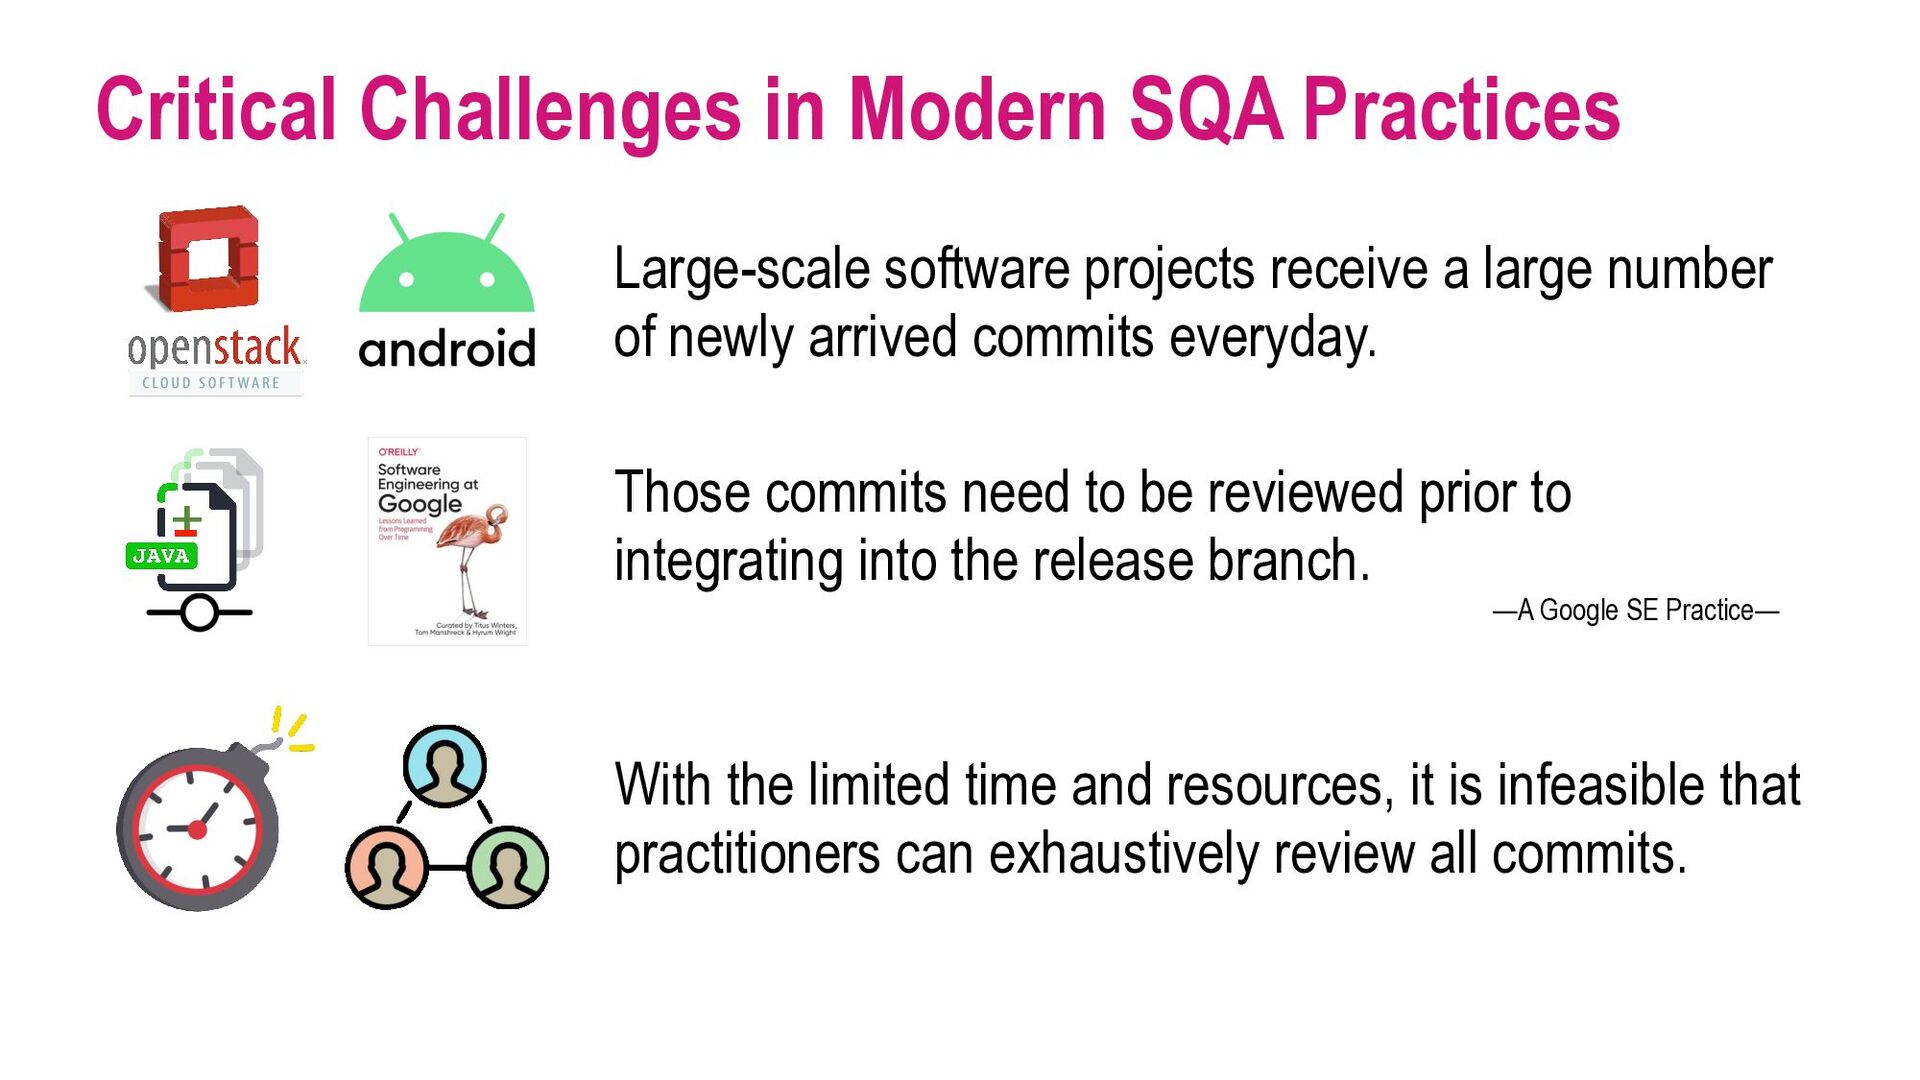
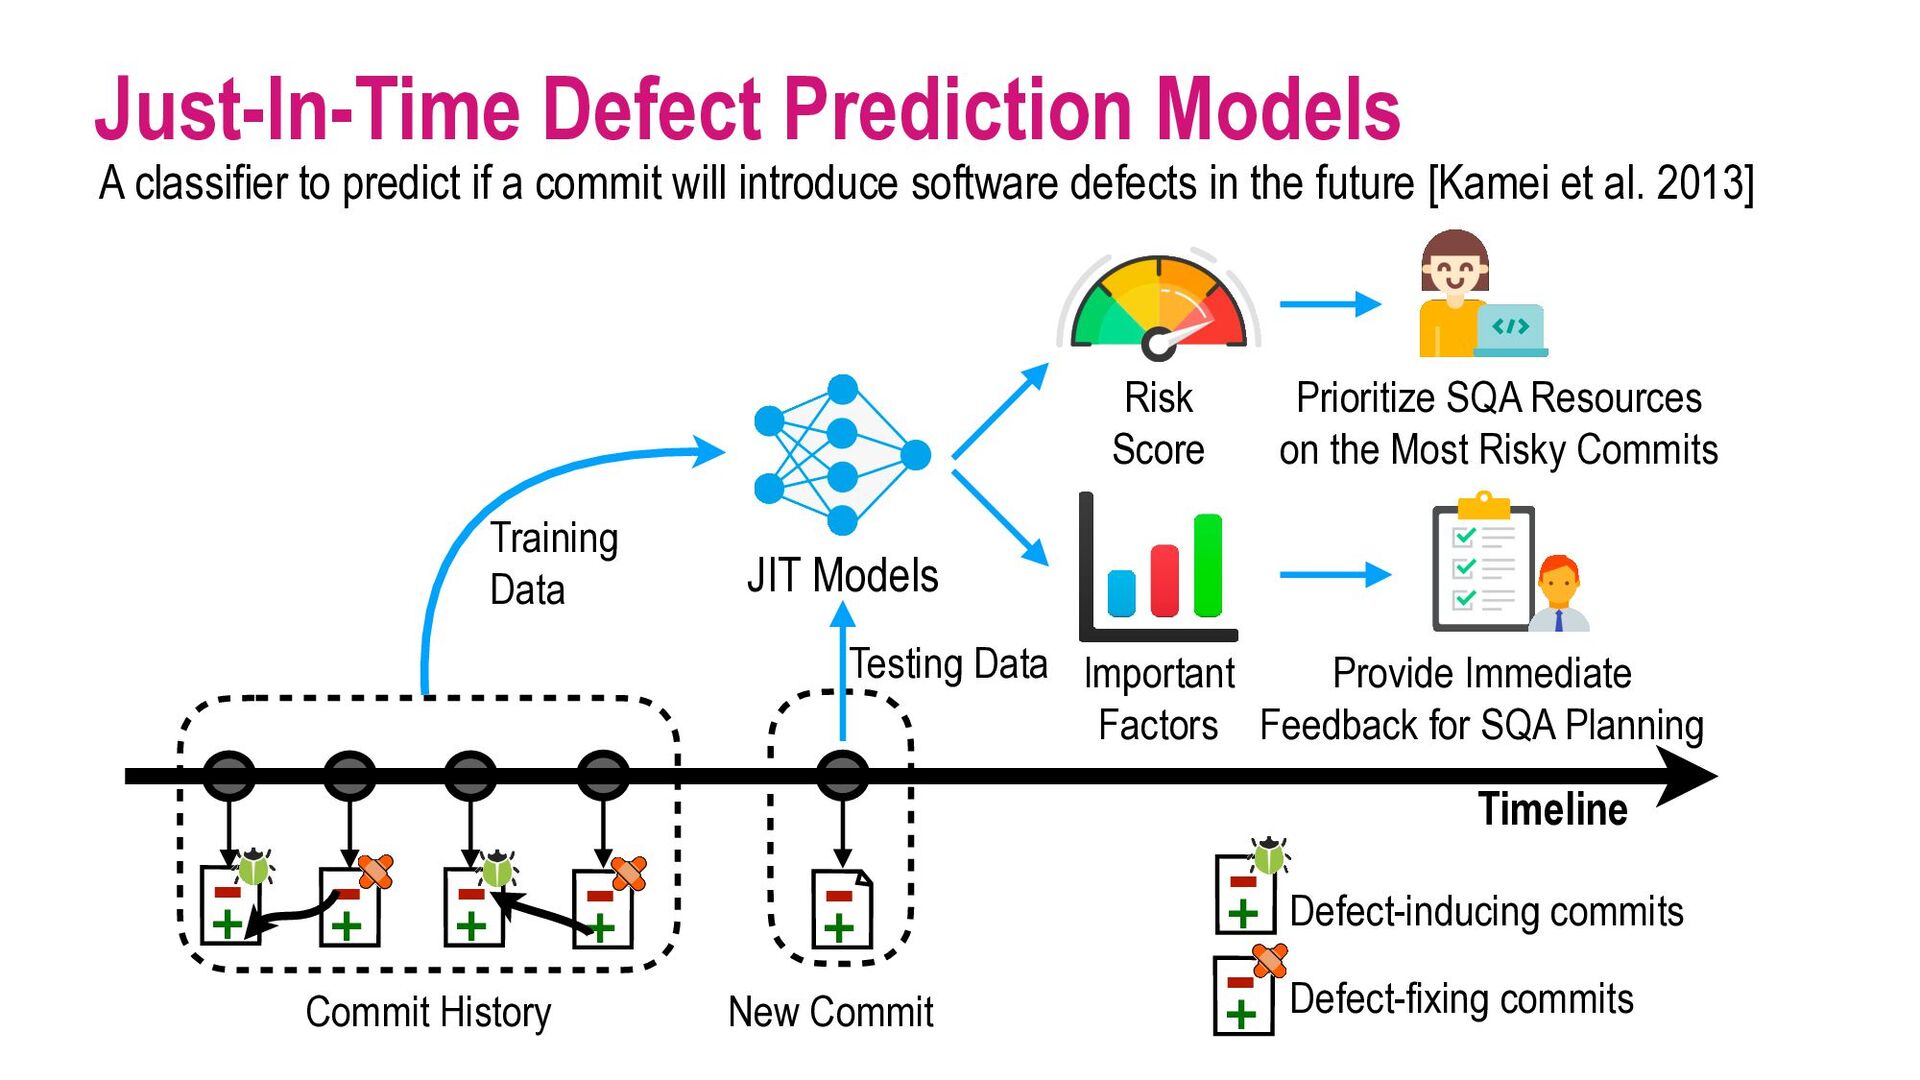
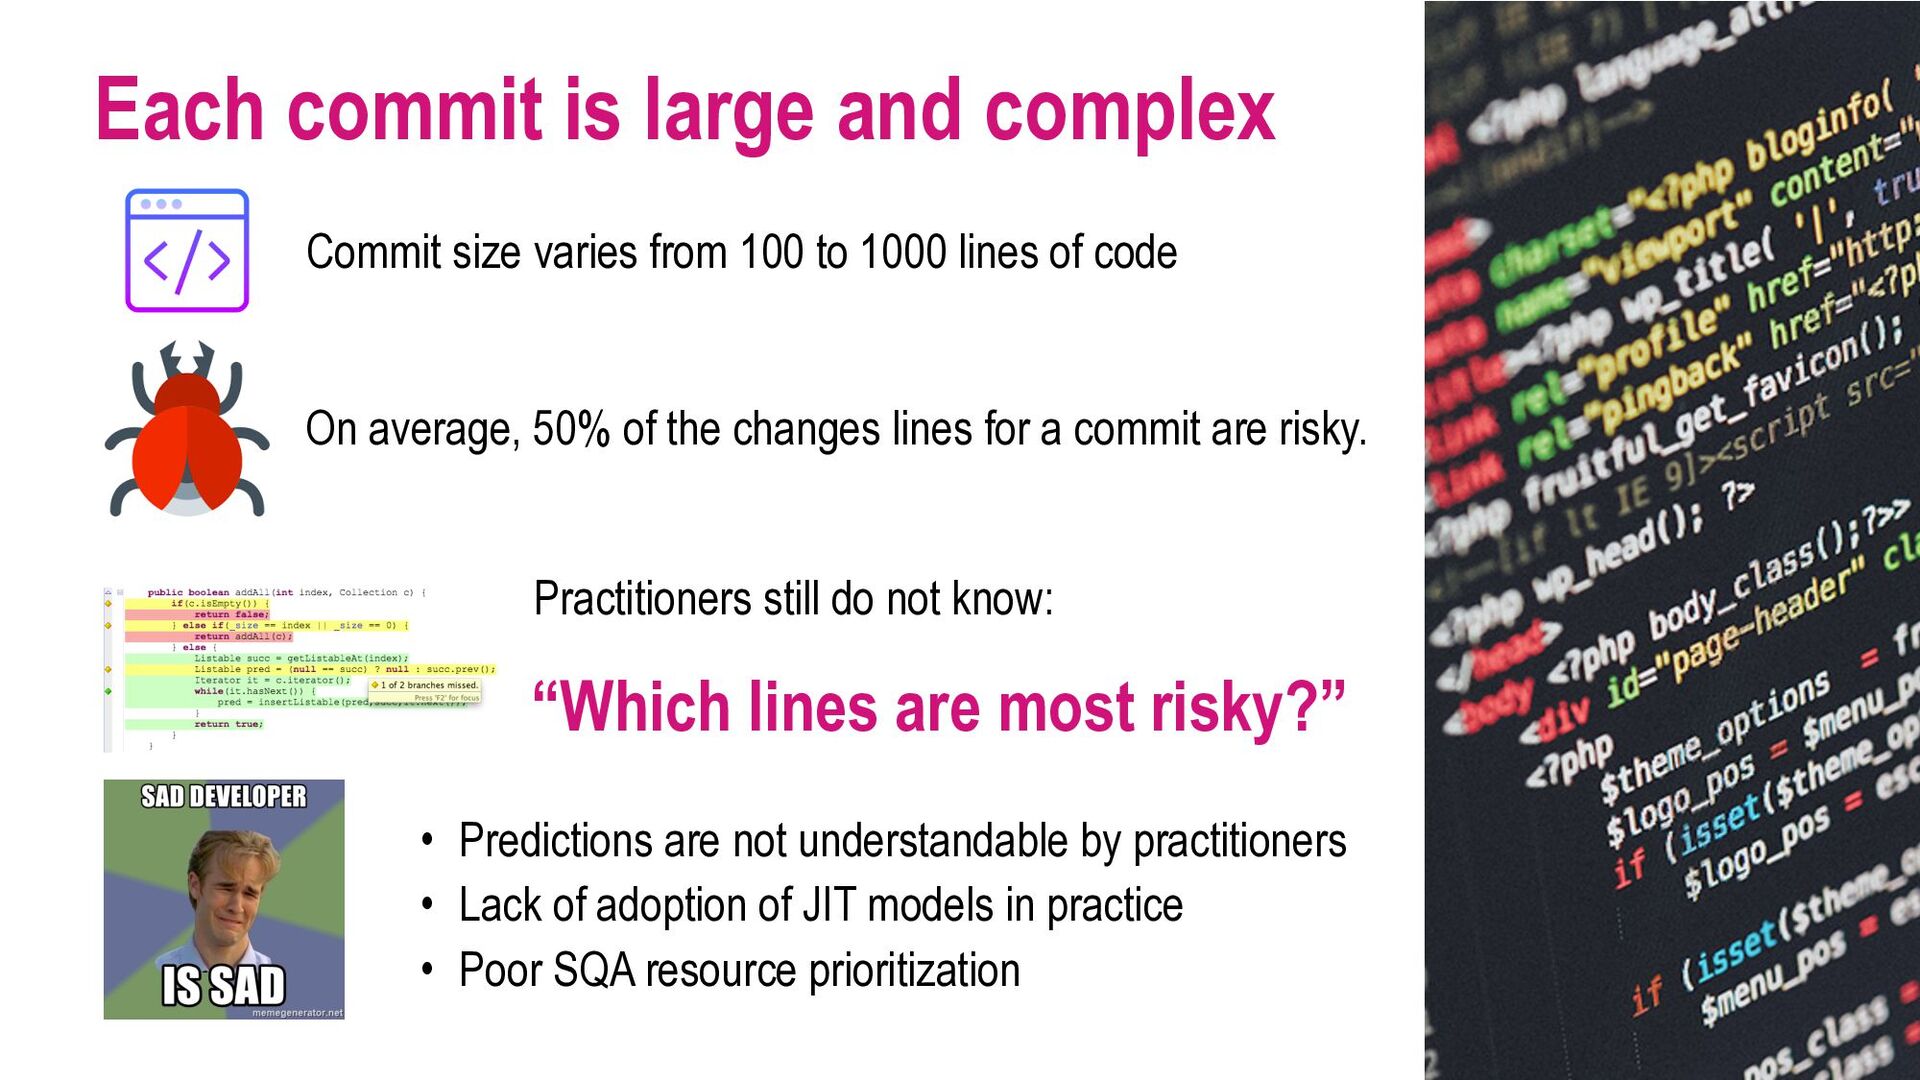
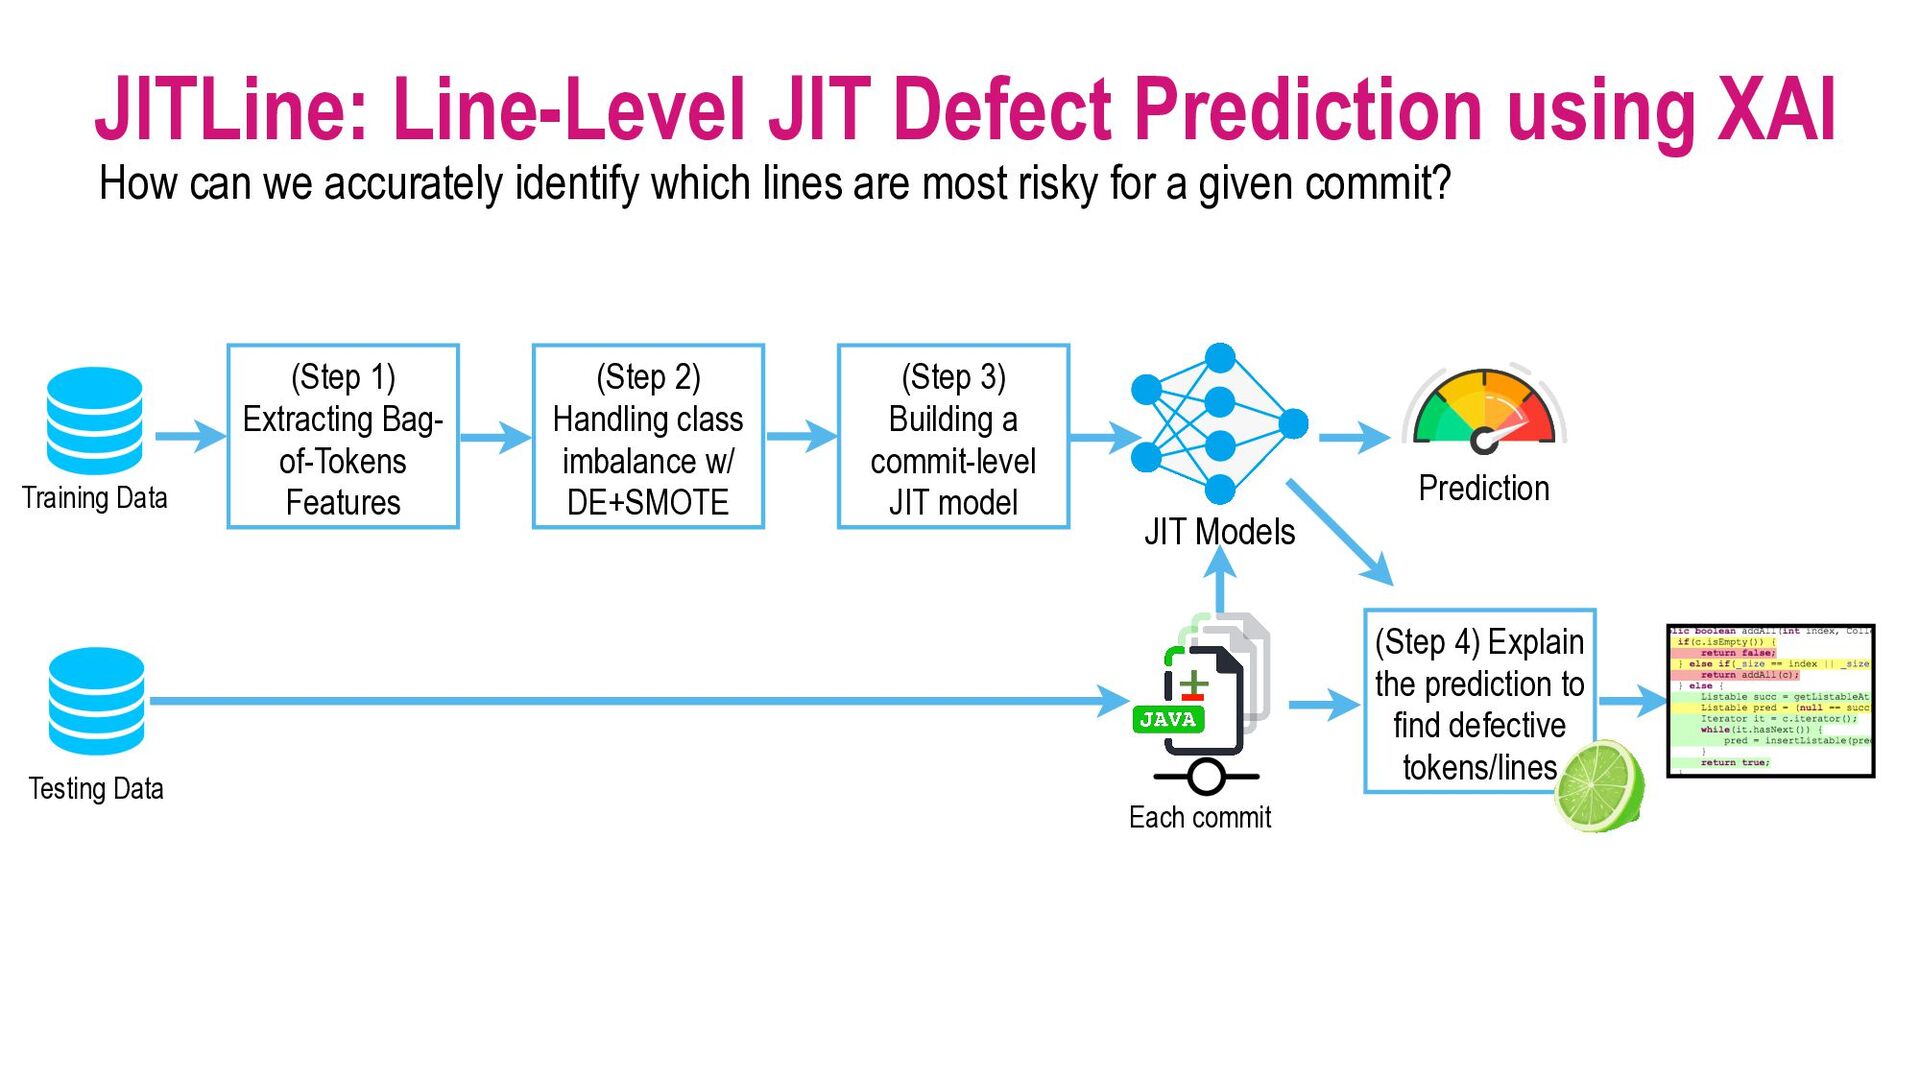
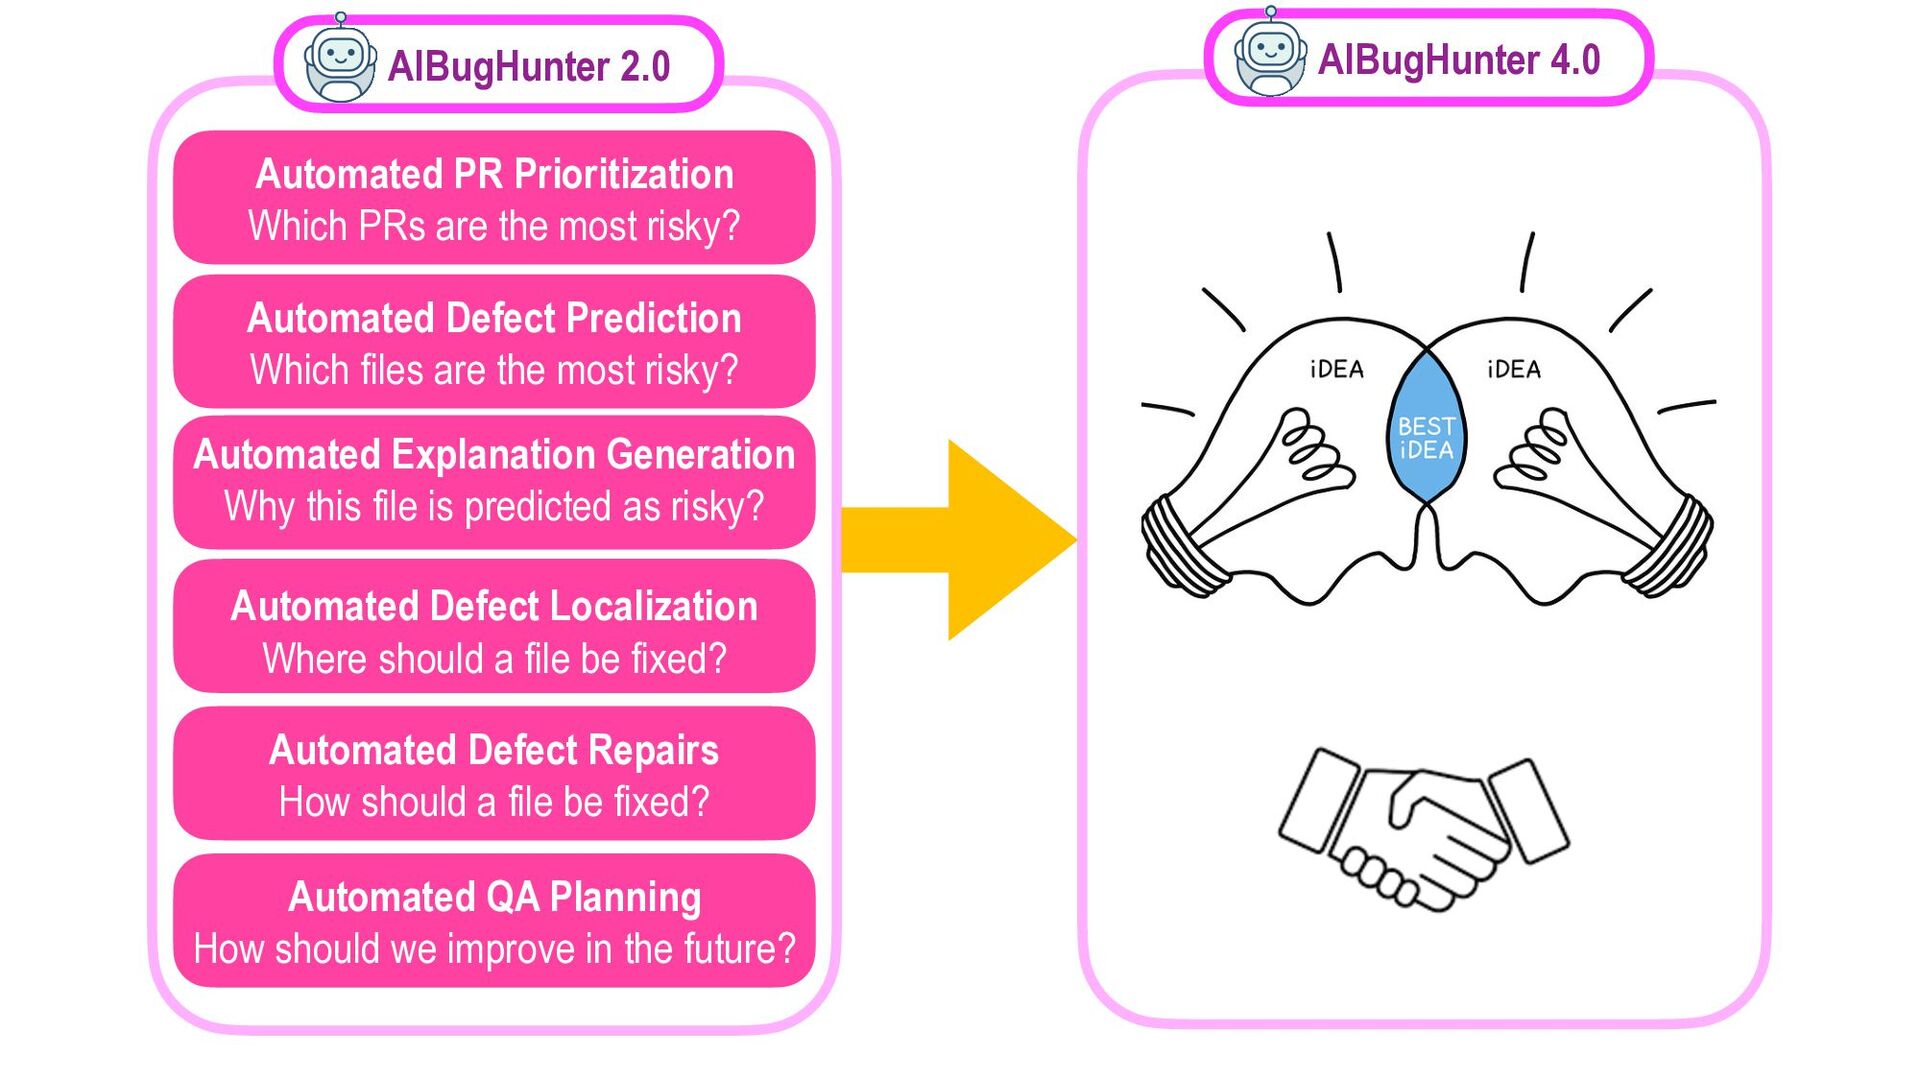
Our society is now driven by software. However, software defects and technology glitches are very expensive which could result in serious injuries and even deaths (e.g., a massive overdose of radiotherapy of Therac-25 to an explosion of the Ariane 5 rocket). Yet, current software quality assurance practices (e.g., modern code review) are still time-consuming and expensive. Imagine you are a developer working on a software project with million lines of code. Reviewing every single line of code to ensure that software is of high quality is infeasible due to the limited SQA resources. Funded by an Australia Research Council's DECRA award (2020-2023), I'm leading an AIBugHunter project to develop the next generation AI technologies to help developers to (1) predict if a file will be defective in the future; (2) explain why it is predicted as defective; (3) locate which lines of code are problematic and where to fix; and (4) suggest possible repairs. In this talk, I will briefly present the problem motivations, technologies, and potential benefits to enable developers to find software defects faster and enable managers to better develop software quality improvement plans to prevent defects in the future.

Bio: Dr. Chakkrit (Kla) Tantithamthavorn is the Monash Software Engineering Group Lead, and a Senior Lecturer in Software Engineering in the Faculty of Information Technology, Monash University, Australia. He is also affiliated with Monash Data Futures Institute and Digital Health Initiatives. His research is focused on developing AI-enabled software development techniques (e.g., AI for Software Defects, AI for Code Review, and AI for Agile) and tools (e.g, AIBugHunter, JITBot) in order to help developers find defects faster, improve developers' productivity, make better data-informed decisions, and better improve the quality of software systems. His work has been recognized by many prestigious awards e.g., Australian Research Council (ARC)'s DECRA Award (2020-2023), and Japan Society for the Promotion of Science (JSPS-DC2). Recently, he pioneered a new research direction of Explainable AI for Software Engineering, i.e., making software analytics more practical, explainable, and actionable. His research has been published at flagship software engineering venues, such as TSE, ICSE, EMSE, MSR, ICSME, IST.

More Decks by Chakkrit (Kla) Tantithamthavorn

Other Decks in Technology

Transcript

  1. AIBugHunter 2.0: Automated Defect Prediction, 
 Explanation, Localization, and Repair

    Dr. Chakkrit (Kla) Tantithamthavorn ARC DECRA Fellow, Senior Lecturer, SE Group Lead, Director of Eng&Imp (2022-onwards) Monash University, Melbourne, Australia. [email protected] @klainfo http://chakkrit.com
  2. Software bugs cost $2.84 trillion dollars globally https://www.it-cisq.org/the-cost-of-poor-quality-software-in-the-us-a-2018-report/The-Cost-of-Poor-Quality-Software-in-the-US-2018-Report.pdf A failure

    to eliminate defects in safety-critical systems could result in serious injury to people, threats to life, death, and disasters https://news.microsoft.com/en-au/features/direct-costs-associated-with-cybersecurity-incidents-costs-australian-businesses-29-billion-per-annum/ 59.5 billions annually for US 29 billions annually for Australia
  3. Software evolves extremely fast 50% of the Google’s code base

    changes every month Windows 8 involves 100K+ code changes Software is written in multiple languages, by many people, over a long period of time 
 in order to fix bugs , add new features , and improve code quality . every day And, software is released faster at massive scale every 6 months every 6 weeks every 6 months
  4. How to find bugs? Use unit testing to test the

    functionality correctness, But manual testing for all files is time-consuming Use static analysis tools check code quality Use code review to find bugs and check code quality Use CI/CD to automatically build, test, and merge with confidence Others: UI testing, fuzzing, load/performance testing, etc.
  5. QA activities take too much time (~50% of a project)

    • Large and complex code base: 1 billion lines of code • > 10K developers in 40+ office locations • 5K+ projects under active development • 17K code reviews per day • 100 million test cases run per day Given limited time, how can we efficiently and effectively perform QA activities on the most risky program elements? ’s rules: All changes must be reviewed* https://www.codegrip.tech/productivity/what-is-googles-internal-code-review-process/ https://eclipsecon.org/2013/sites/eclipsecon.org.2013/files/2013-03-24%20Continuous%20Integration%20at%20Google%20Scale.pdf Within 6 months, 1K developers perform 80K+ code reviews 
 (~77 reviews per person) for 30K+ code changes / one release
  6. Automated PR Prioritization 
 Which PRs are the most risky?

    Automated Defect Prediction 
 Which files are the most risky? Automated Defect Repairs 
 How should a file be fixed? Automated Defect Localization 
 Where should a file be fixed? Automated Explanation Generation 
 Why this file is predicted as risky? Automated QA Planning 
 How should we improve in the future? Pull Requests 
 (PRs) Submit Developer AIBugHunter 2.0
  7. Prediction Help developers find defects faster Timeline V2 Testing Data

    Defect 
 Models Training Data V1 Important Factors Help managers develop quality improvement plans Model-agnostic 
 techniques (LIME) Help developers better understand why a file is predicted as defective Defect Prediction Models: An Overview An AI/ML model to predict if a file will be defective in the future
  8. Raw Data ITS Issue 
 Tracking 
 System (ITS) MINING

    SOFTWARE DEFECTS Issue 
 Reports VCS Version 
 Control 
 System (VCS) Code Changes Code Snapshot Commit Log STEP 1: EXTRACT DATA
  9. Reference: https://github.com/apache/lucene-solr/tree/662f8dd3423b3d56e9e1a197fe816393a33155e2 What are the source files in this release?

    ITS Code Changes Code Snapshot Commit Log VCS Issue 
 Tracking 
 System (ITS) Version 
 Control 
 System (VCS) Issue 
 Reports Raw Data STEP 2: COLLECT METRICS STEP 1: EXTRACT DATA MINING SOFTWARE DEFECTS
  10. Reference: https://github.com/apache/lucene-solr/commit/662f8dd3423b3d56e9e1a197fe816393a33155e2 How many lines are added or deleted? ITS

    VCS Issue 
 Tracking 
 System (ITS) Version 
 Control 
 System (VCS) Raw Data Commit Log Issue 
 Reports MINING SOFTWARE DEFECTS Code Changes Code Snapshot STEP 2: COLLECT METRICS STEP 1: EXTRACT DATA Who edit this file?
  11. ITS VCS Issue 
 Tracking 
 System (ITS) Version 


    Control 
 System (VCS) Raw Data STEP 1: EXTRACT DATA CODE METRICS Size, Code Complexity, Cognitive Complexity, 
 OO Design (e.g., coupling, cohesion) PROCESS METRICS Development Practices 
 (e.g., #commits, #dev, churn, #pre- release defects, change complexity) HUMAN FACTORS Code Ownership, #MajorDevelopers, 
 #MinorDevelopers, Author Ownership, 
 Developer Experience Code Changes Code Snapshot Commit Log Issue 
 Reports STEP 2: COLLECT METRICS MINING SOFTWARE DEFECTS
  12. Reference: https://issues.apache.org/jira/browse/LUCENE-4128 Issue Reference ID Bug / New Feature Which

    releases are affected? Which commits belong to this issue report? ITS Code Changes Code Snapshot Commit Log VCS Issue 
 Tracking 
 System (ITS) Version 
 Control 
 System (VCS) Issue 
 Reports Raw Data STEP 1: EXTRACT DATA STEP 2: COLLECT METRICS STEP 3: IDENTIFY DEFECTS MINING SOFTWARE DEFECTS Whether this report is created after the release of interest?
  13. ITS Code Changes Code Snapshot Commit Log VCS Issue 


    Tracking 
 System (ITS) Version 
 Control 
 System (VCS) Issue 
 Reports Raw Data STEP 1: EXTRACT DATA STEP 3: IDENTIFY DEFECTS STEP 2: COLLECT METRICS …… …… A B Defect 
 Dataset MINING SOFTWARE DEFECTS Which files were changed to fix the defect? Link Check “Mining Software Defects” paper [Yatish et al., ICSE 2019]
  14. Mockus et al., BLTJ’00 Ostrand et al., TSE’05 Kim et

    al., FSE’15 Caglayan et al., ICSE’15 Tan et al., ICSE’15 Shimagaki et al., ICSE’16 Lewis et al., ICSE’13
  15. Automated PR Prioritization 
 Which PRs are the most risky?

    Automated Defect Prediction 
 Which files are the most risky? Automated Defect Localization 
 Where should a file be fixed? Automated Defect Repairs 
 How should a file be fixed? Automated Explanation Generation 
 Why this file is predicted as risky? Automated QA Planning 
 How should we improve in the future? SQAPlanner (TSE’20) PyExplainer (ASE’21) 
 Actionable Analytics (IEEE Software’21) JITBot (ASE’20) LineDP (TSE’20) 
 JITLine (MSR’21) 
 DeepLineDP (Under Review) AutoTransform (Under Review) LIME-HPO (TSE’20) Practitioners’ Perceptions (MSR’21) Pull Requests 
 (PRs) Submit Developer AIBugHunter 2.0
  16. @klainfo http://chakkrit.com Jirayus Jiarpakdee “Kla” Chakkrit Tantithamthavorn John Grundy Jirayus

    Jiarpakdee, Chakkrit Tantithamthavorn, John Grundy, Practitioners’ Perceptions of the Goals and Visual Explanations of Defect Prediction Models, International Conference on Mining Software Repositories (MSR’21). Practitioners' Perceptions of the Goals and Visual Explanations of Defect Prediction Models
  17. 40 Years of Defect Prediction Studies Help developers effectively prioritize

    the limited SQA resources Help managers can develop the most effective improvement plans Researchers’ Assumptions Help researchers develop empirical- grounded theories of software defects Practitioners’ Perceptions vs. etc.
  18. Identifying the Goals of Defect Prediction Studies TSE, ICSE, EMSE,

    FSE, MSR 2015-2020 (as of 11 Jan 2021) defect, fault, bug, predict, quality 2,890 studies Remove duplicates, short, irrelevant, 
 journal-first, abstract, secondary Manually read to investigate what are the common goals and used techniques for defect prediction models 96 primary studies
  19. Identifying the Practitioners’ Perceptions Survey Design 
 Participant Recruitment (MTurk)


 Data Verification 
 
 Statistical Analysis Part 1—Demographics - Role, Experience, Country of Residence, Programming Language, Team Size, Static Analysis (Yes/No) Part 2—Perceptions on Goals of Defect Prediction Models - Perceived usefulness of each goal - Willingness to adopt of each goal - Open Question: Why? Part 3—Perceptions on the Visual Explanations - PSSUQ Usability Framework: information usefulness, quality, insightfulness, overall preference - Open Question: Why?
  20. 91% 41% 4% 0 25 50 75 100 Goal 1

    (Predict) Goal 2 (Understand) Goal 3 (Explain) # of studies (%) Goals of developing defect prediction models 18% 0 5 10 15 20 ANO # of studies (%) Techn 0 5 10 15 20 25 # of studies (%) Goal 1 (Predict) Goa (Un Goals of developing defect prediction mo 91% focused on improving accuracy As few as 4% focused on increasing its explainability Practitioners’ Needs 
 (Survey) Researchers’ Focuses (SLR) ANOVA able tance ests Partial Dep. Plot (PDP) Decision Rule/Tree Rule/Tree Goal-3: L Explanati If {LOC>100} then {BUG} 6% 10% 6% 84% 82% 82% 10% 8% 12% (Goal 3) Understanding the most important characteristics that contributed to a prediction of a file (Goal 2) Understanding the characteristics that are associated with software defects in the past (Goal 1) Prioritizing the limited SQA resources on the most risky files 100 50 0 50 100 Percentage Response Not at all useful Not useful Neutral Useful Extremely useful 41% 4% Local explanations Global explanations Predctions 0 25 50 5 # of studies (%) Goal-1: Prediction Goal-2: Global Explanation Goal-3: Local Explanation Practitioners’ perceived usefulness 6% 10% 6% 84% 82% 82% 10% 8% 12% (Goal 3) Understanding the most important characteristics that contributed to a prediction of a file (Goal 2) Understanding the characteristics that are associated with software defects in the past (Goal 1) Prioritizing the limited SQA resources on the most risky files 100 50 0 50 100 Percentage Response Not at all useful Not useful Neutral Useful Extremely useful 6% 10% 6% 84% 82% 82% 10% 8% 12% (Goal 3) Understanding the most important characteristics that contributed to a prediction of a file (Goal 2) Understanding the characteristics that are associated with software defects in the past (Goal 1) Prioritizing the limited SQA resources on the most risky files 100 50 0 50 100 Percentage Response Not at all useful Not useful Neutral Useful Extremely useful 6% 10% 6% 84% 82% 82% 10% 8% 12% (Goal 3) Understanding the most important characteristics that contributed to a prediction of a file (Goal 2) Understanding the characteristics that are associated with software defects in the past (Goal 1) Prioritizing the limited SQA resources on the most risky files 100 50 0 50 100 Percentage Response Not at all useful Not useful Neutral Useful Extremely useful 6% 10% 6% 84% 82% 82% 10% 8% 12% (Goal 3) Understanding the most important characteristics that contributed to a prediction of a file (Goal 2) Understanding the characteristics that are associated with software defects in the past (Goal 1) Prioritizing the limited SQA resources on the most risky files 100 50 0 50 100 Percentage Response Not at all useful Not useful Neutral Useful Extremely useful 6% 10% 6% 84% 82% 82% 10% 8% 12% 41% 4% Goal 1: 
 Predictions Goal 2: 
 Global Explanation Goal 3: 
 Local Explanation Three goals are similarly useful, But… Is the SE community moving to the right direction? Jirayus Jiarpakdee, Chakkrit Tantithamthavorn, John Grundy, Practitioners’ Perceptions of the Goals and Visual Explanations of Defect Prediction Models, International Conference on Mining Software Repositories (MSR’21).
  21. Open Questions We call for a new research topic of

    Explainable AI for Software Engineering (XAI4SE) Three goals are well perceived as useful by practitioners. Sadly, researchers only focus on improving the accuracy, not explainability! Thus, we ask: 
 “How to make software analytics more explainable and actionable?” 
 See: LIME-HPO (TSE’20), SQAPlanner (TSE’20), PyExplainer (ASE’21), Actionable Analytics (SW’21)
  22. JITLine: A Simpler, Better, Faster, Finer- grained Just-In-Time Defect Prediction

    @klainfo http://chakkrit.com Chanathip Pornprasit “Kla” Chakkrit Tantithamthavorn Chanathip Pornprasit, Chakkrit Tantithamthavorn, JITLine: A Simpler, Better, Faster, Finer-grained Just-In-Time 
 Defect Prediction, International Conference on Mining Software Repositories (MSR’21).
  23. Critical Challenges in Modern SQA Practices Large-scale software projects receive

    a large number of newly arrived commits everyday. + - Those commits need to be reviewed prior to integrating into the release branch. —A Google SE Practice— With the limited time and resources, it is infeasible that practitioners can exhaustively review all commits.
  24. - + New Commit Testing Data - + - +

    Commit History - + - + Training Data Timeline Defect-inducing commits Defect-fixing commits - + - + JIT Models Important Factors Provide Immediate Feedback for SQA Planning Risk Score Prioritize SQA Resources 
 on the Most Risky Commits Just-In-Time Defect Prediction Models A classifier to predict if a commit will introduce software defects in the future [Kamei et al. 2013]
  25. Each commit is large and complex Commit size varies from

    100 to 1000 lines of code On average, 50% of the changes lines for a commit are risky. • Predictions are not understandable by practitioners • Lack of adoption of JIT models in practice • Poor SQA resource prioritization Practitioners still do not know: “Which lines are most risky?”
  26. JITLine: Line-Level JIT Defect Prediction using XAI How can we

    accurately identify which lines are most risky for a given commit? Training Data (Step 1) Extracting Bag- of-Tokens Features (Step 2) Handling class imbalance w/ DE+SMOTE (Step 3) Building a commit-level JIT model Testing Data Each commit + - JIT Models Prediction (Step 4) Explain the prediction to find defective tokens/lines
  27. McIntosh & Kamei [TSE’17] #Commits #Tokens %Defective Commits Average 


    Commit Size Average 
 % Defective Lines OpenStack 12K 32K 13% 73 LOC 53% Qt 25K 81K 8% 140 LOC 51% Datasets Experimental Setup Baseline Comparison Effort-Aware JIT 
 Defect Models 
 (Kamei et al TSE’13) DeepJIT 
 CNN-based Models 
 (Hoang et al MSR’19) CC2Vec 
 HAN-based Models 
 (Hoang et al ICSE20)
  28. Four Research Questions & Results • JITLine is 26%- 38%

    more accurate (F-measure) • 94%-97% lower a False Alarm Rate (FAR) (RQ1) Does our JITLine outperform the state-of-the-art JIT defect prediction approaches? Measures: AUC, F1, FAR, D2H • JITLine saves the amount of effort by 89%-96% to find the same number of defect- introducing commits (RQ2) Is our JITLine more cost-effective than the state-of-the-art JIT defect prediction approaches? Measures: Effort@20%Recall, PCI@20%LOC, Popt • JITLine takes 1-3 mins by CPU, 
 which is 70-100 times faster than CC2Vec. (RQ3) Is our JITLine faster than the state- of-the-art JIT defect prediction approaches? Measure: Model training time • 133%-150% more accurate in identifying defective lines than n-gram by Yan et al. (RQ4) How effective is our JITLine for prioritizing defective lines of a given defect-introducing commit? Measures: Top-10, Recall@20%Effort, Effort@20%Recall Take-away: “JITLine may help practitioners to better prioritize defect-introducing commits and better identify defective lines.”
  29. Automated PR Prioritization 
 Which PRs are the most risky?

    Automated Defect Prediction 
 Which files are the most risky? Automated Defect Localization 
 Where should a file be fixed? Automated Defect Repairs 
 How should a file be fixed? Automated Explanation Generation 
 Why this file is predicted as risky? Automated QA Planning 
 How should we improve in the future? AIBugHunter 2.0 AIBugHunter 4.0