The ins and outs of data visualization for non-profits and other do-gooders. (Download the PDF in order to read the notes that show up here too tiny to read.)
we are a data visualization firm in Portland, OR. We have a background in traditional web development, but in 2003 we were inspired by some of the work we saw from IBM, Ben Fry, and others and switched gears to dataviz. I’ll show a few slides of our work.... 1
of working with data and non-profits. One thing to keep top of mind while working with do-gooders is that their data is living and breathing. Meaning, the data is about kids who are dying of cancer, or bears that are starving because the polar ice cap is diminishing. The data is about real people, animals, that are out there encountering these problems right now as we speak. I don’t know if you caught Jon Schwabish’s talk yesterday – he’s from the congressional budget office. Now that may seem like dry economic data (Sorry, Jon)... But you have to remember that those are people who may need food stamps to get by, or someone with disabilities who may need certain social services.... There are real people behind the numbers. 5
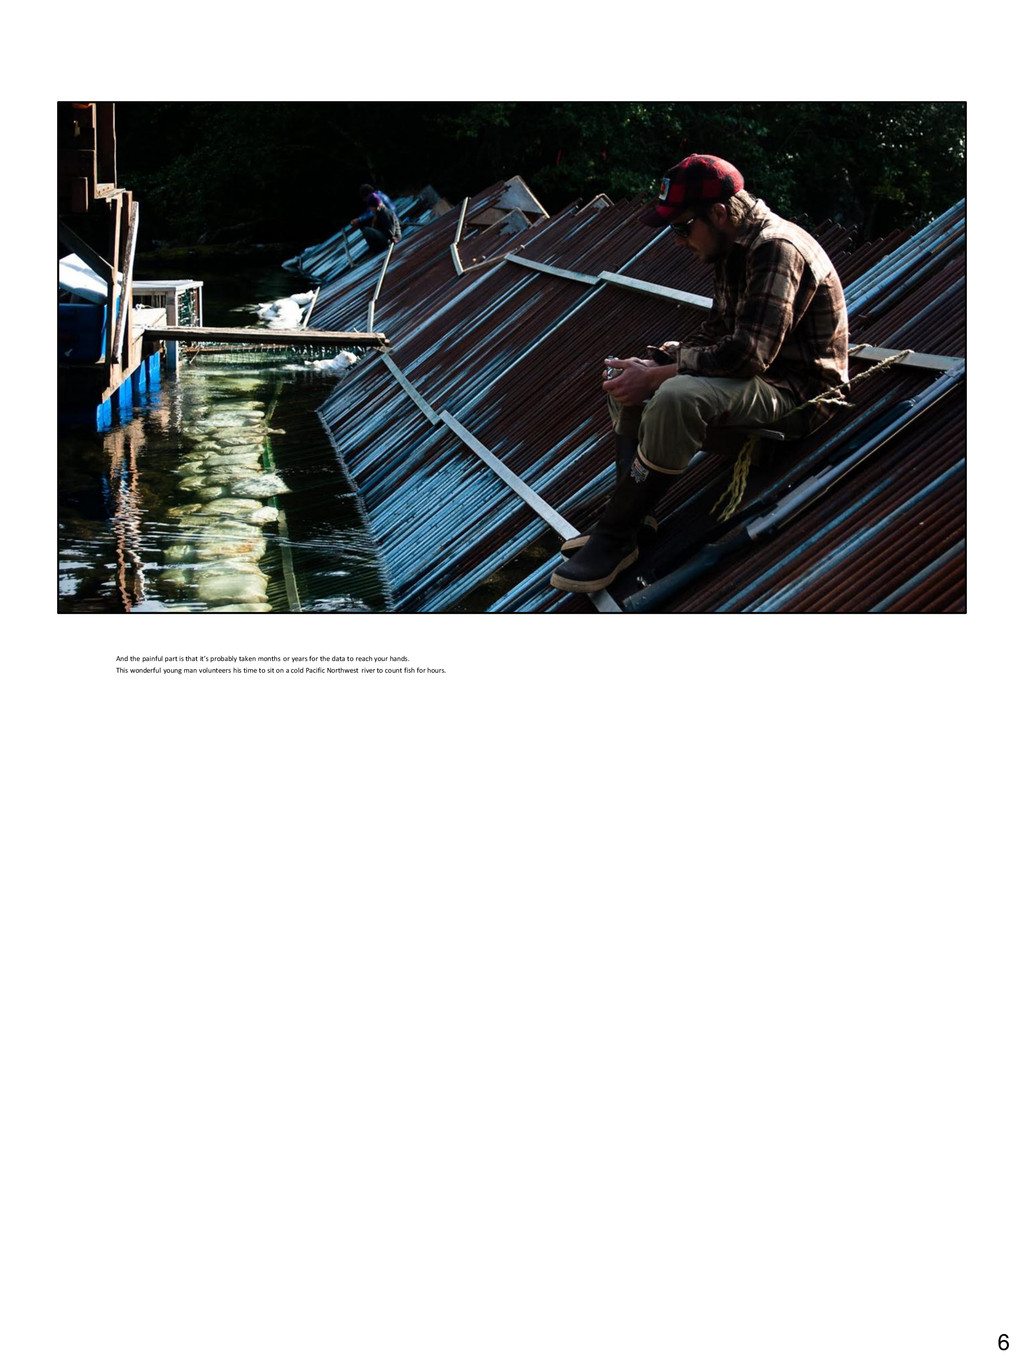
or years for the data to reach your hands. This wonderful young man volunteers his time to sit on a cold Pacific Northwest river to count fish for hours. 6
you want to scream their message to the world, but they want to keep a lower profile. This can seem counter productive, but really it’s a fine balance that many orgs face. 9
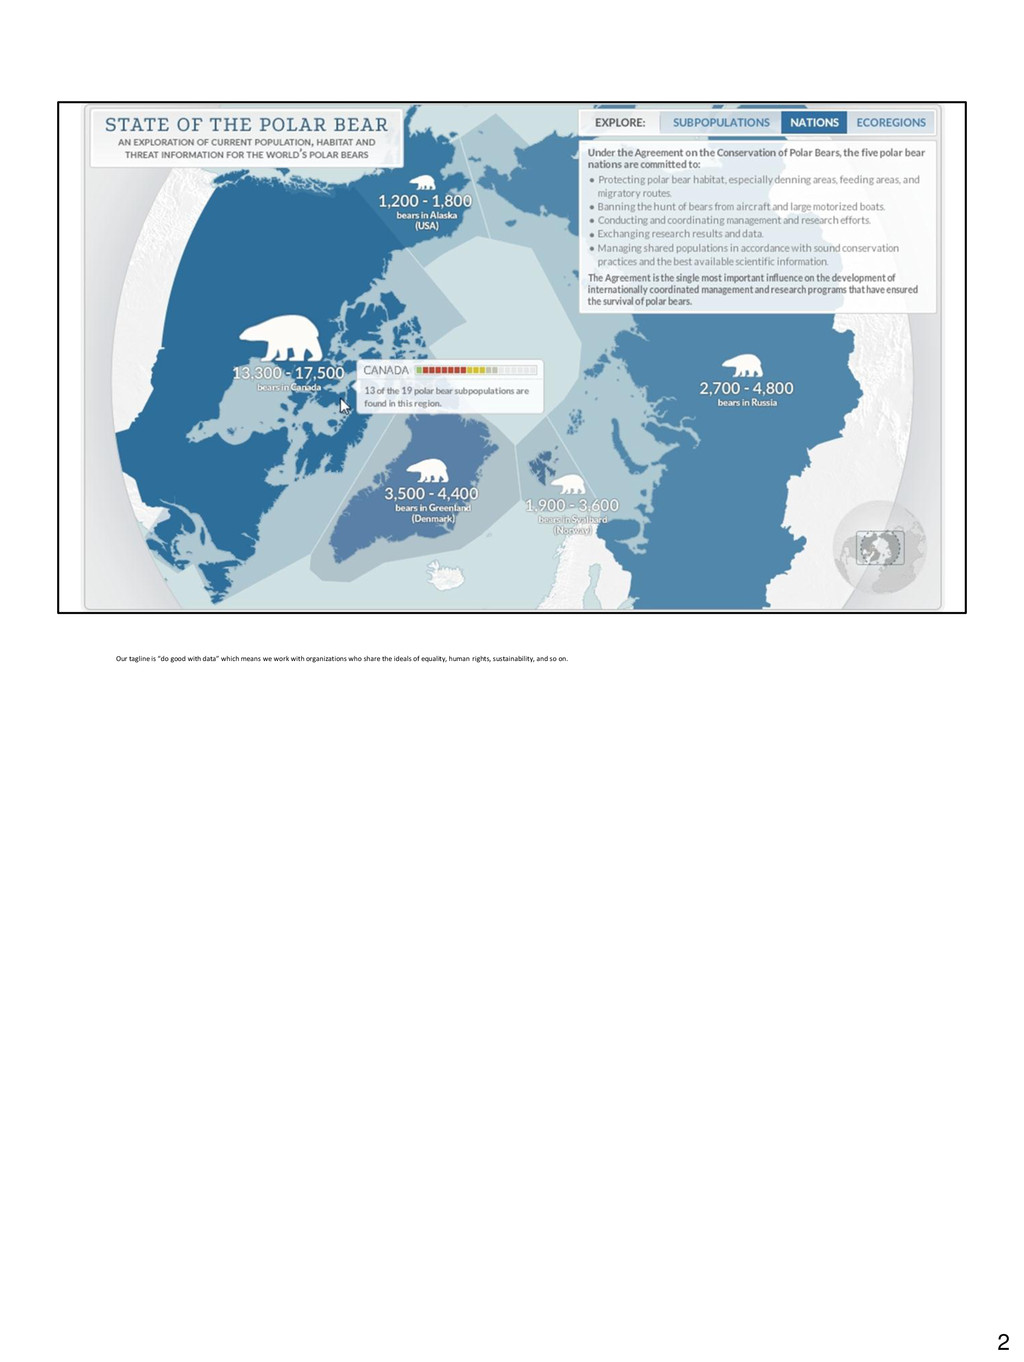
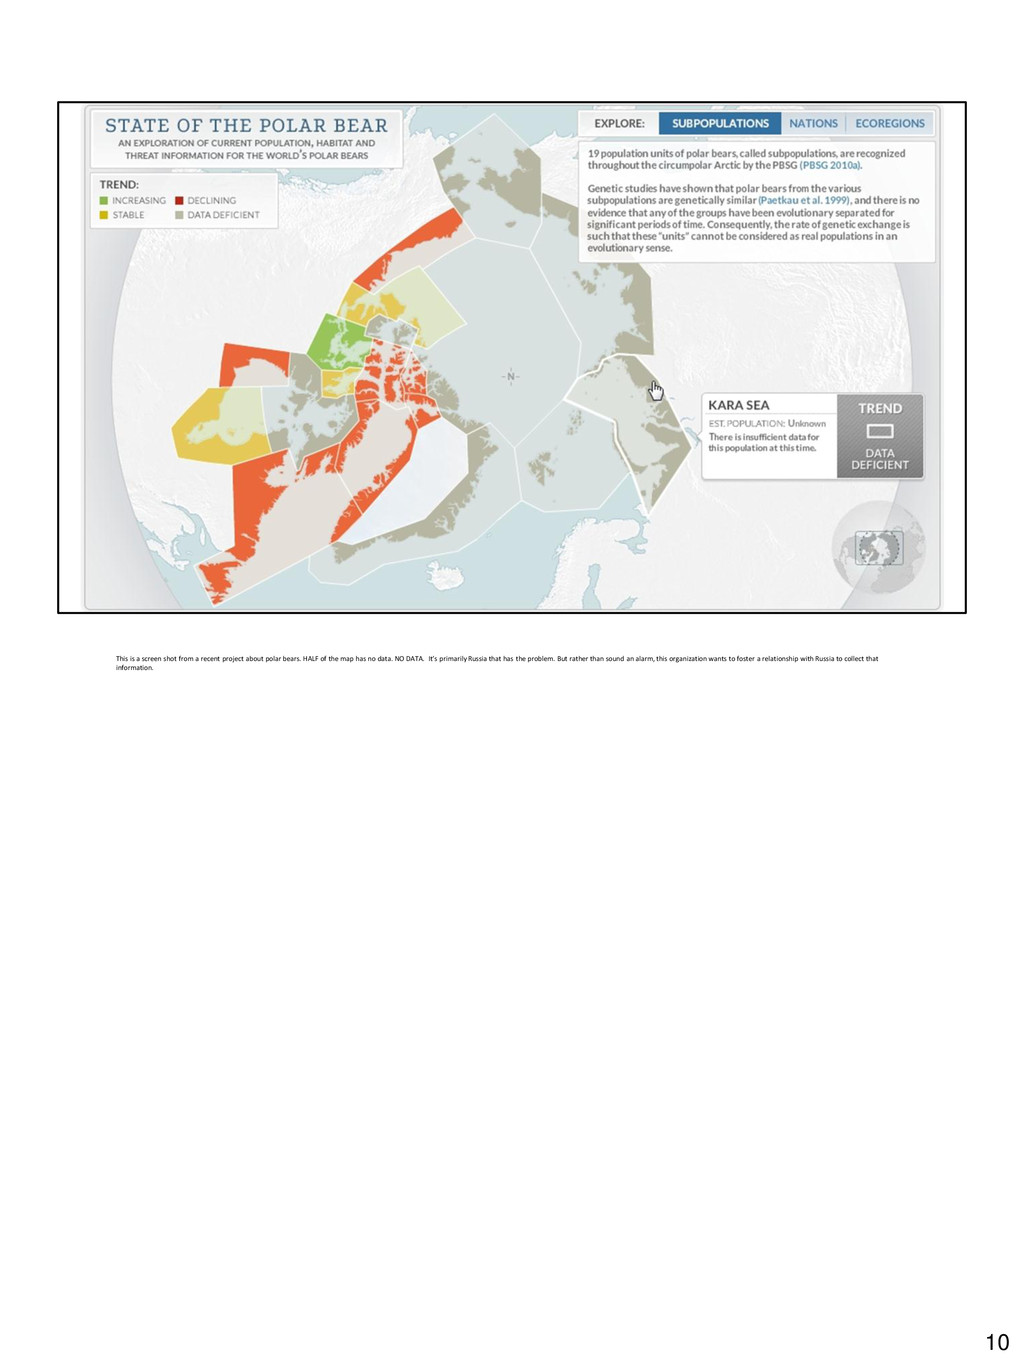
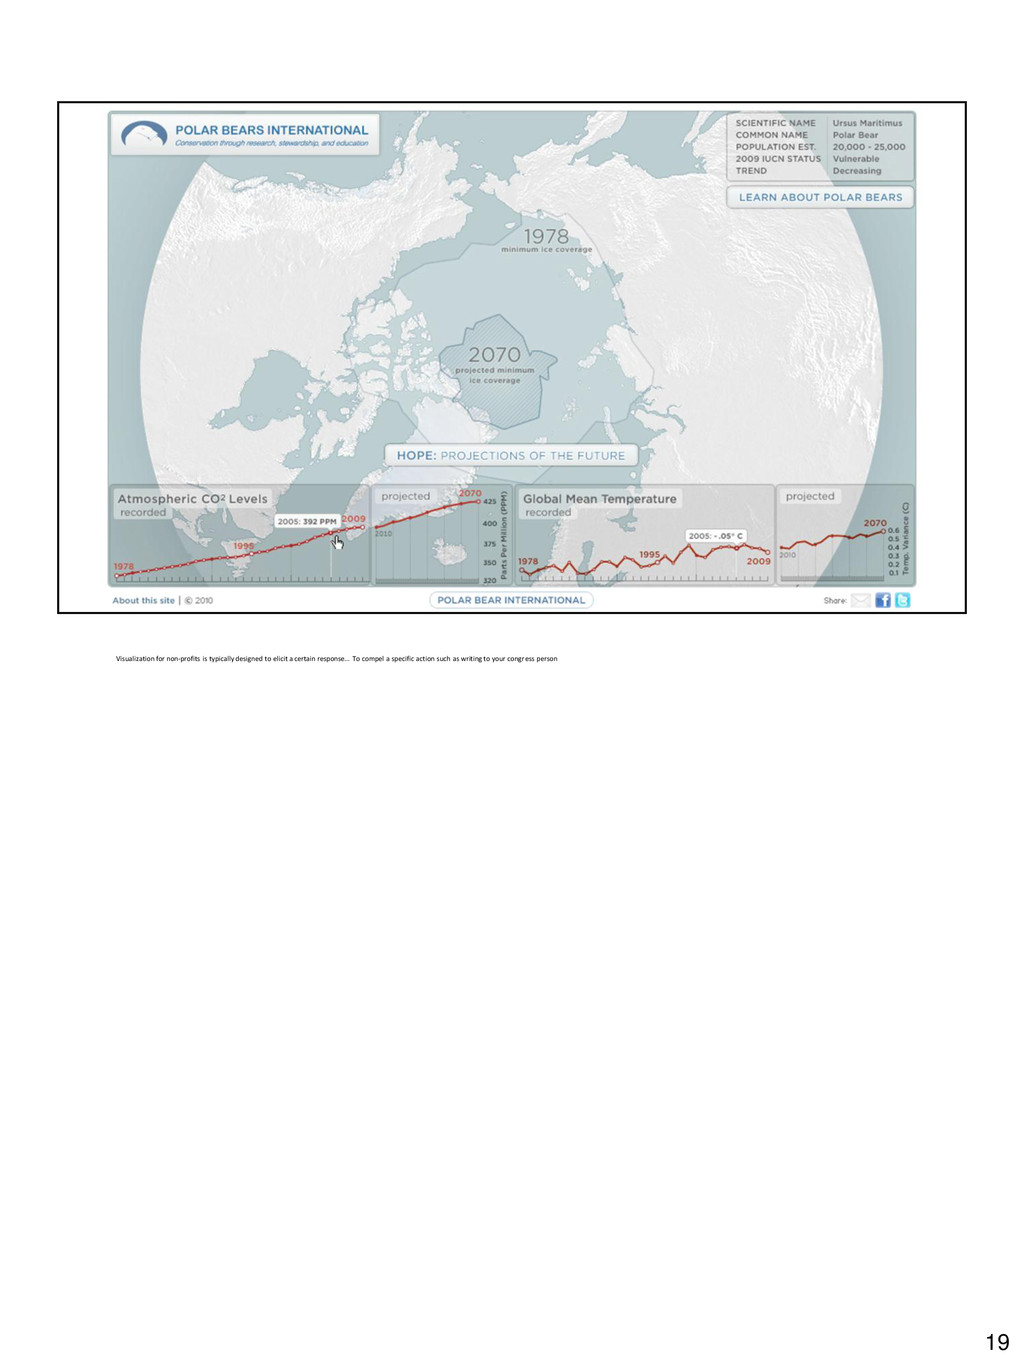
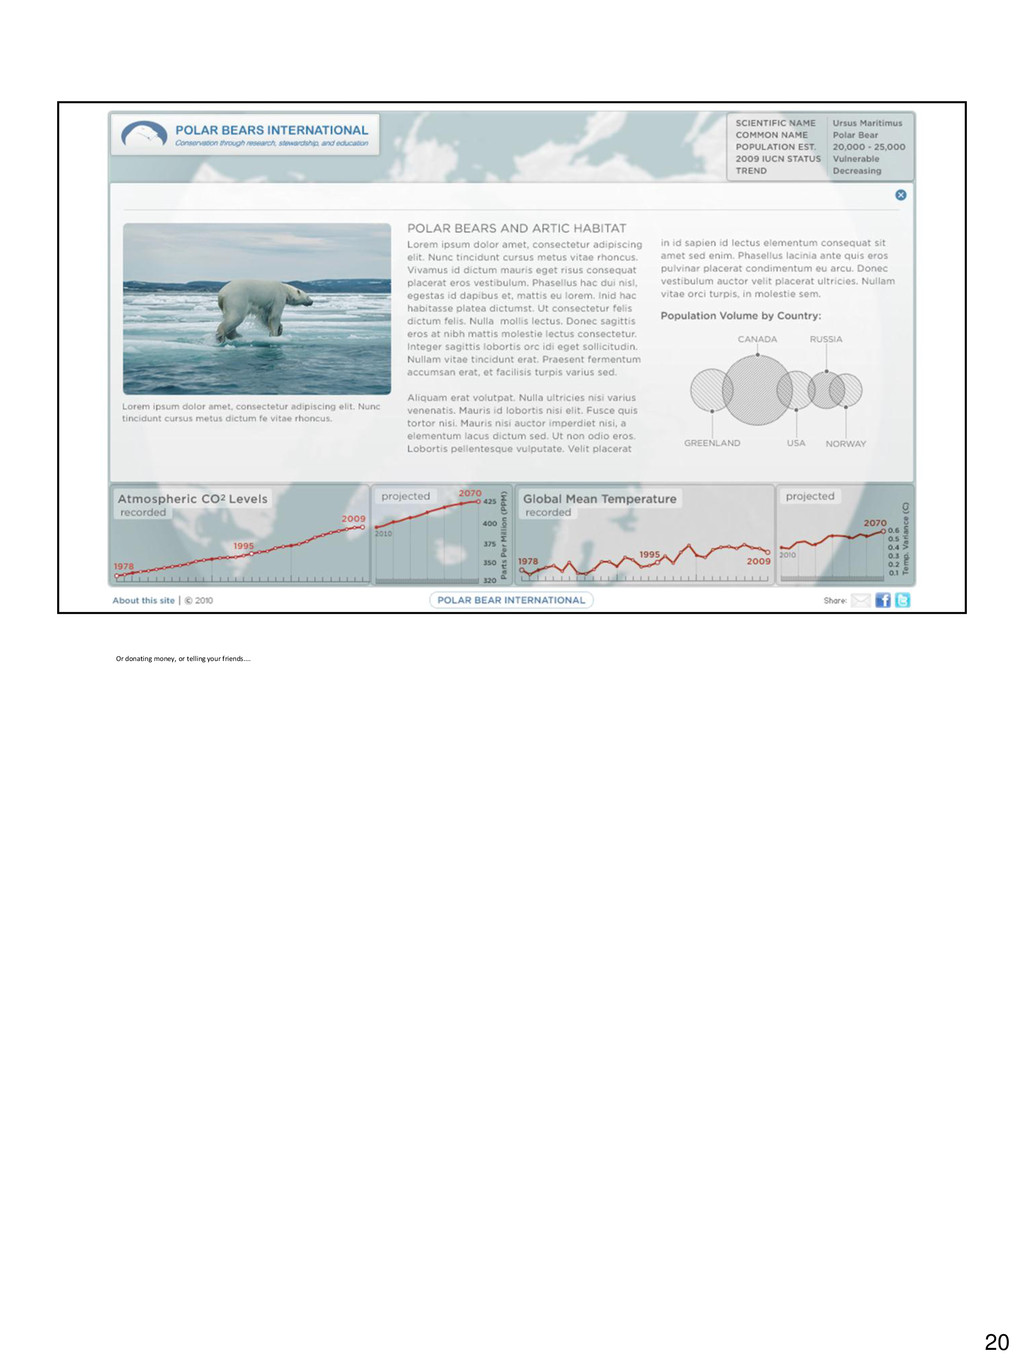
polar bears. HALF of the map has no data. NO DATA. It’s primarily Russia that has the problem. But rather than sound an alarm, this organization wants to foster a relationship with Russia to collect that information. 10
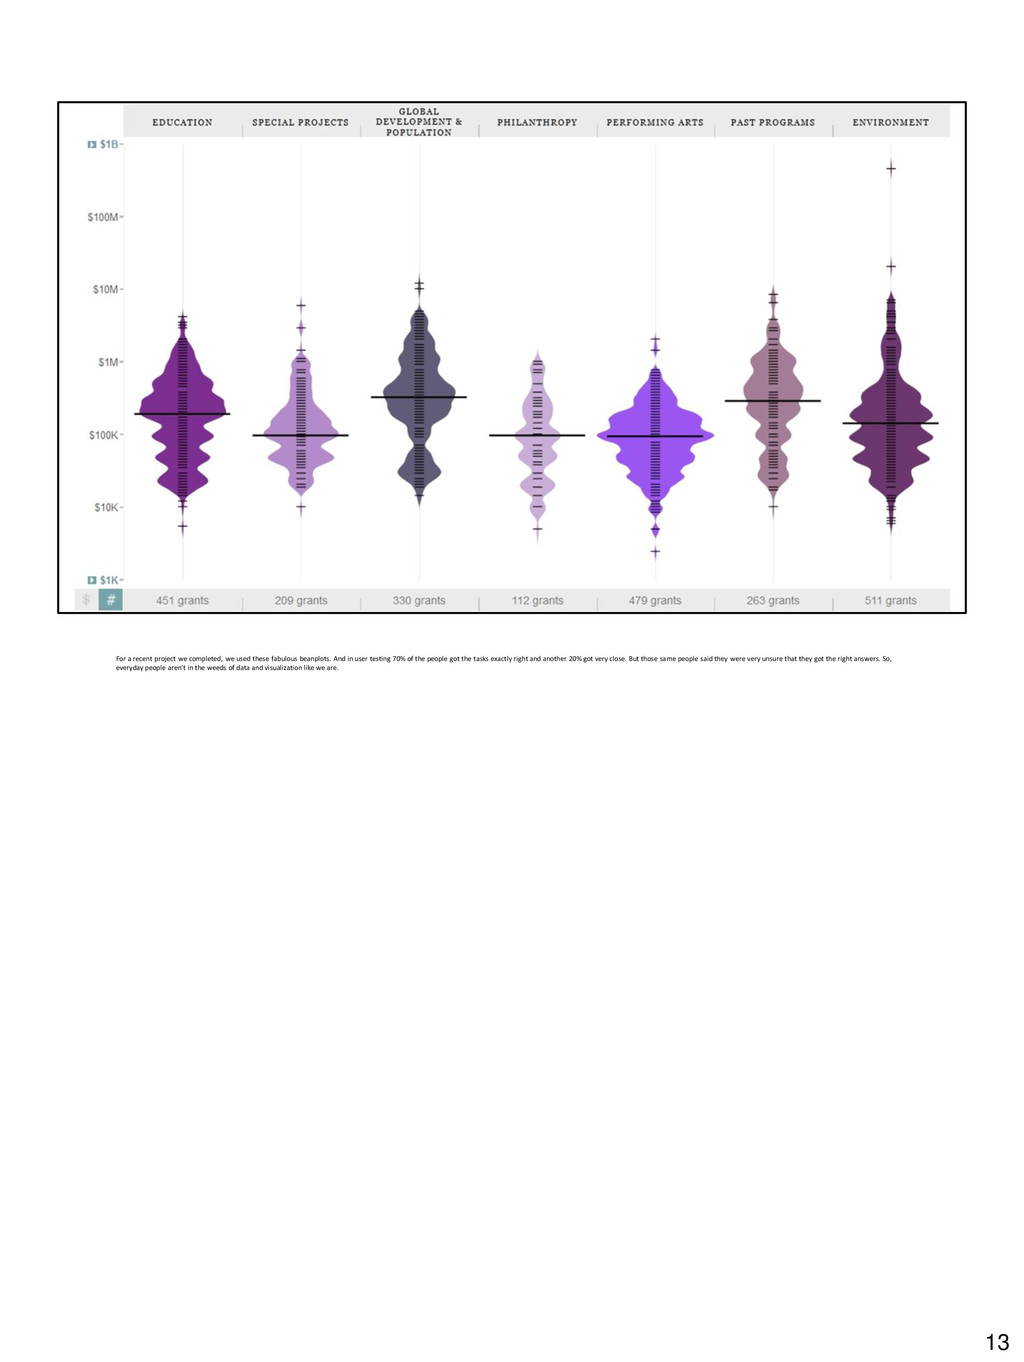
beanplots. And in user testing 70% of the people got the tasks exactly right and another 20% got very close. But those same people said they were very unsure that they got the right answers. So, everyday people aren’t in the weeds of data and visualization like we are. 13
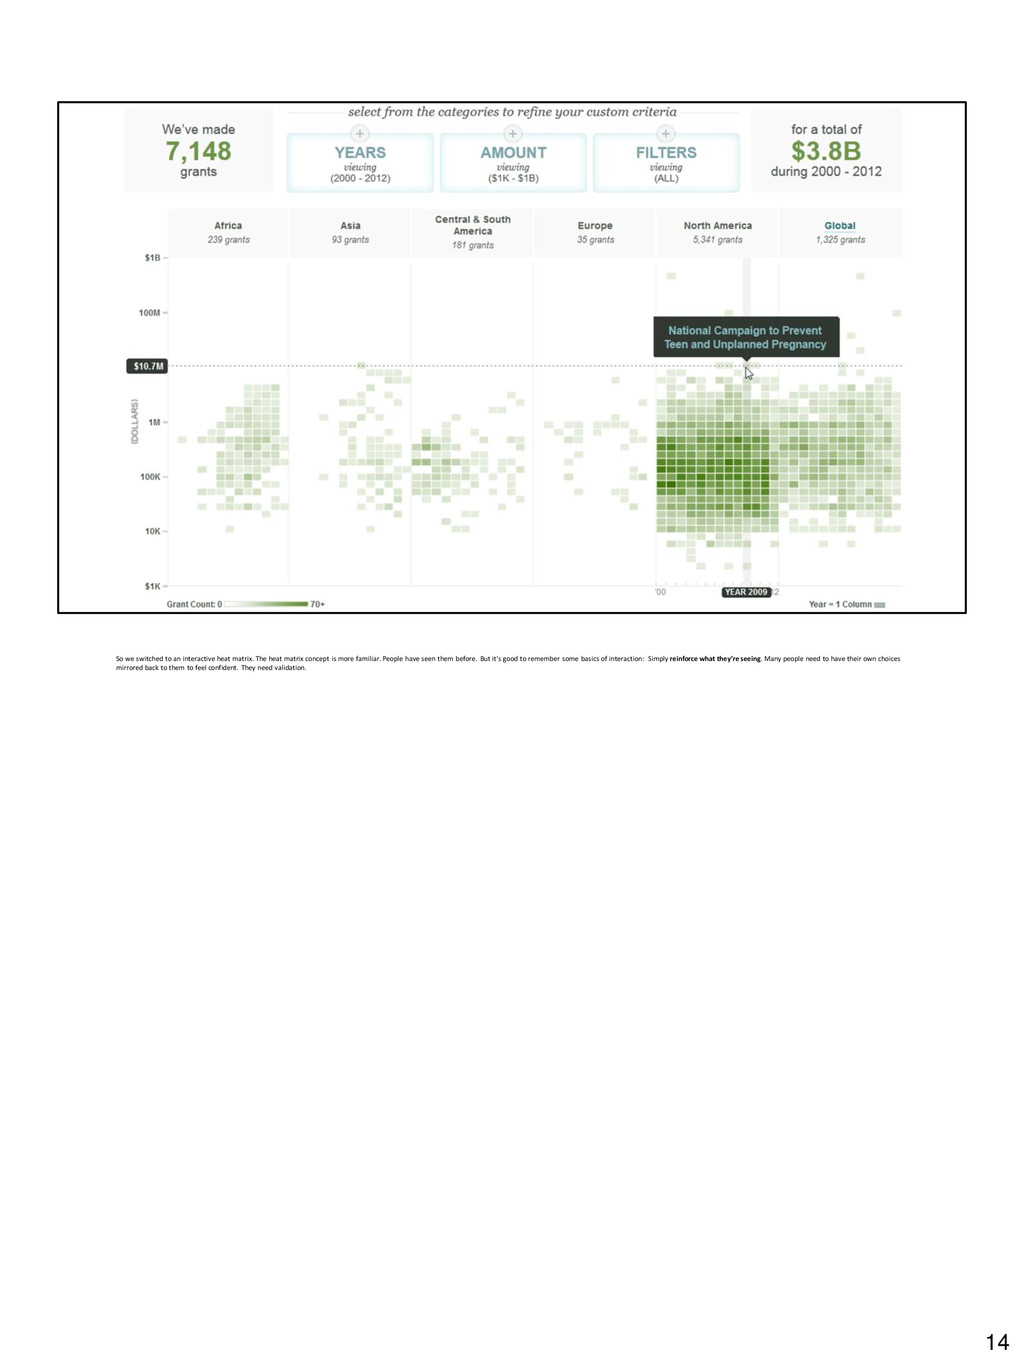
matrix concept is more familiar. People have seen them before. But it’s good to remember some basics of interaction: Simply reinforce what they’re seeing. Many people need to have their own choices mirrored back to them to feel confident. They need validation. 14
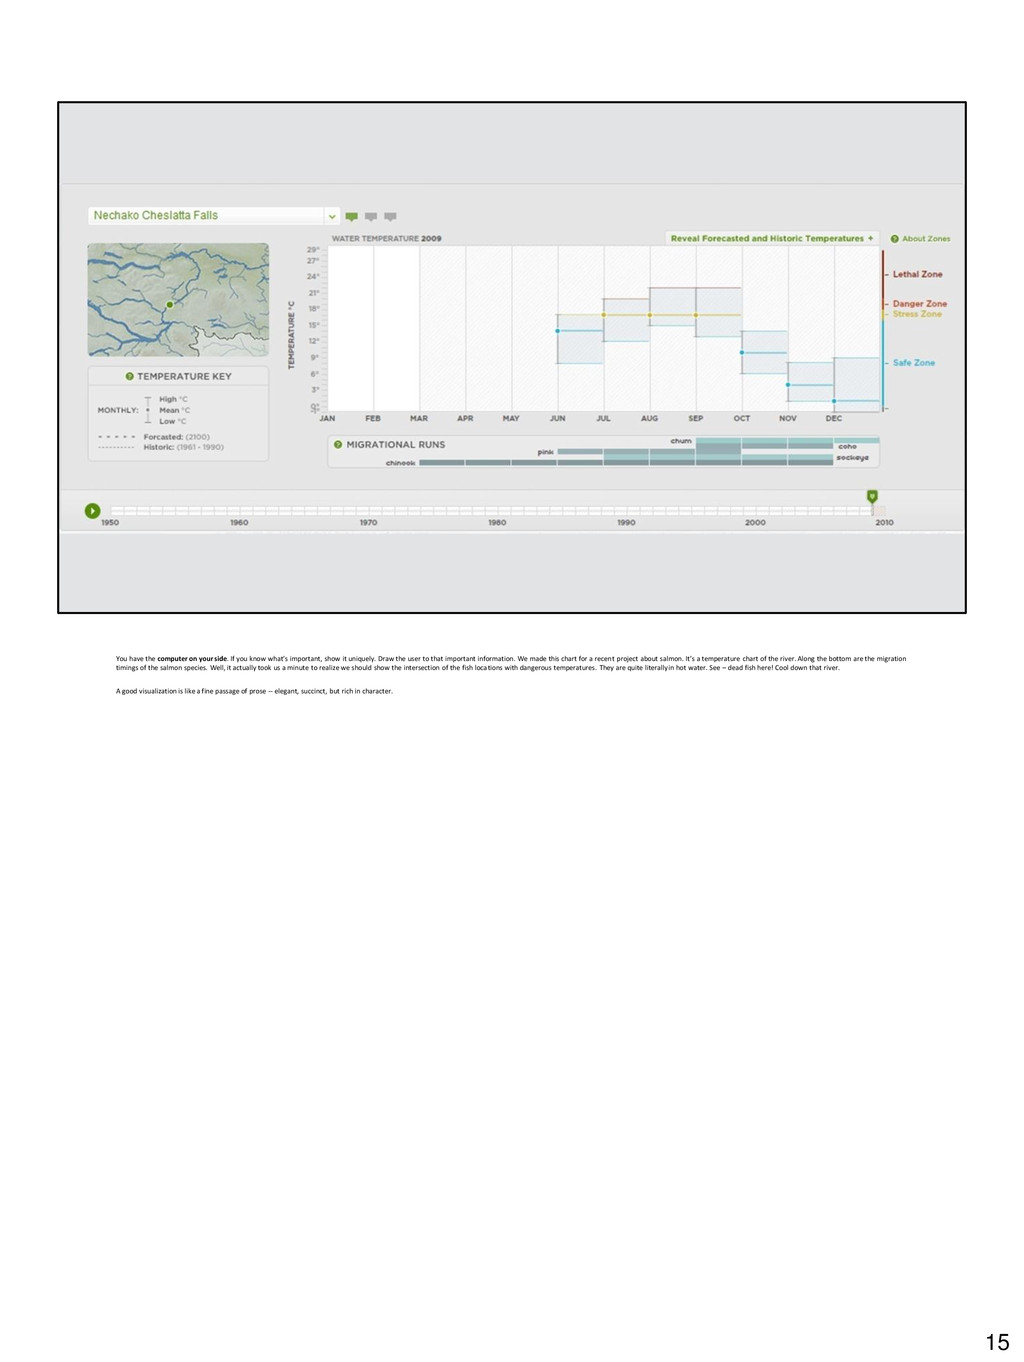
what’s important, show it uniquely. Draw the user to that important information. We made this chart for a recent project about salmon. It’s a temperature chart of the river. Along the bottom are the migration timings of the salmon species. Well, it actually took us a minute to realize we should show the intersection of the fish locations with dangerous temperatures. They are quite literally in hot water. See – dead fish here! Cool down that river. A good visualization is like a fine passage of prose -- elegant, succinct, but rich in character. 15
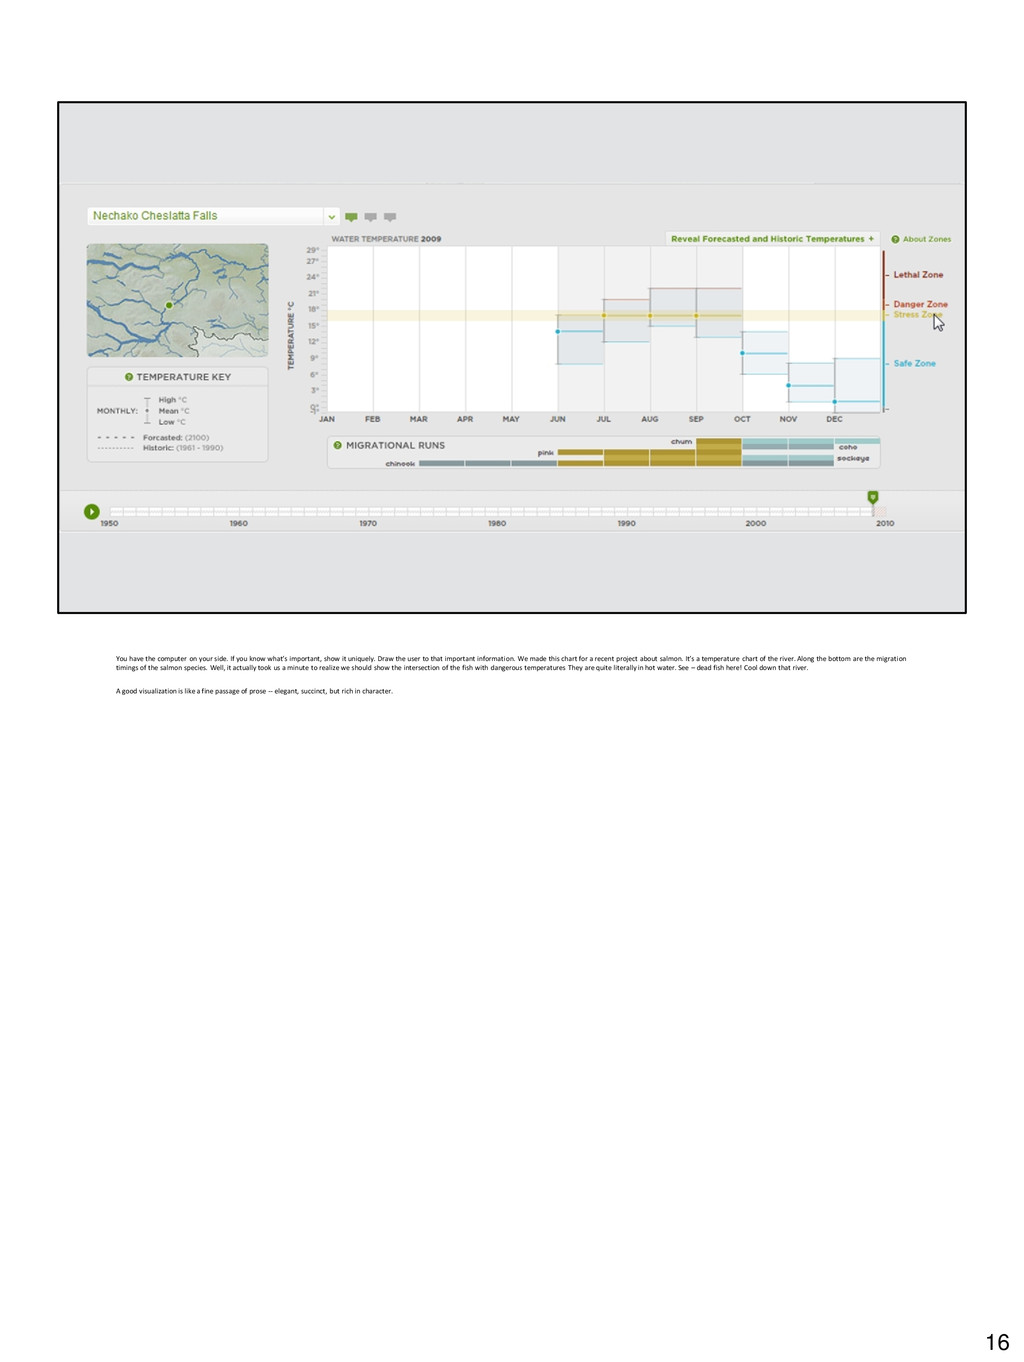
what’s important, show it uniquely. Draw the user to that important information. We made this chart for a recent project about salmon. It’s a temperature chart of the river. Along the bottom are the migration timings of the salmon species. Well, it actually took us a minute to realize we should show the intersection of the fish with dangerous temperatures They are quite literally in hot water. See – dead fish here! Cool down that river. A good visualization is like a fine passage of prose -- elegant, succinct, but rich in character. 16
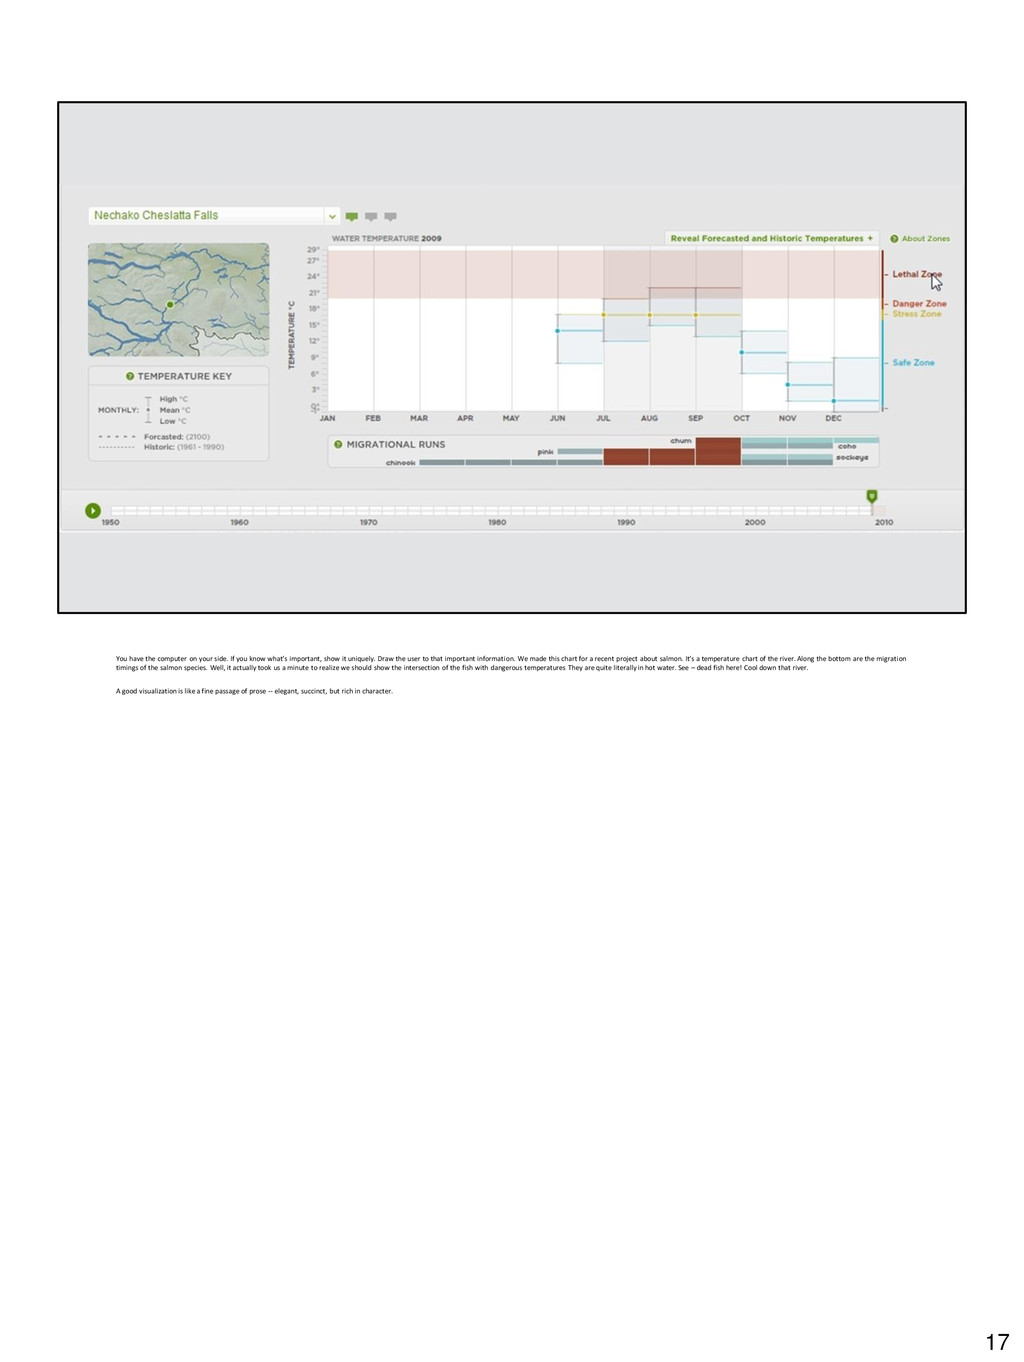
what’s important, show it uniquely. Draw the user to that important information. We made this chart for a recent project about salmon. It’s a temperature chart of the river. Along the bottom are the migration timings of the salmon species. Well, it actually took us a minute to realize we should show the intersection of the fish with dangerous temperatures They are quite literally in hot water. See – dead fish here! Cool down that river. A good visualization is like a fine passage of prose -- elegant, succinct, but rich in character. 17
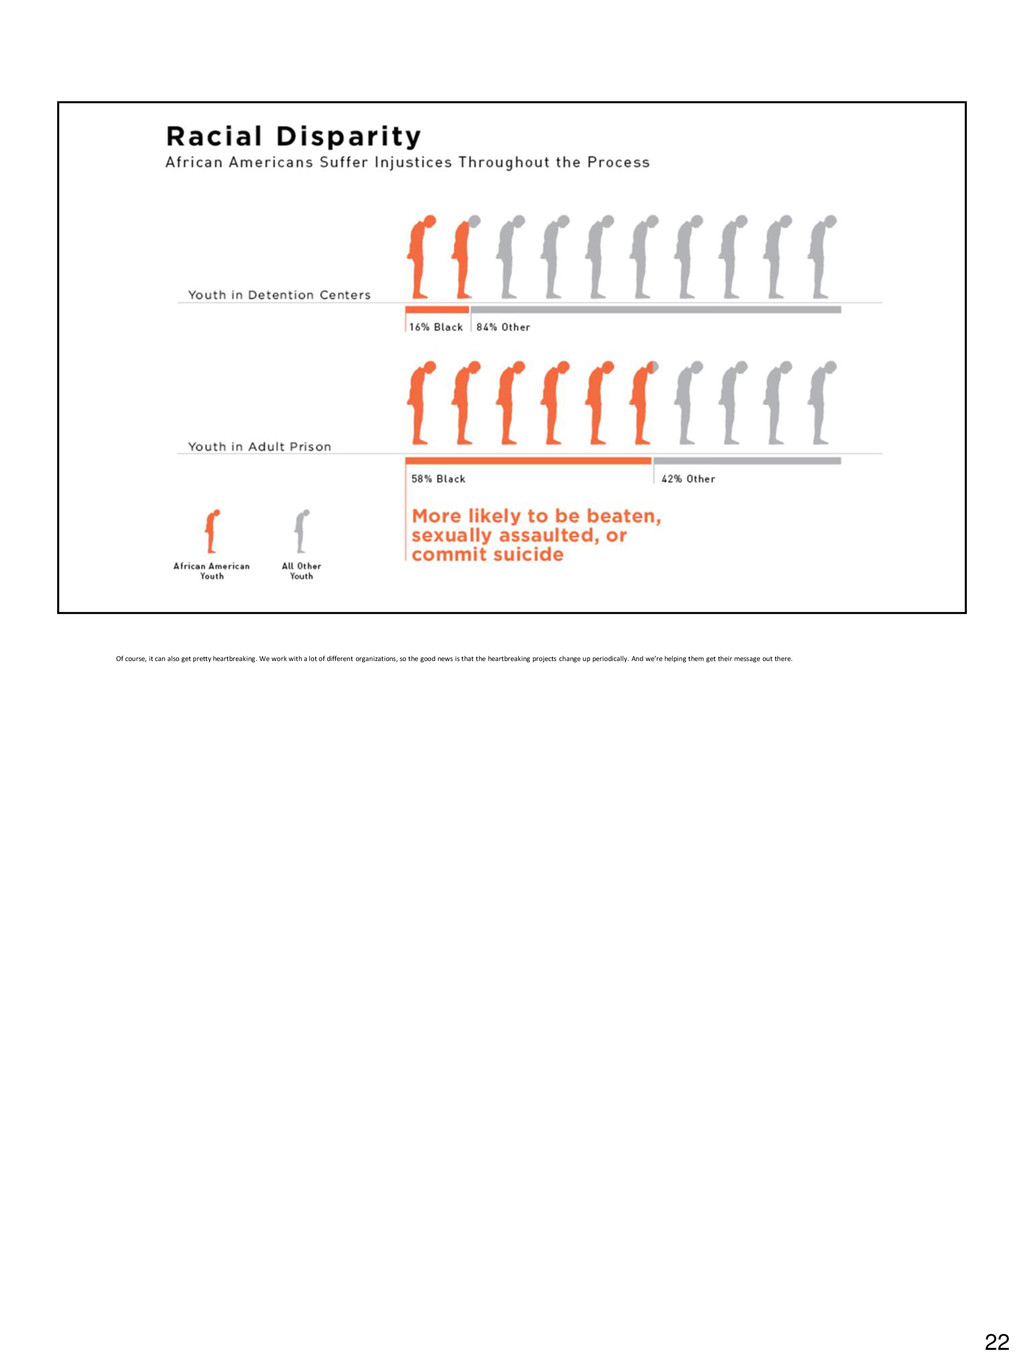
academia much... It’s called “emotion”.... Or the “F” word: Feelings. Non-profit work is pretty much imbued with emotion... It’s steeped in emotion. 18
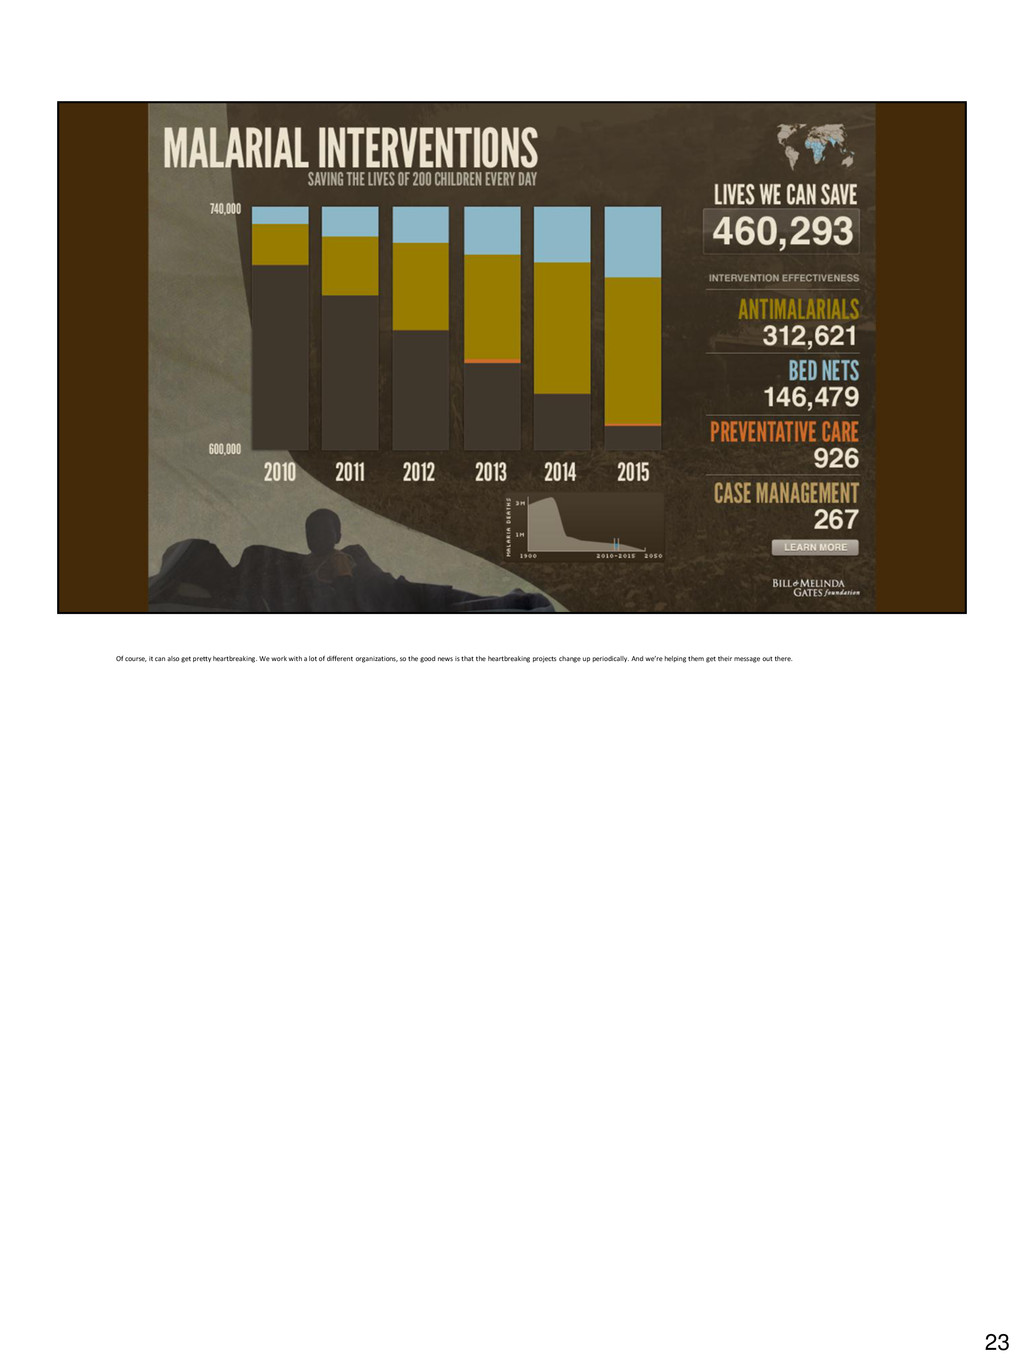
with a lot of different organizations, so the good news is that the heartbreaking projects change up periodically. And we’re helping them get their message out there. 22
with a lot of different organizations, so the good news is that the heartbreaking projects change up periodically. And we’re helping them get their message out there. 23