The world is more than what is visible around us. Data visualization is a practice that can generate insight and hasten understanding. By working through two case studies, I will show how data visualization can transform the invisible into rich intelligence .
First, Yahoo!’s email traffic that is sent and received will be illuminated with a small interactive visualization. I will also demonstrate a forthcoming social media visualization for GE Healthymagination which looks at conversations about breast cancer.
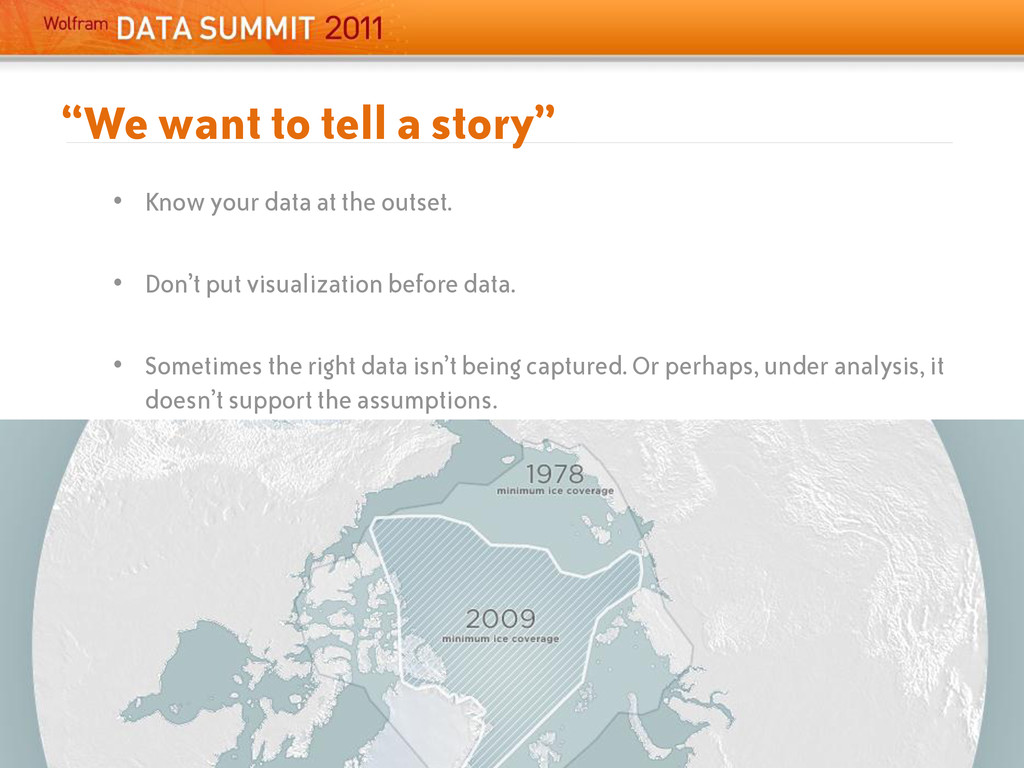
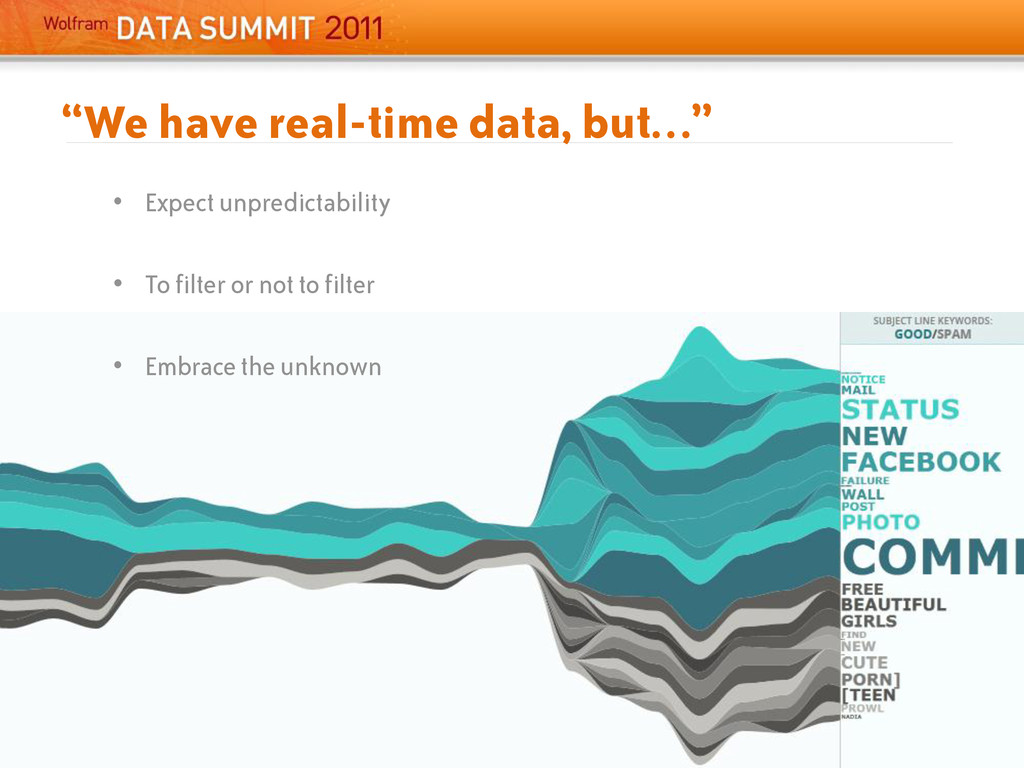
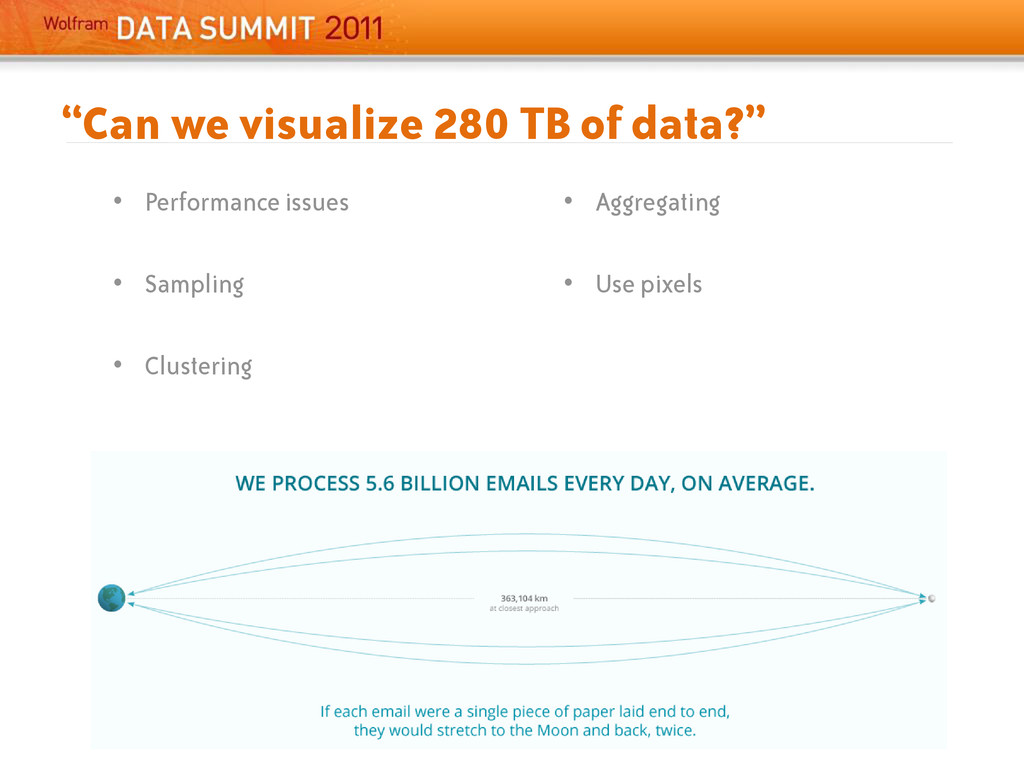
I will discuss challenges our team has encountered and how we’ve remedied them:
- Desire to tell a story, but don’t know the data.
- Unpredictable real-time data.
- Visualizing big data performance issues.
- Dealing with data transparency nay-sayers.
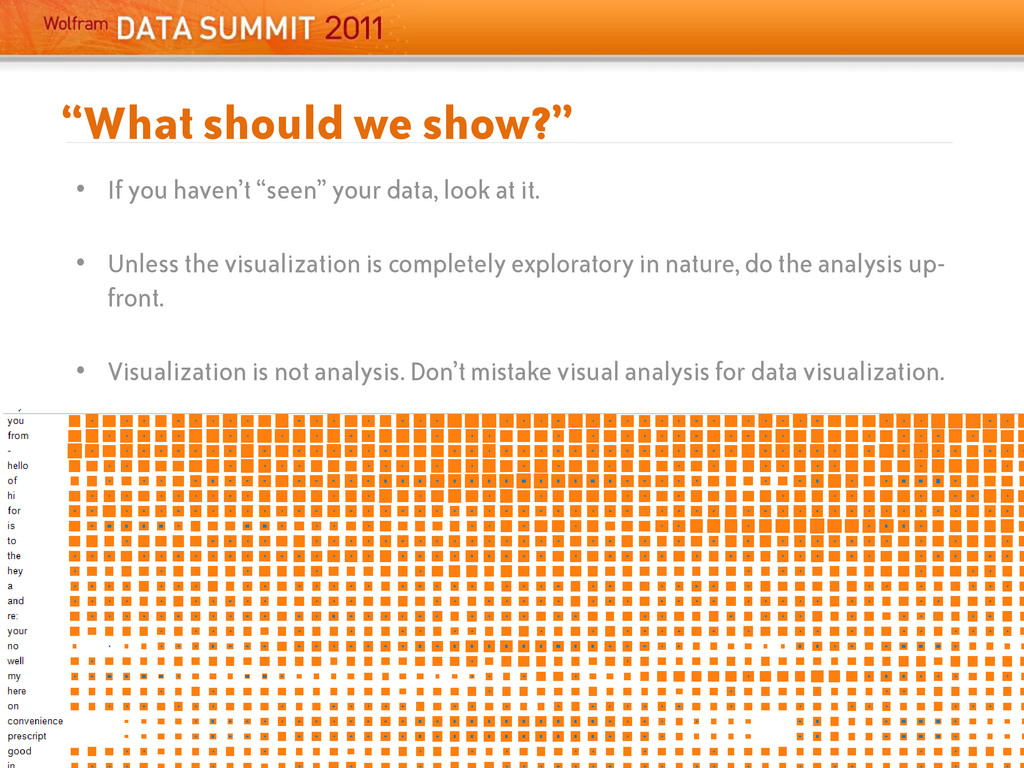
- Mistaking visualization for analysis.
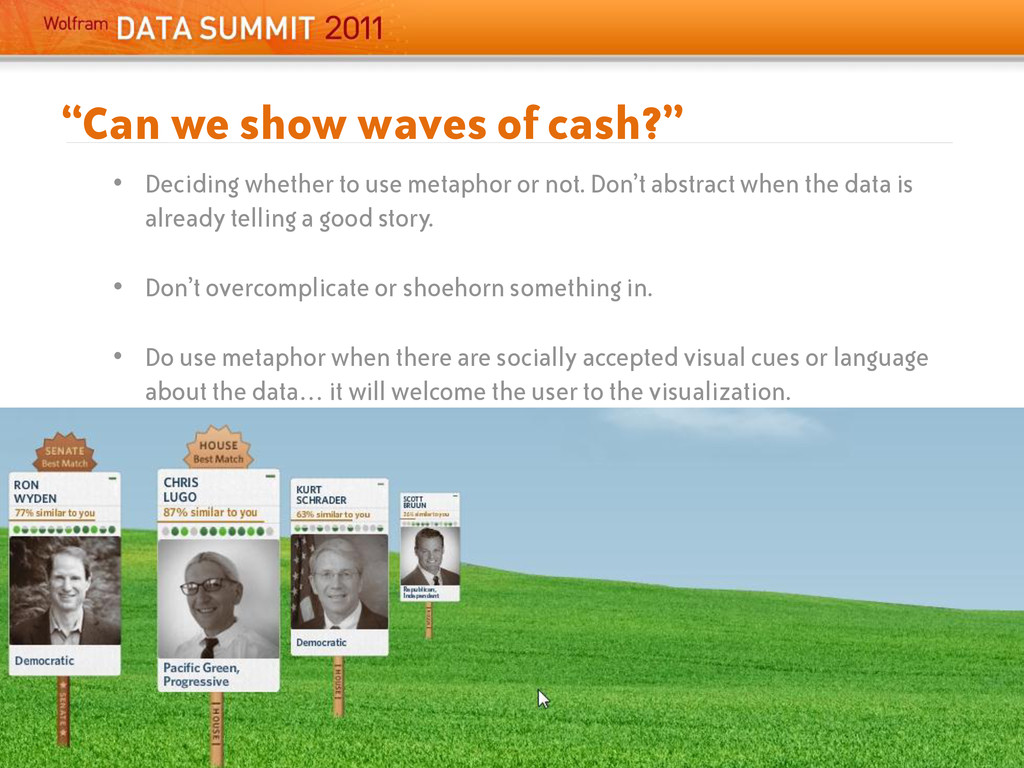
- Deciding whether to use metaphor or not.
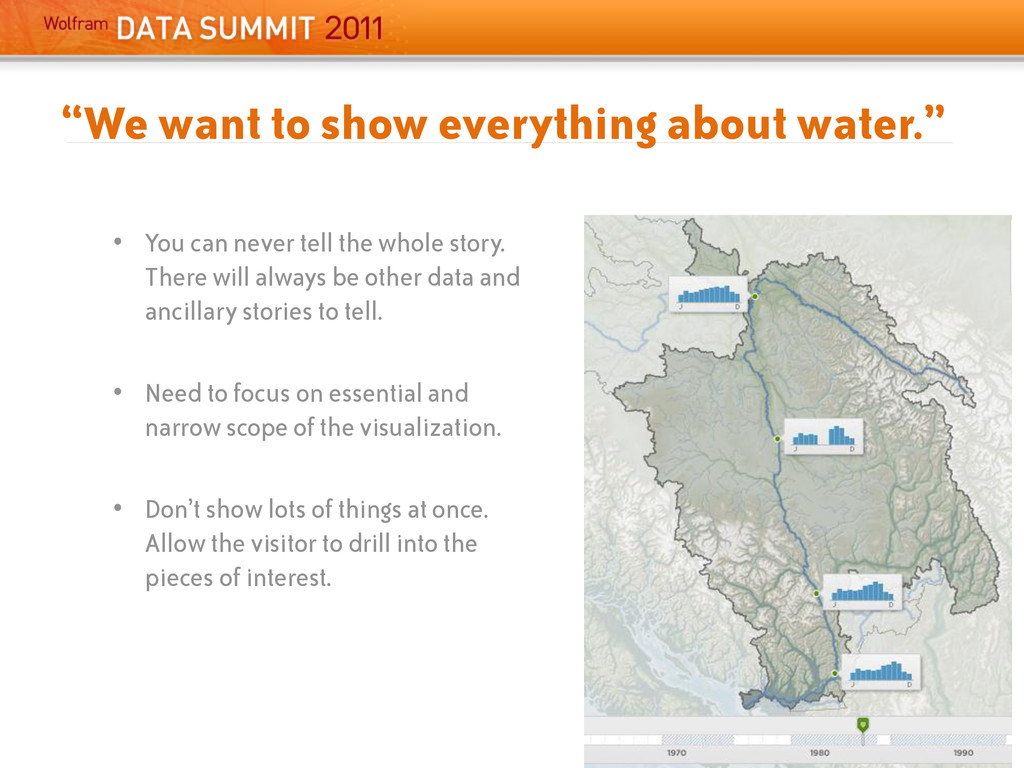
- Narrowing the scope of a visualization.
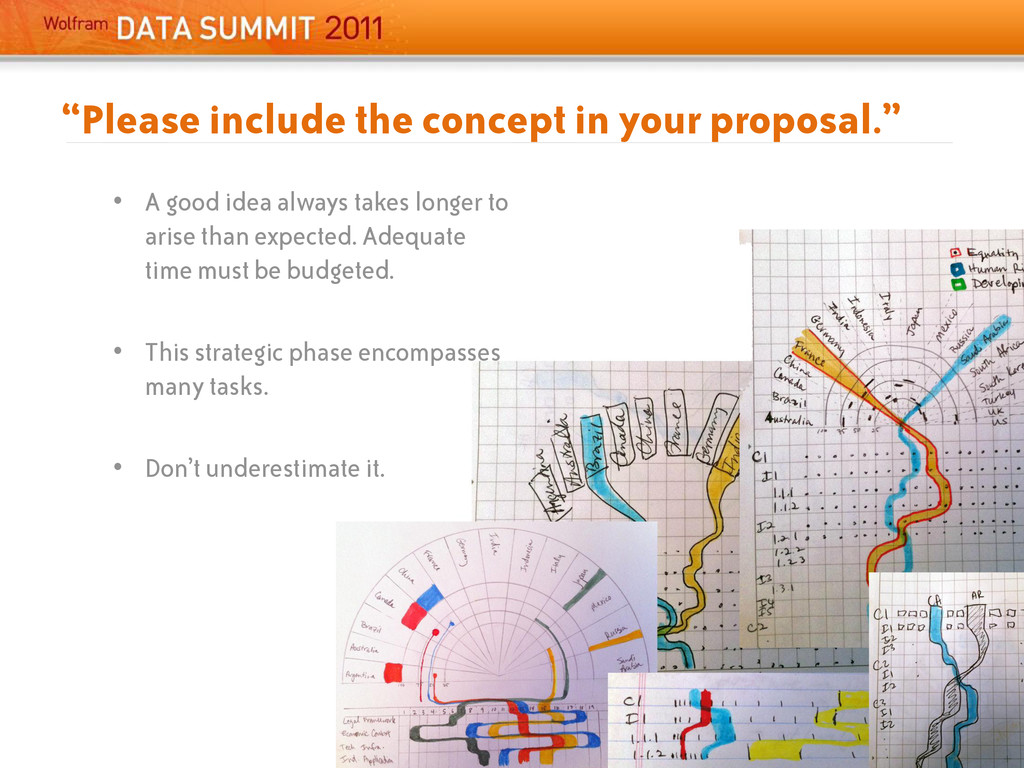
- Budgeting time.
Presented at Wolfram Data Summit 2011.