scikit-learn heavy users and hopefully contributors We like tricky problems, doubts, questions And love to share with data geeks about that ! DISCLAIMER - WHO ARE WE ? 2 | PyData 2015 - Paris
- Paris Explain why a given loan application did not meet credit underwriting policy Explain why a given transaction is suspicious Explain why a given job is recommended for an unemployed
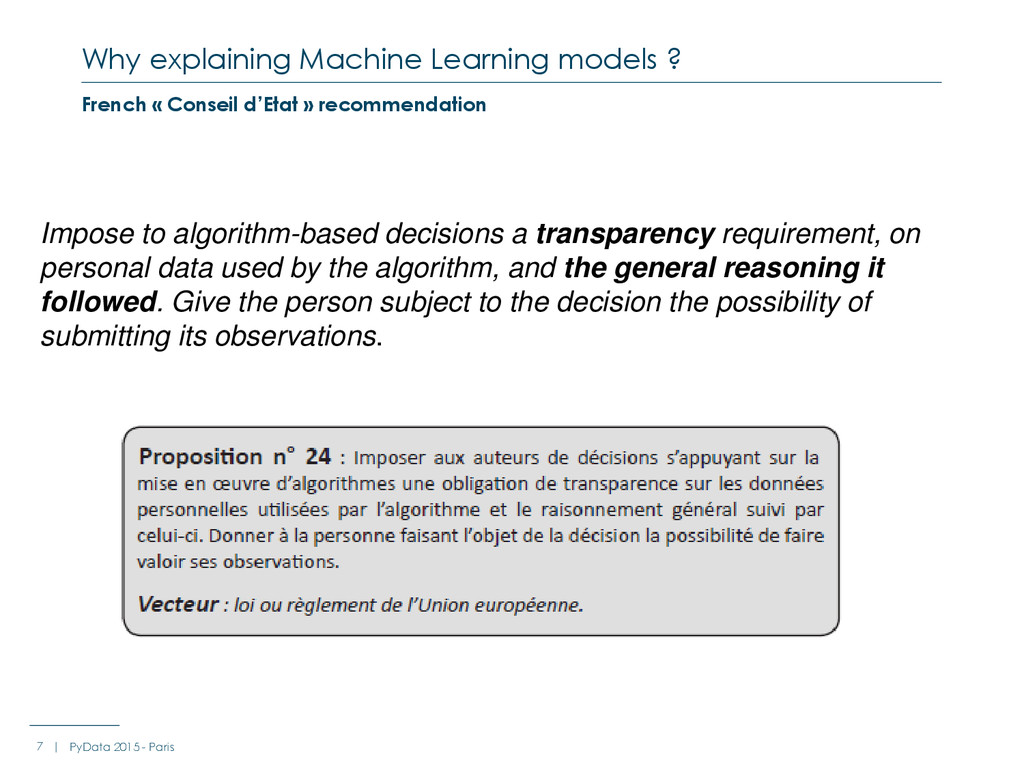
- Paris French « Conseil d’Etat » recommendation Impose to algorithm-based decisions a transparency requirement, on personal data used by the algorithm, and the general reasoning it followed. Give the person subject to the decision the possibility of submitting its observations.
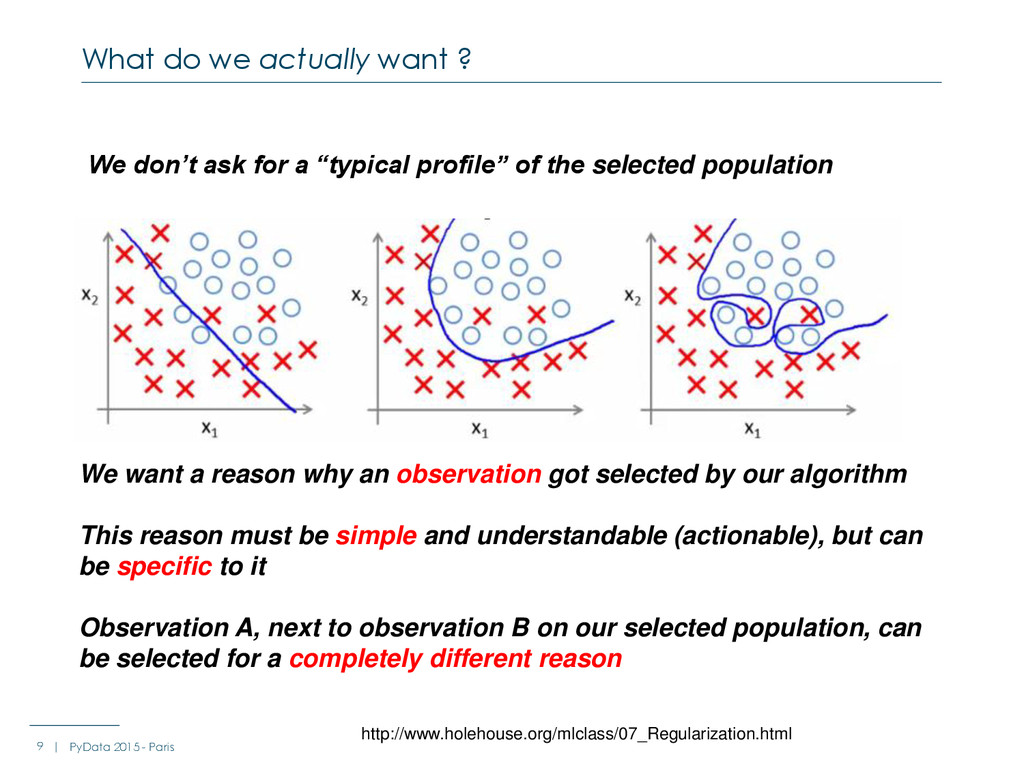
- Paris We don’t ask for a “typical profile” of the selected population We want a reason why an observation got selected by our algorithm This reason must be simple and understandable (actionable), but can be specific to it Observation A, next to observation B on our selected population, can be selected for a completely different reason http://www.holehouse.org/mlclass/07_Regularization.html
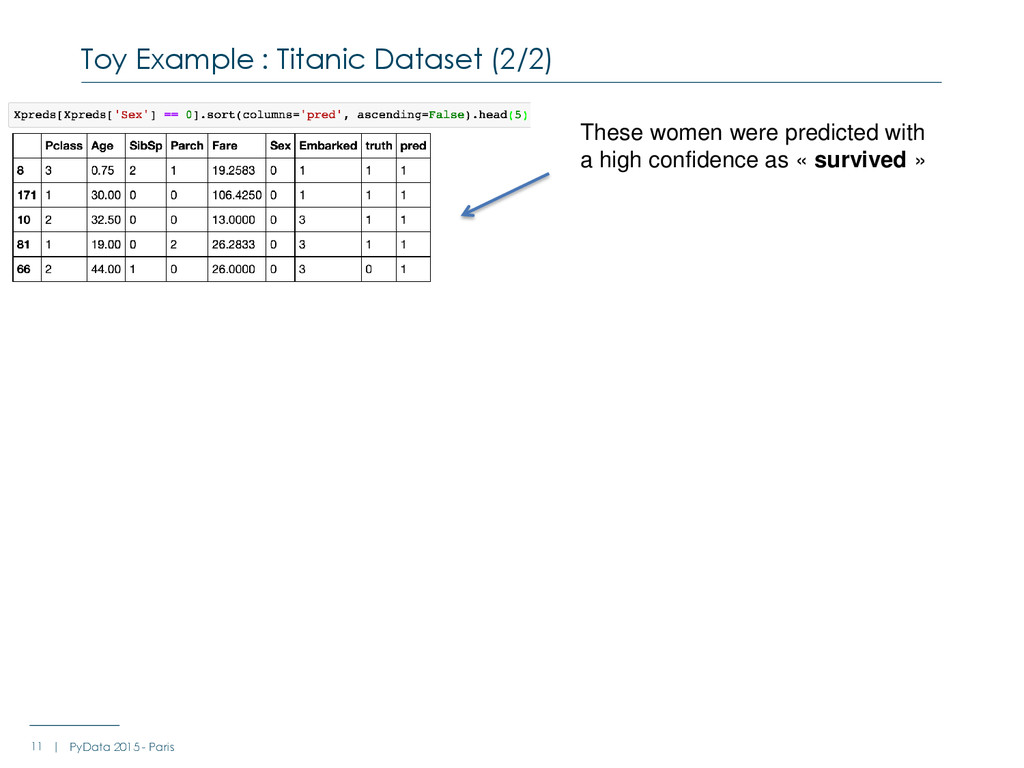
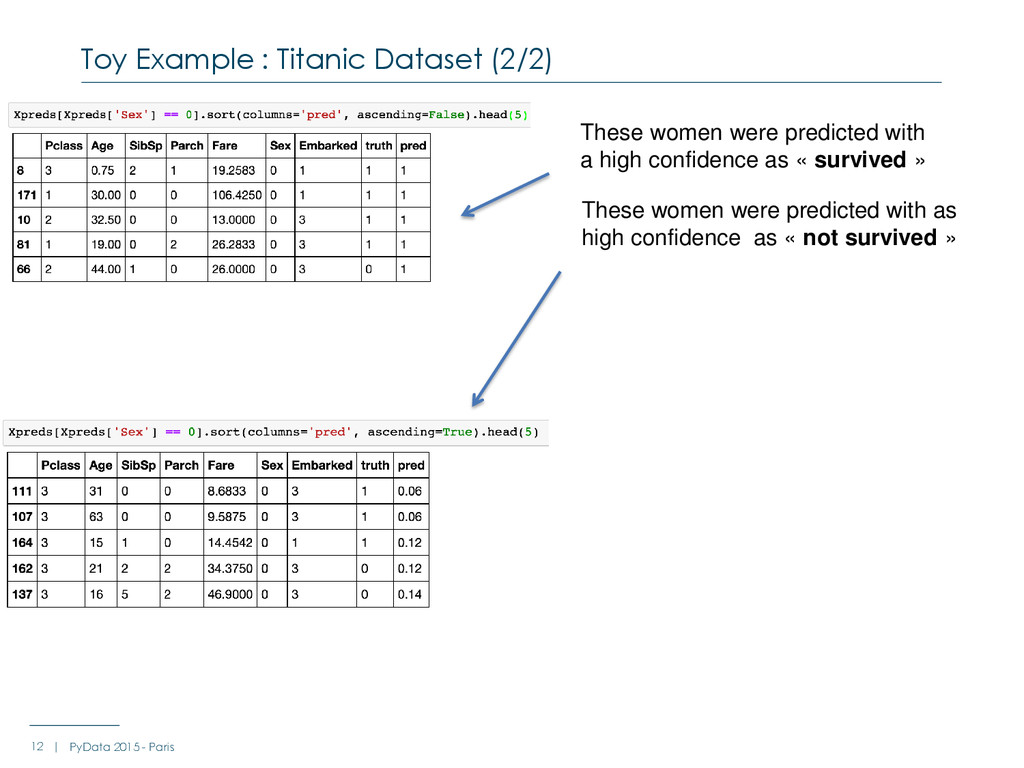
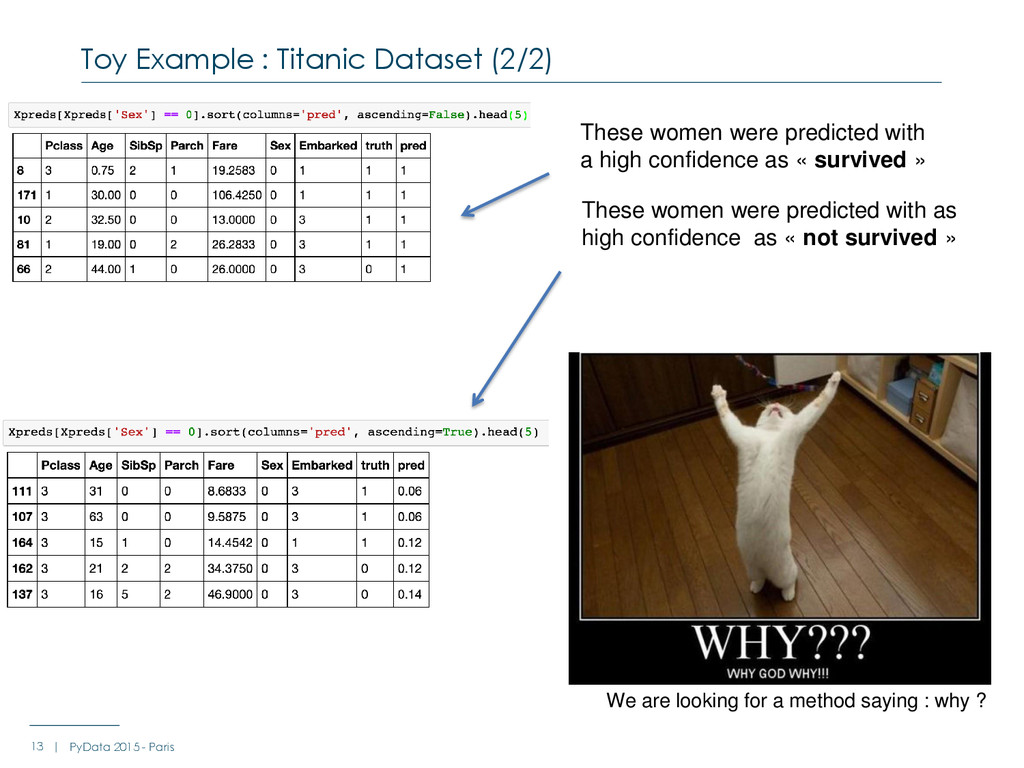
- Paris These women were predicted with as high confidence as « not survived » These women were predicted with a high confidence as « survived » We are looking for a method saying : why ?
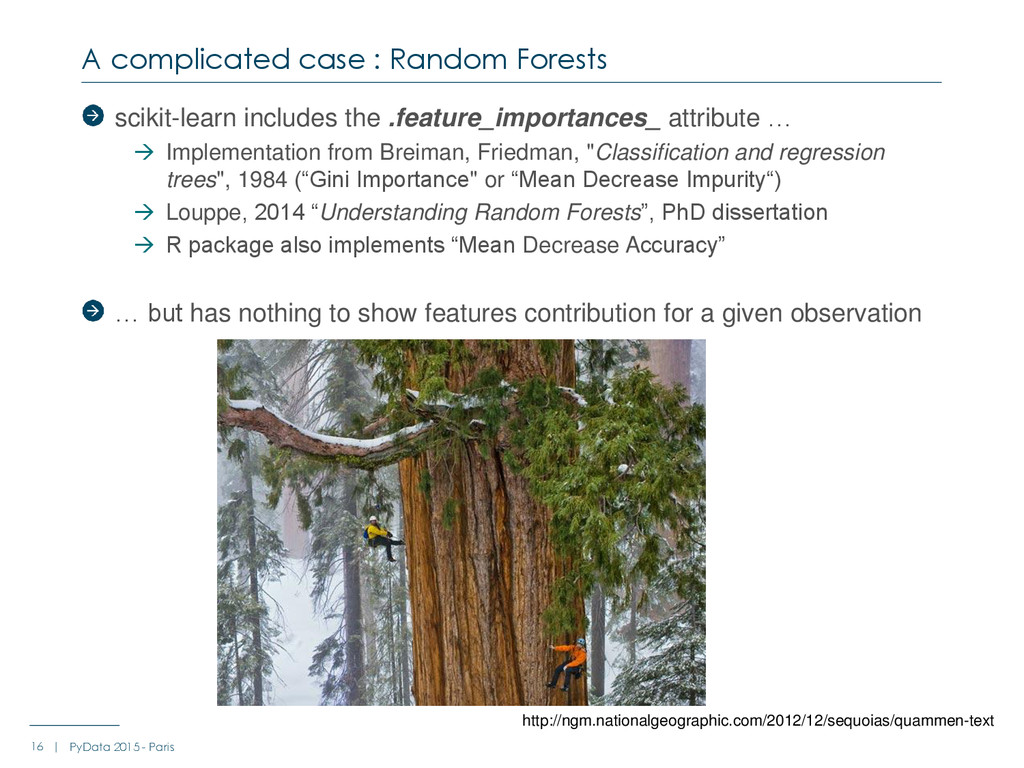
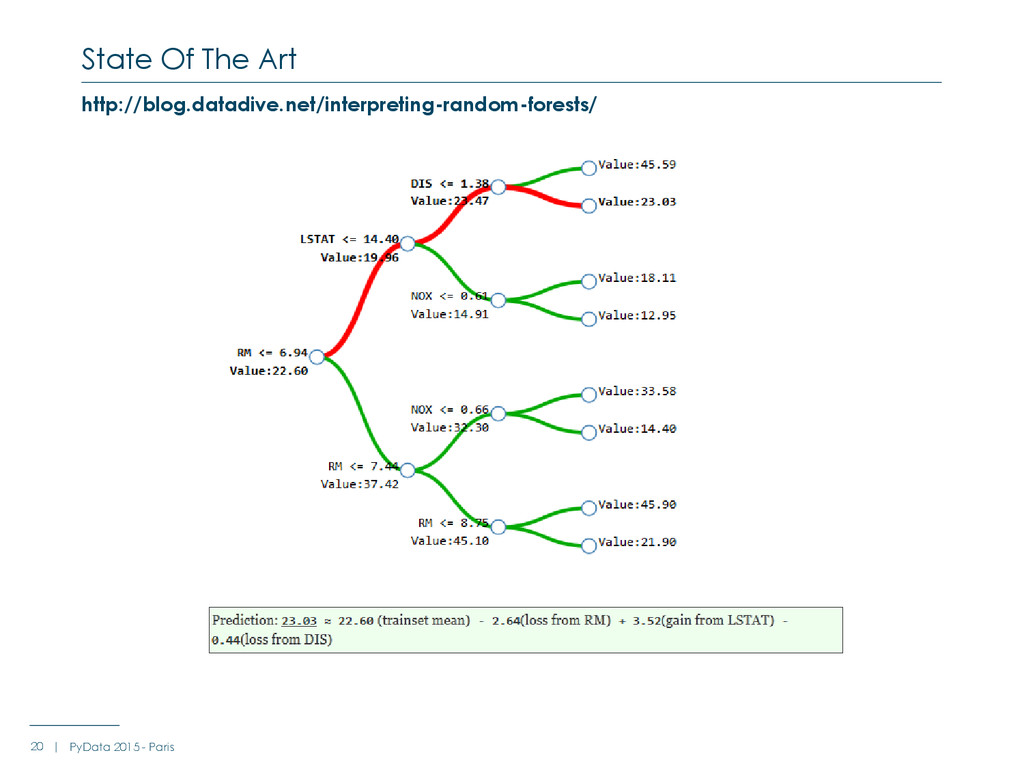
Friedman, "Classification and regression trees", 1984 (“Gini Importance" or “Mean Decrease Impurity“) Louppe, 2014 “Understanding Random Forests”, PhD dissertation R package also implements “Mean Decrease Accuracy” … but has nothing to show features contribution for a given observation A complicated case : Random Forests 16 | PyData 2015 - Paris http://ngm.nationalgeographic.com/2012/12/sequoias/quammen-text
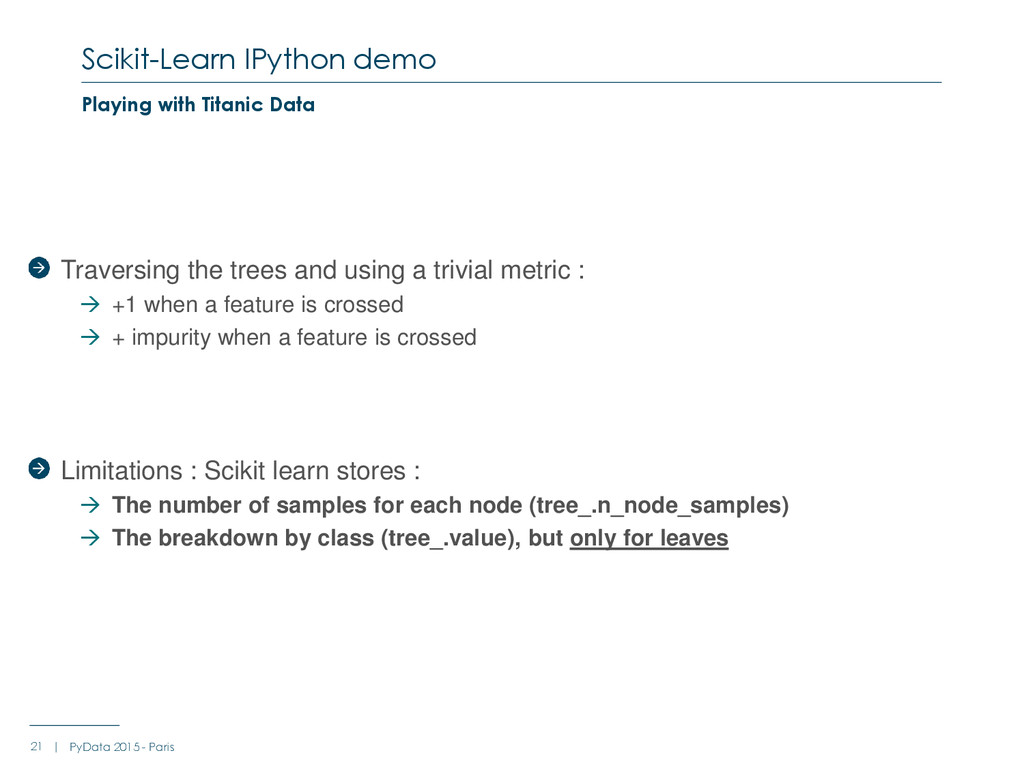
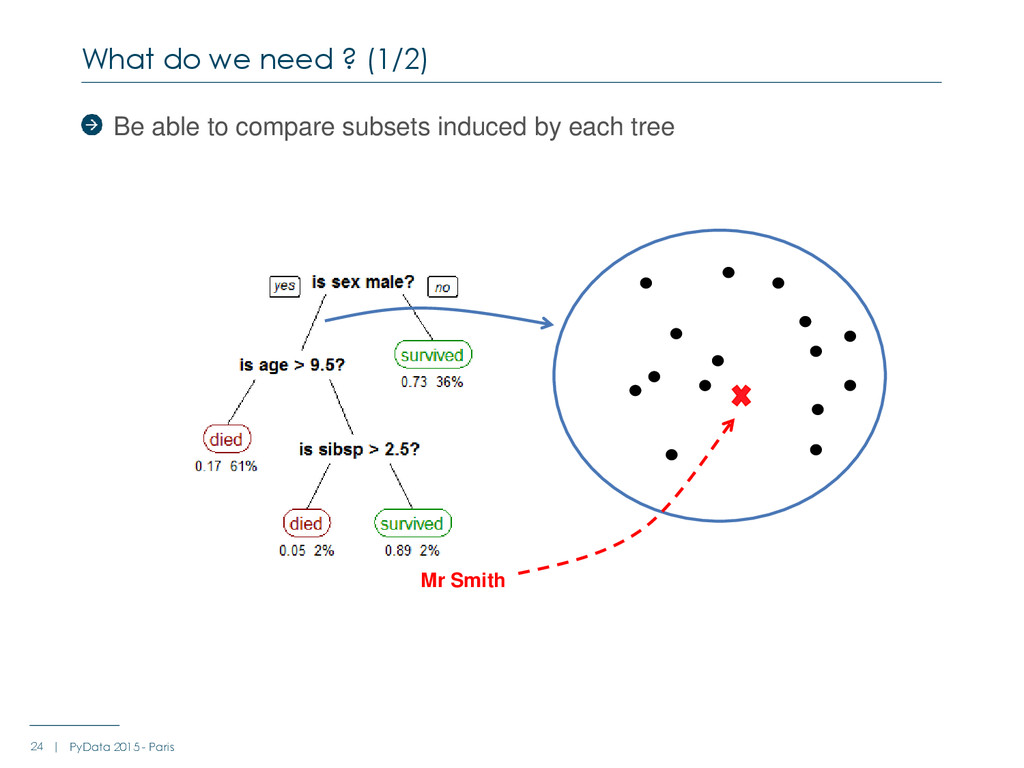
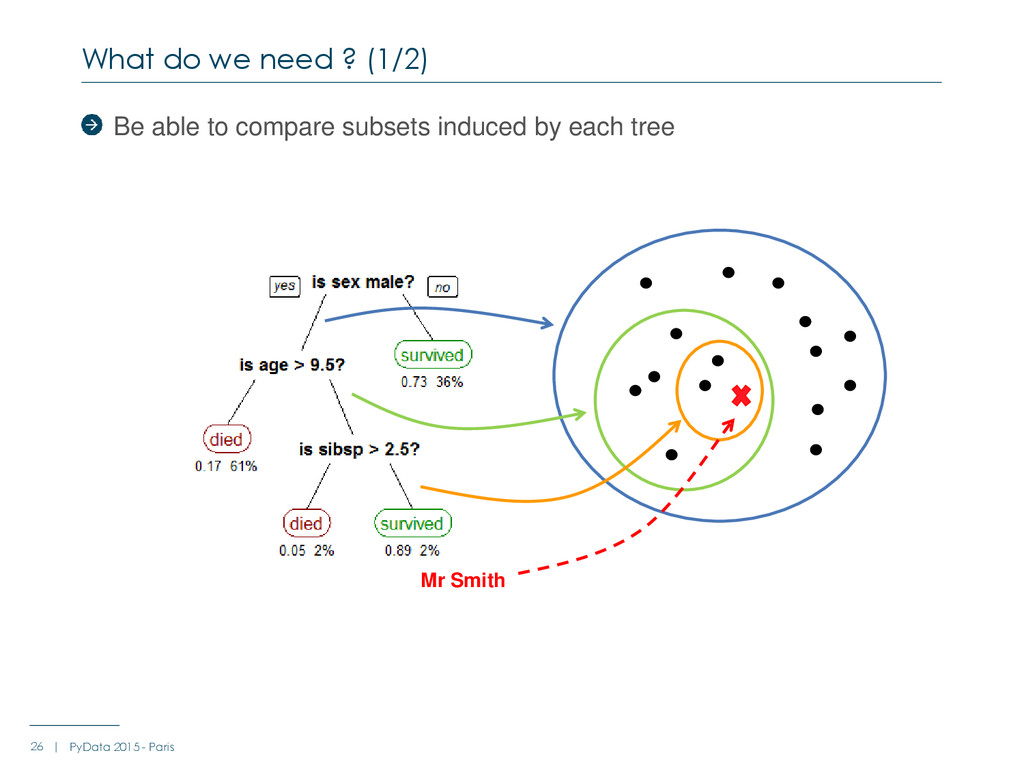
with Titanic Data Traversing the trees and using a trivial metric : +1 when a feature is crossed + impurity when a feature is crossed Limitations : Scikit learn stores : The number of samples for each node (tree_.n_node_samples) The breakdown by class (tree_.value), but only for leaves
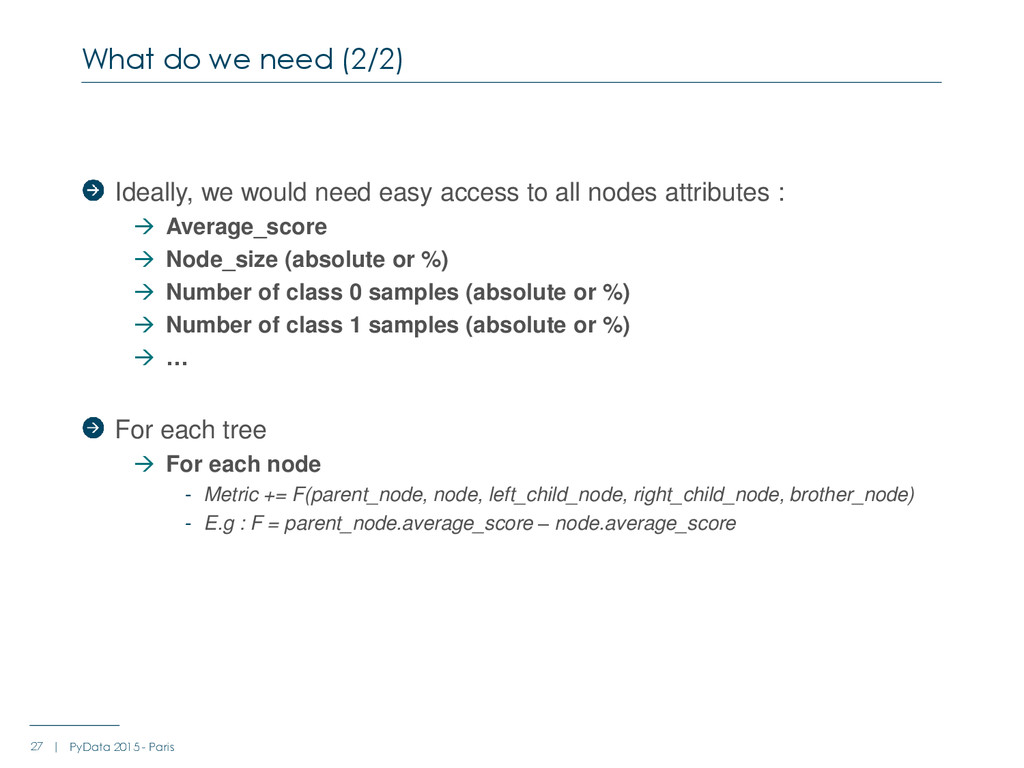
: Average_score Node_size (absolute or %) Number of class 0 samples (absolute or %) Number of class 1 samples (absolute or %) … For each tree For each node - Metric += F(parent_node, node, left_child_node, right_child_node, brother_node) - E.g : F = parent_node.average_score – node.average_score What do we need (2/2) 27 | PyData 2015 - Paris