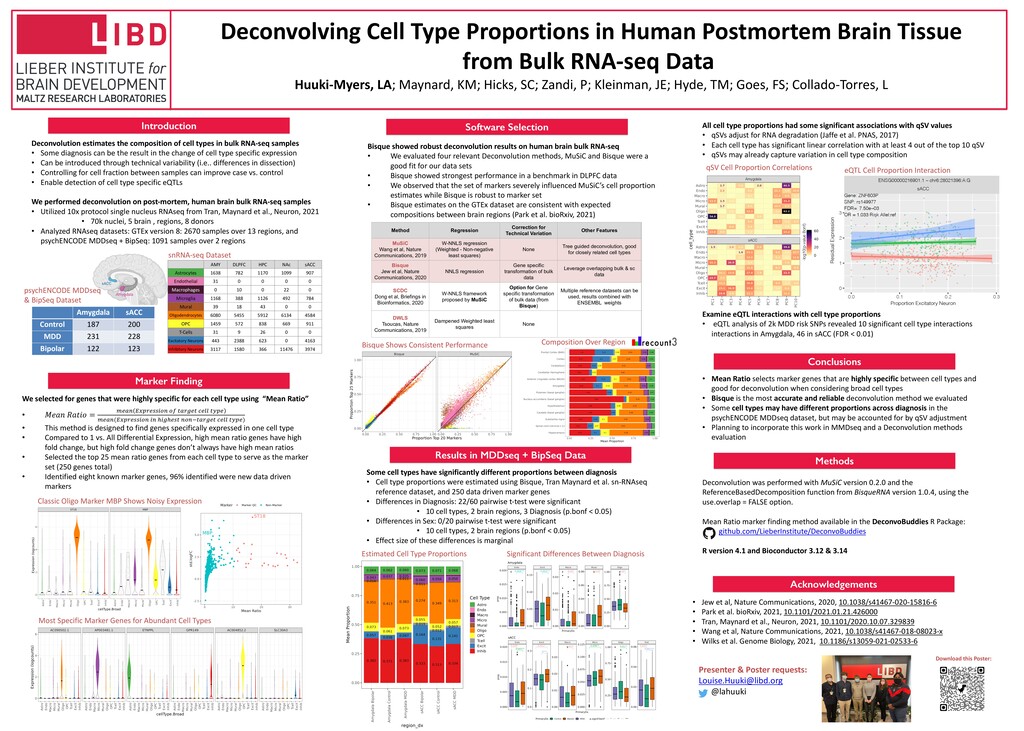
Bulk RNA-seq Data Huuki-Myers, LA; Maynard, KM; Hicks, SC; Zandi, P; Kleinman, JE; Hyde, TM; Goes, FS; Collado-Torres, L BAPTA Introduction Marker Finding Conclusions Acknowledgements Bisque showed robust deconvolution results on human brain bulk RNA-seq • We evaluated four relevant Deconvolution methods, MuSiC and Bisque were a good fit for our data sets • Bisque showed strongest performance in a benchmark in DLPFC data • We observed that the set of markers severely influenced MuSiC’s cell proportion estimates while Bisque is robust to marker set • Bisque estimates on the GTEx dataset are consistent with expected compositions between brain regions (Park et al. bioRxiv, 2021) We selected for genes that were highly specific for each cell type using “Mean Ratio” • !"#$ %#&'( = *+,- ./01+2234- 45 6,17+6 8+99 6:0+ *+,-(./01+2234- 3- <37<+26 -4-=6,17+6 8+99 6:0+) • This method is designed to find genes specifically expressed in one cell type • Compared to 1 vs. All Differential Expression, high mean ratio genes have high fold change, but high fold change genes don’t always have high mean ratios • Selected the top 25 mean ratio genes from each cell type to serve as the marker set (250 genes total) • Identified eight known marker genes, 96% identified were new data driven markers Results in MDDseq + BipSeq Data Software Selection Some cell types have significantly different proportions between diagnosis • Cell type proportions were estimated using Bisque, Tran Maynard et al. sn-RNAseq reference dataset, and 250 data driven marker genes • Differences in Diagnosis: 22/60 pairwise t-test were significant • 10 cell types, 2 brain regions, 3 Diagnosis (p.bonf < 0.05) • Differences in Sex: 0/20 pairwise t-test were significant • 10 cell types, 2 brain regions (p.bonf < 0.05) • Effect size of these differences is marginal • Jew et al, Nature Communications, 2020, 10.1038/s41467-020-15816-6 • Park et al. bioRxiv, 2021, 10.1101/2021.01.21.426000 • Tran, Maynard et al., Neuron, 2021, 10.1101/2020.10.07.329839 • Wang et al, Nature Communications, 2021, 10.1038/s41467-018-08023-x • Wilks et al. Genome Biology, 2021, 10.1186/s13059-021-02533-6 Method Regression Correction for Technical Variation Other Features MuSiC Wang et al, Nature Communications, 2019 W-NNLS regression (Weighted - Non-negative least squares) None Tree guided deconvolution, good for closely related cell types Bisque Jew et al, Nature Communications, 2020 NNLS regression Gene specific transformation of bulk data Leverage overlapping bulk & sc data SCDC Dong et al, Briefings in Bioinformatics, 2020 W-NNLS framework proposed by MuSiC Option for Gene specific transformation of bulk data (from Bisque) Multiple reference datasets can be used, results combined with ENSEMBL weights DWLS Tsoucas, Nature Communications, 2019 Dampened Weighted least squares None Deconvolution estimates the composition of cell types in bulk RNA-seq samples • Some diagnosis can be the result in the change of cell type specific expression • Can be introduced through technical variability (i.e.. differences in dissection) • Controlling for cell fraction between samples can improve case vs. control • Enable detection of cell type specific eQTLs We performed deconvolution on post-mortem, human brain bulk RNA-seq samples • Utilized 10x protocol single nucleus RNAseq from Tran, Maynard et al., Neuron, 2021 • 70k nuclei, 5 brain , regions, 8 donors • Analyzed RNAseq datasets: GTEx version 8: 2670 samples over 13 regions, and psychENCODE MDDseq + BipSeq: 1091 samples over 2 regions Most Specific Marker Genes for Abundant Cell Types Amygdala sACC Control 187 200 MDD 231 228 Bipolar 122 123 AMY DLPFC HPC NAc sACC Astrocytes 1638 782 1170 1099 907 Endothelial 31 0 0 0 0 Macrophages 0 10 0 22 0 Microglia 1168 388 1126 492 784 Mural 39 18 43 0 0 Oligodendrocytes 6080 5455 5912 6134 4584 OPC 1459 572 838 669 911 T-Cells 31 9 26 0 0 Excitatory Neurons 443 2388 623 0 4163 Inhibitory Neurons 3117 1580 366 11476 3974 Classic Oligo Marker MBP Shows Noisy Expression Estimated Cell Type Proportions Significant Differences Between Diagnosis All cell type proportions had some significant associations with qSV values • qSVs adjust for RNA degradation (Jaffe et al. PNAS, 2017) • Each cell type has significant linear correlation with at least 4 out of the top 10 qSV • qSVs may already capture variation in cell type composition Methods Deconvolution was performed with MuSiC version 0.2.0 and the ReferenceBasedDecomposition function from BisqueRNA version 1.0.4, using the use.overlap = FALSE option. Mean Ratio marker finding method available in the DeconvoBuddies R Package: github.com/LieberInstitute/DeconvoBuddies R version 4.1 and Bioconductor 3.12 & 3.14 • Mean Ratio selects marker genes that are highly specific between cell types and good for deconvolution when considering broad cell types • Bisque is the most accurate and reliable deconvolution method we evaluated • Some cell types may have different proportions across diagnosis in the psychENCODE MDDseq dataset, but may be accounted for by qSV adjustment • Planning to incorporate this work in MMDseq and a Deconvolution methods evaluation Presenter & Poster requests:
[email protected] @lahuuki Bisque Shows Consistent Performance snRNA-seq Dataset psychENCODE MDDseq & BipSeq Dataset Composition Over Region Examine eQTL interactions with cell type proportions • eQTL analysis of 2k MDD risk SNPs revealed 10 significant cell type interactions interactions in Amygdala, 46 in sACC (FDR < 0.01) Download this Poster: eQTL Cell Proportion Interaction Residual Expression Proportion Excitatory Neuron sACC qSV Cell Proportion Correlations Amygdala sACC -log10(p-value Bonf)