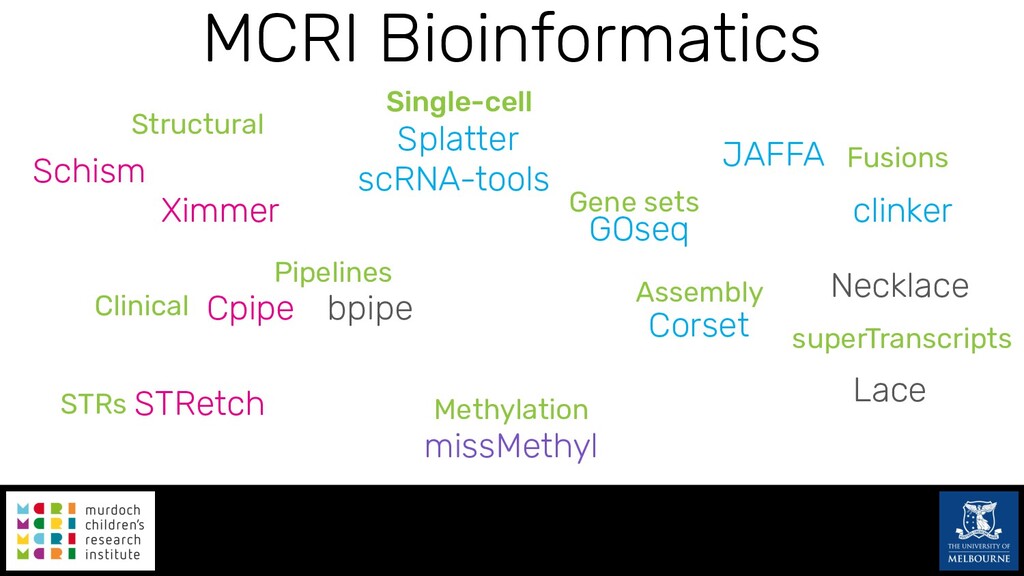
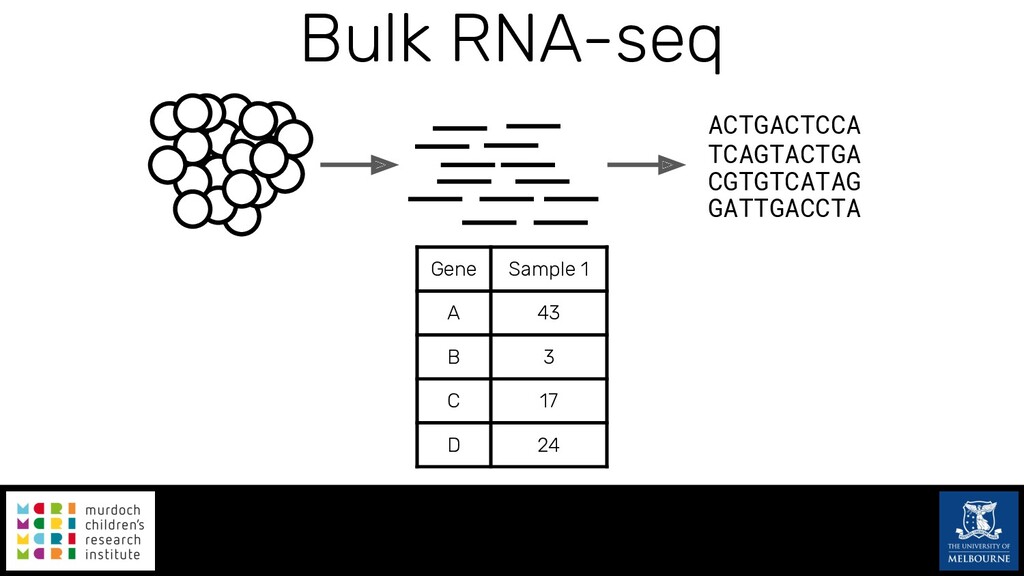
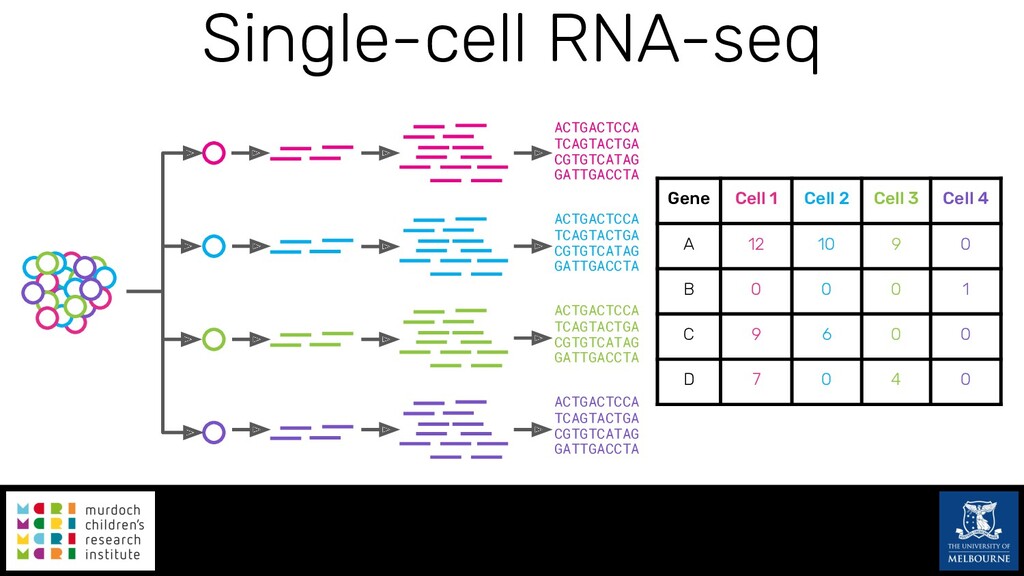
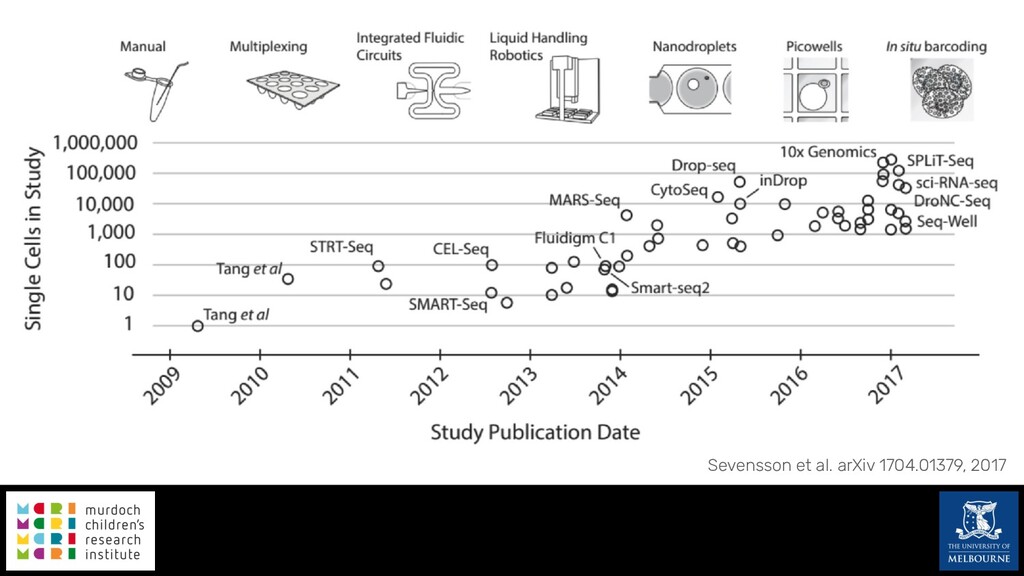
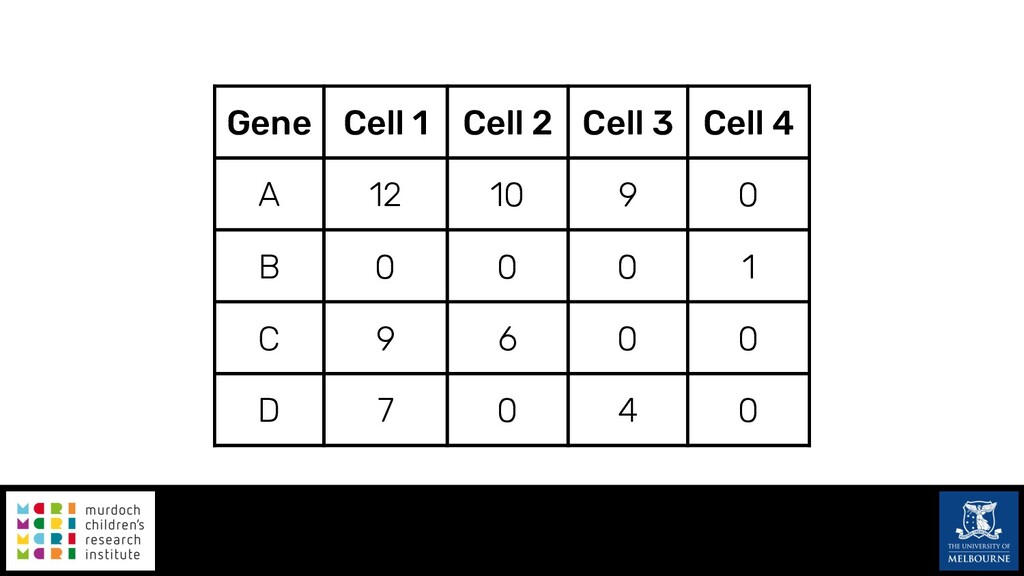
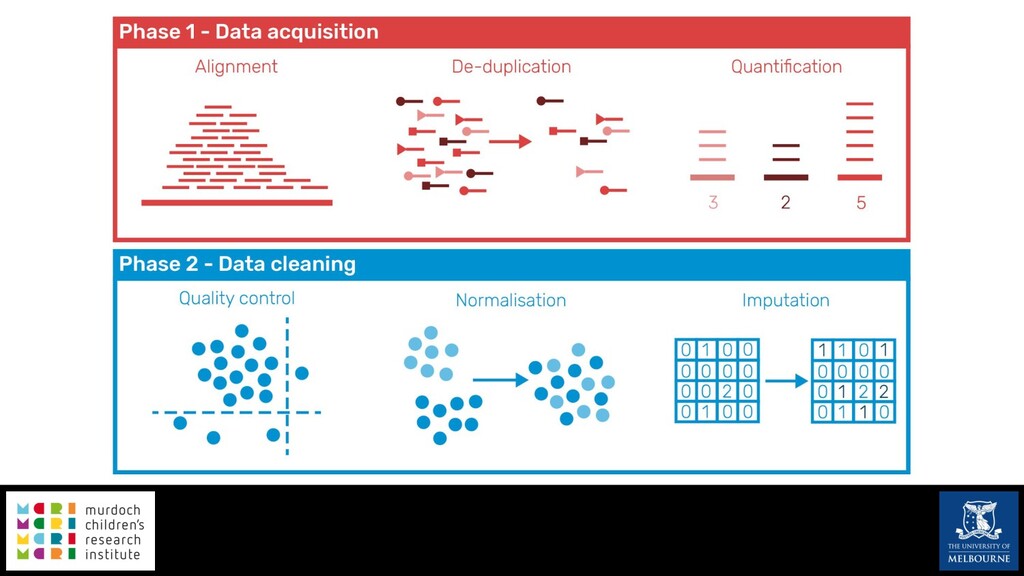
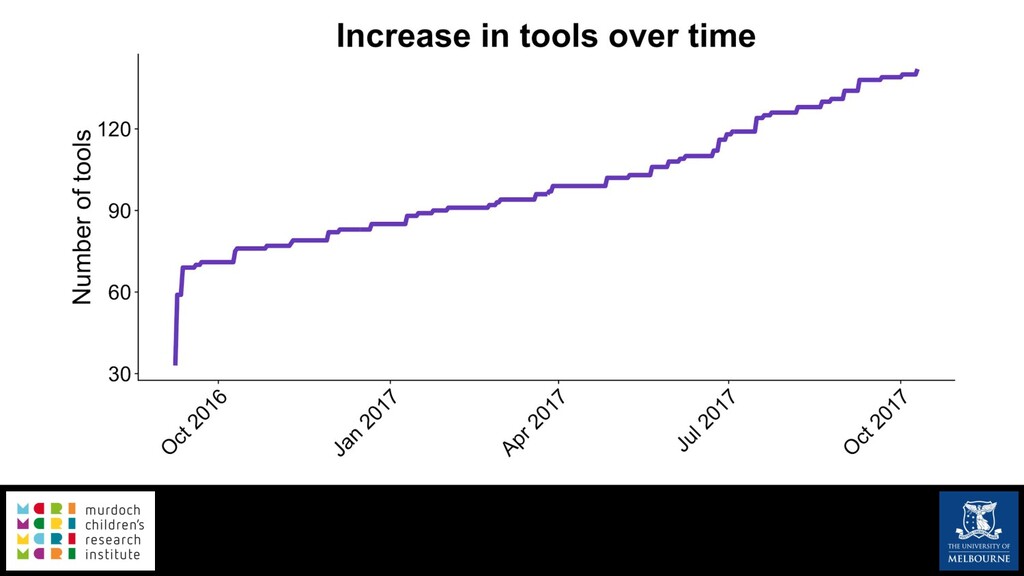
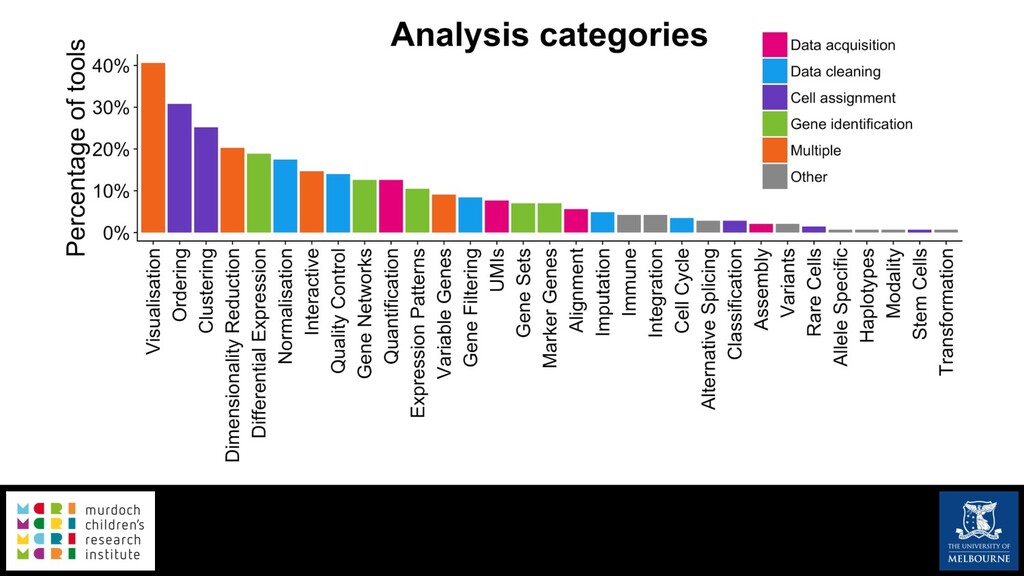
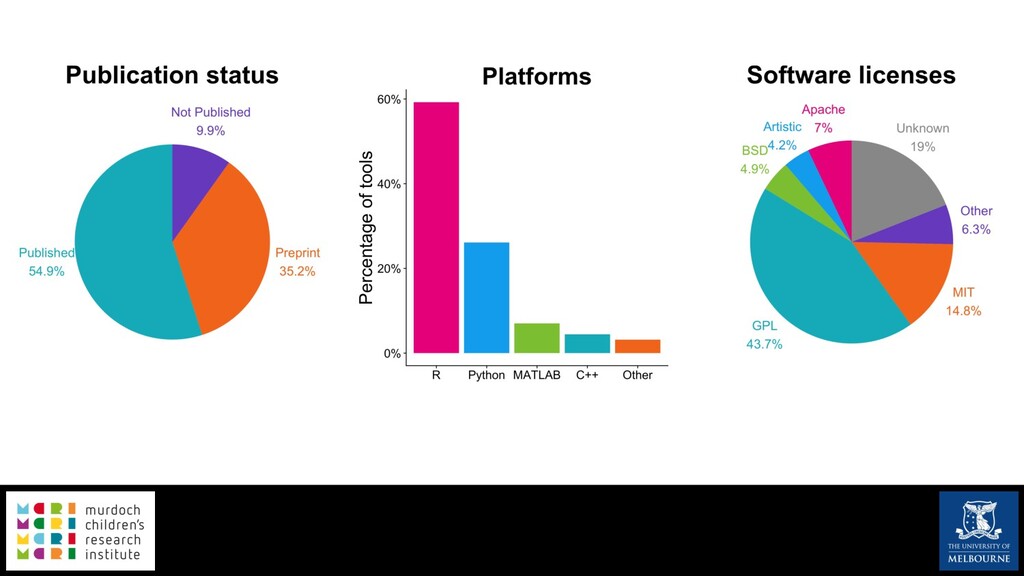
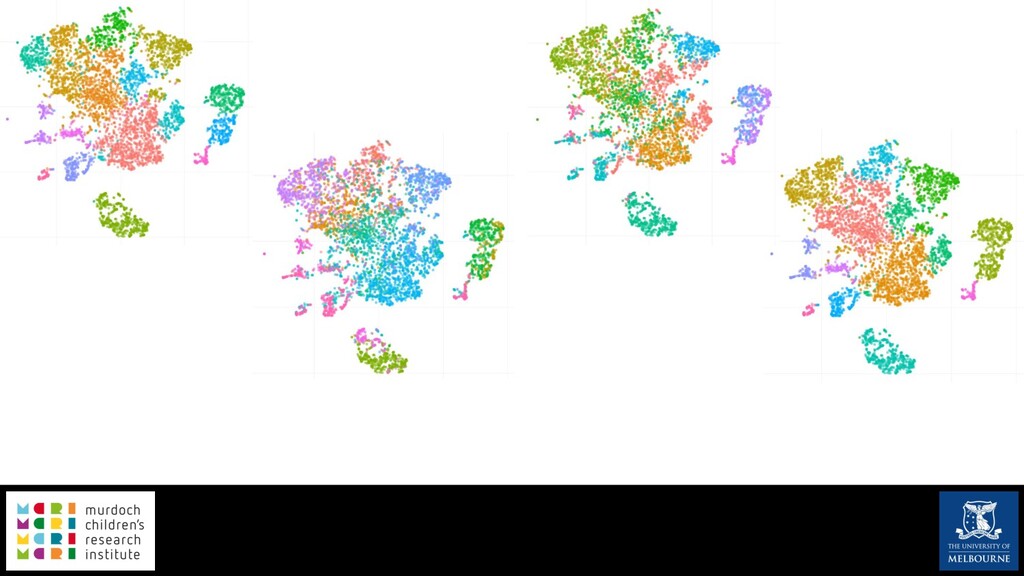
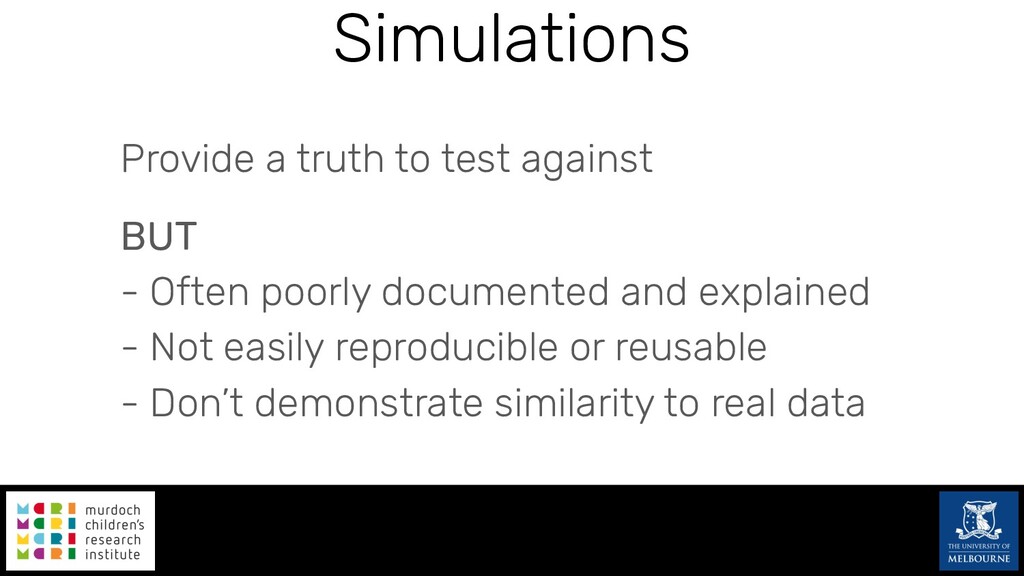
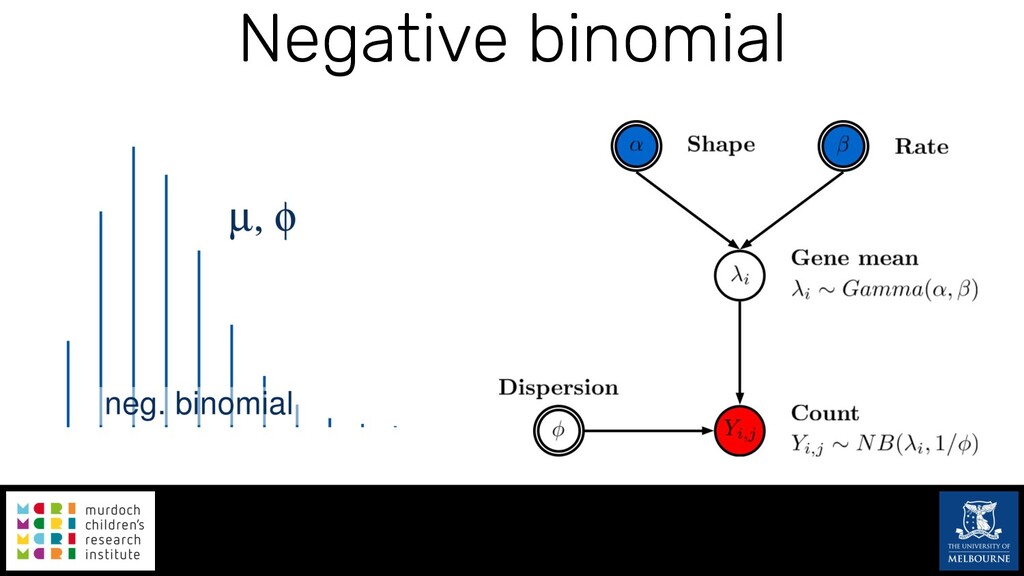
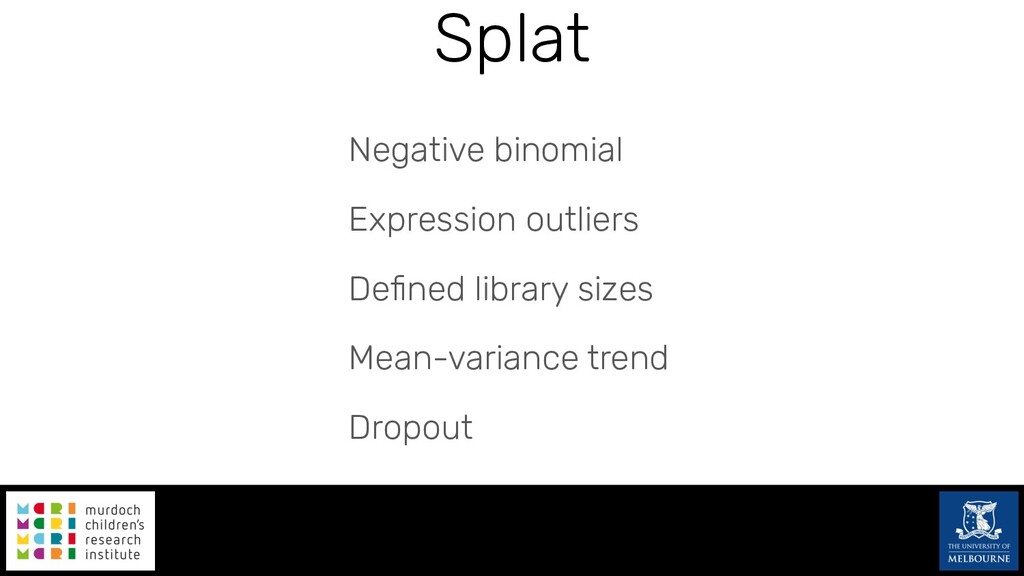
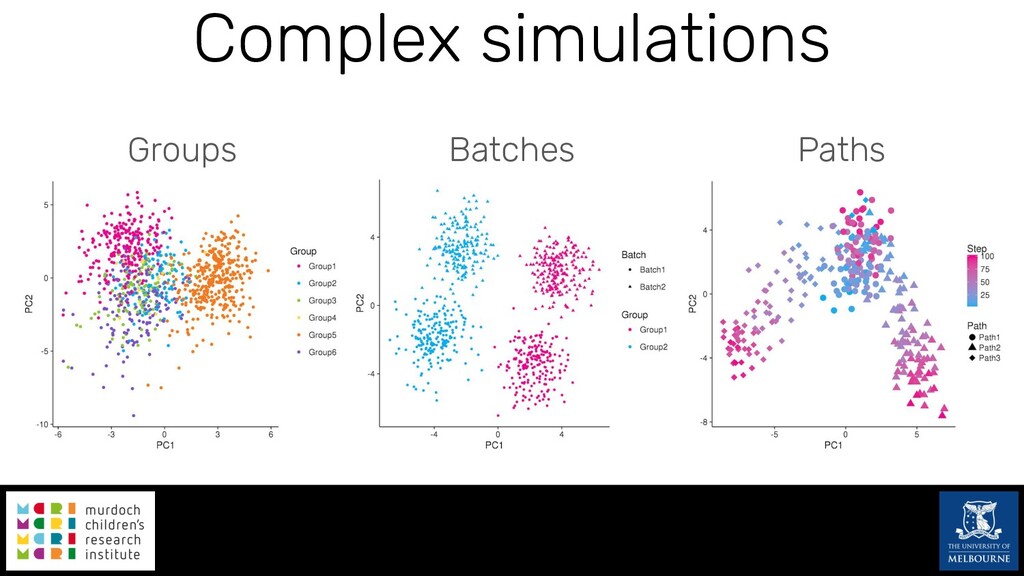
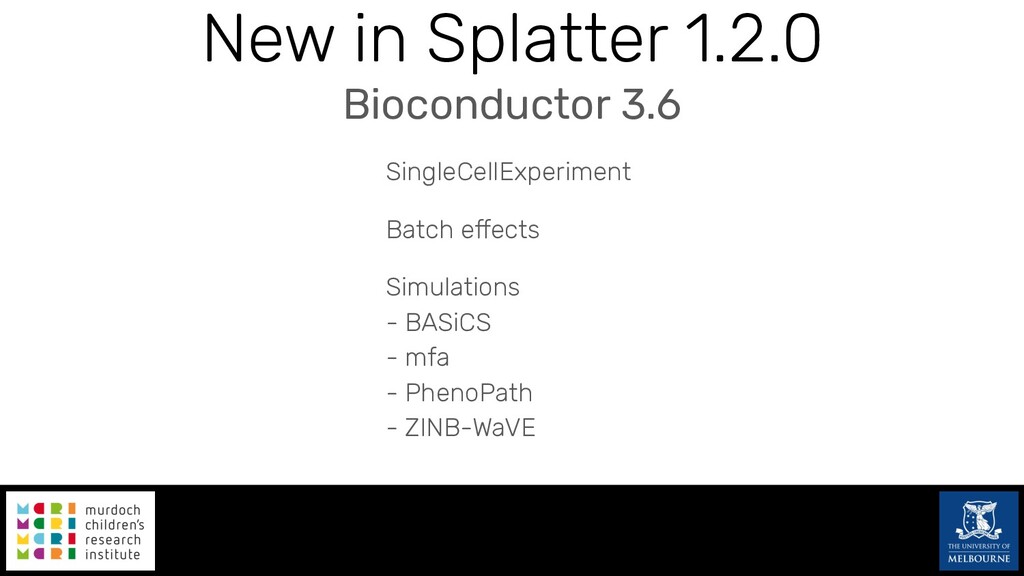
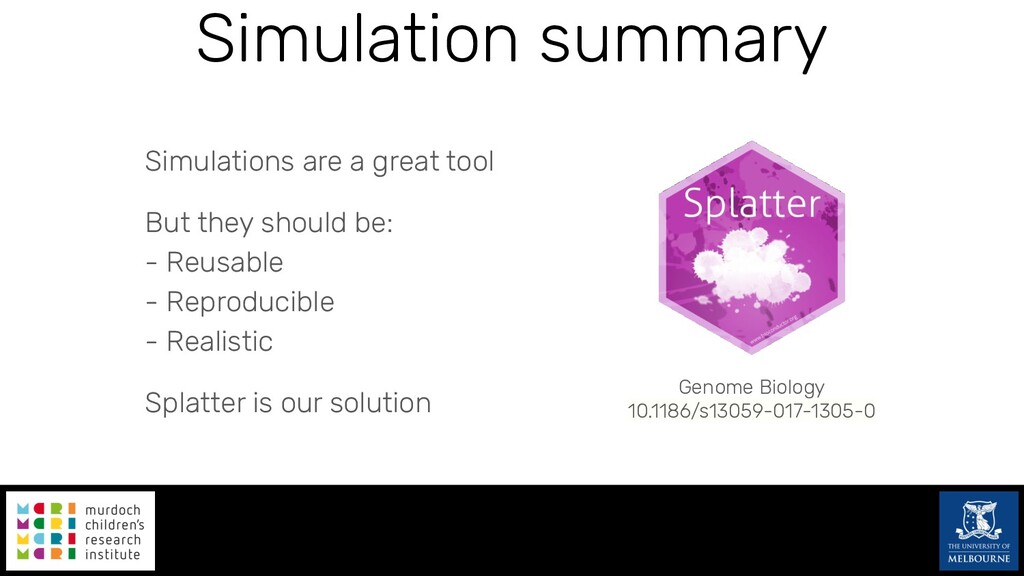
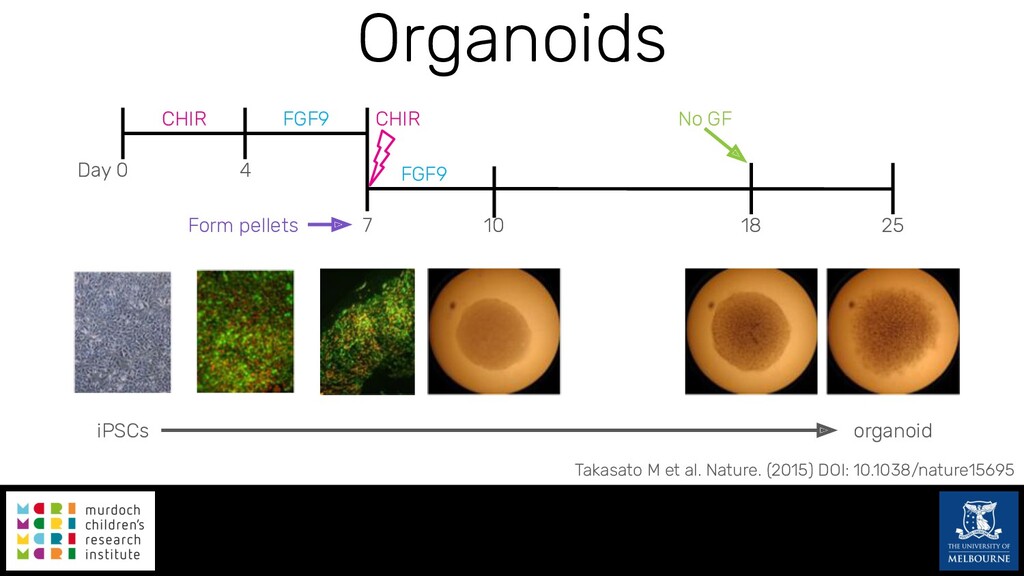
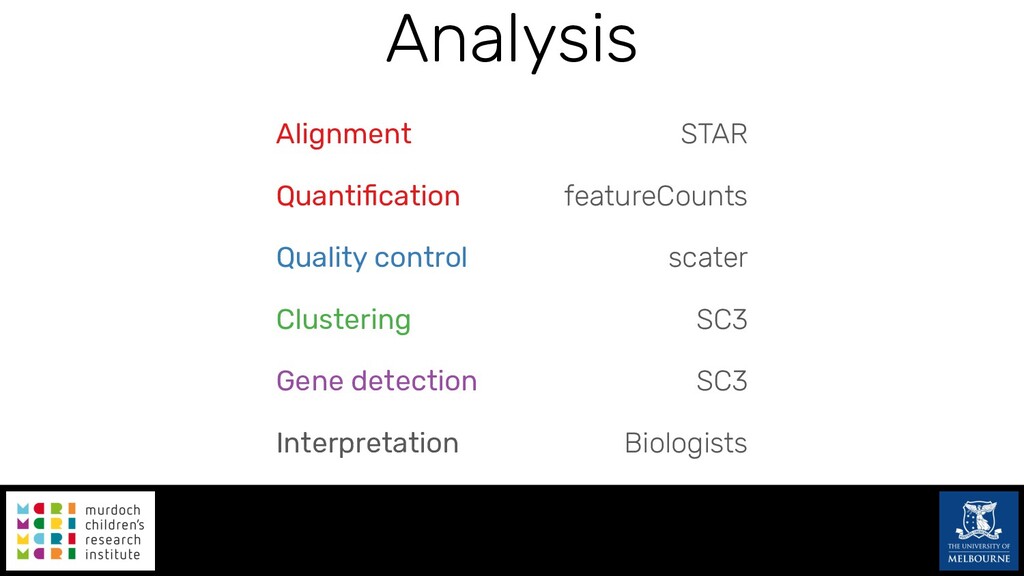
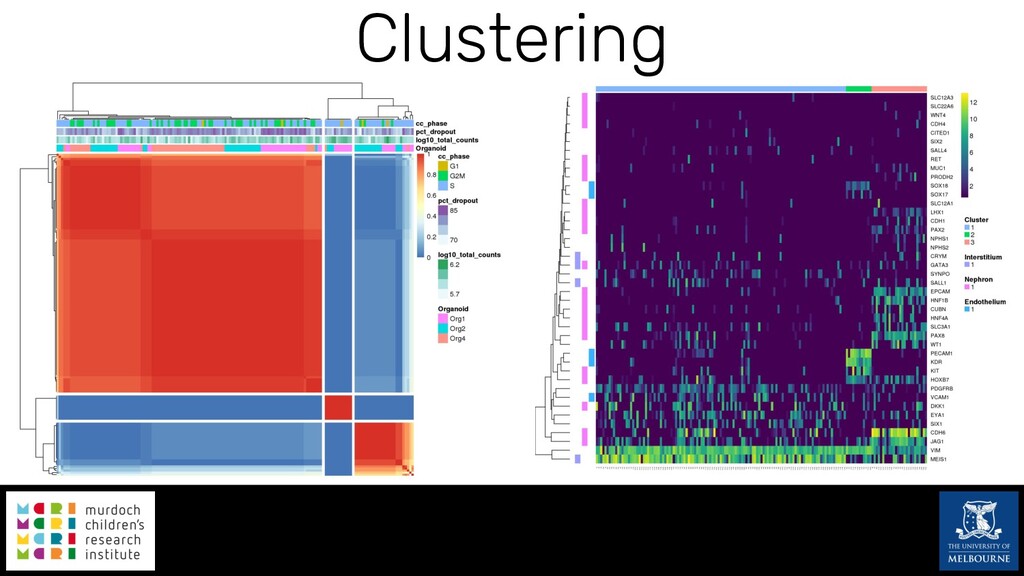
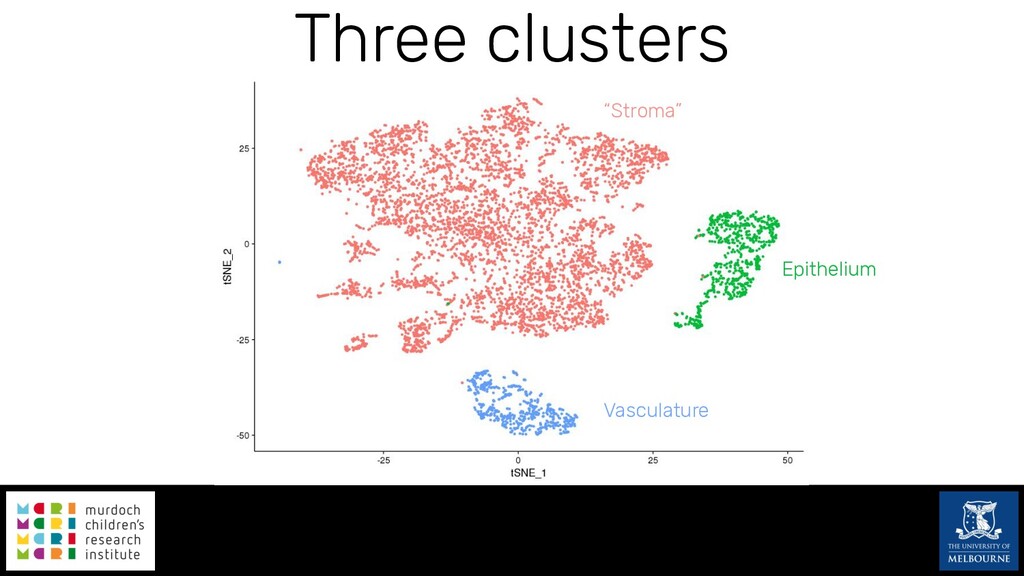
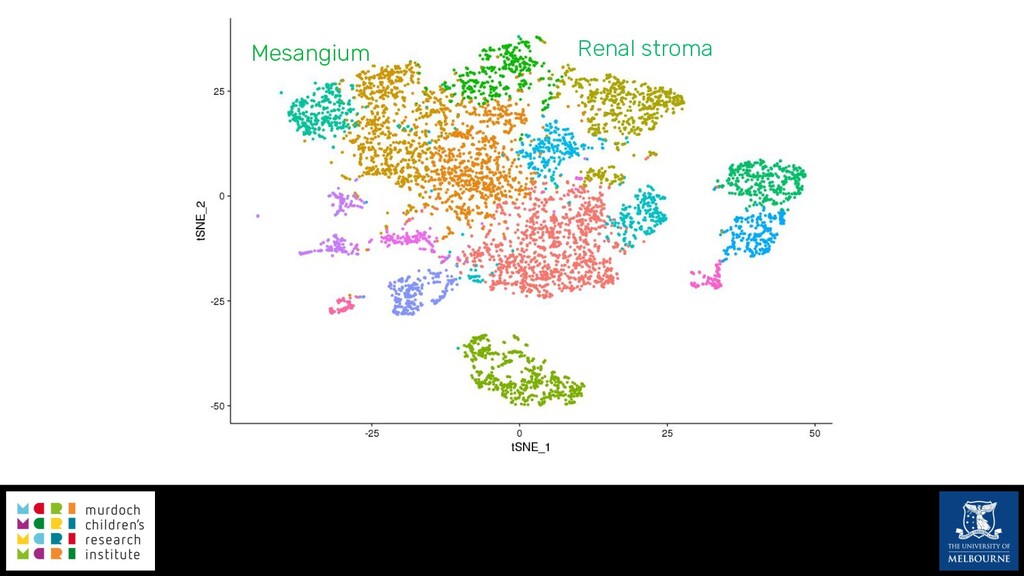
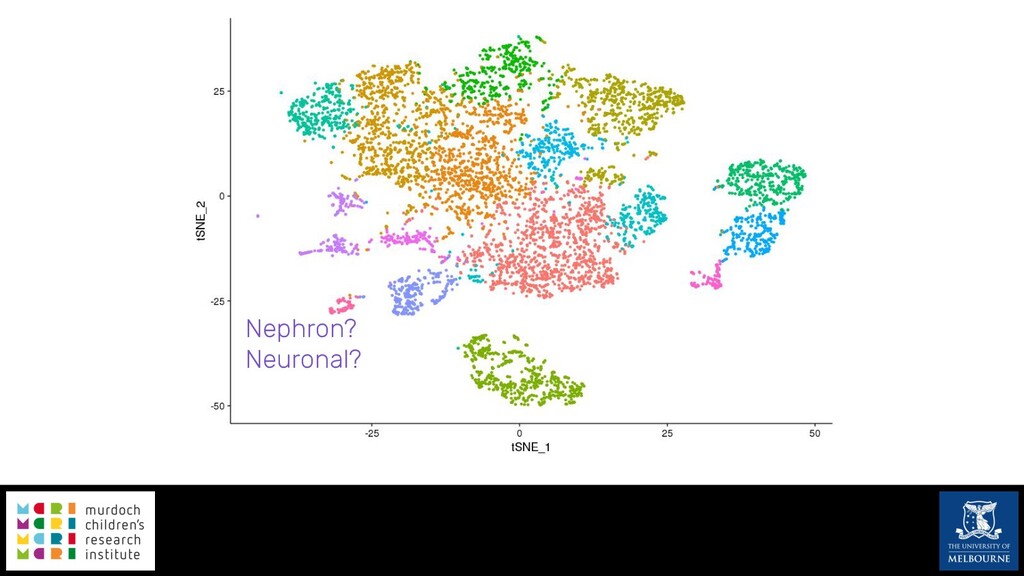
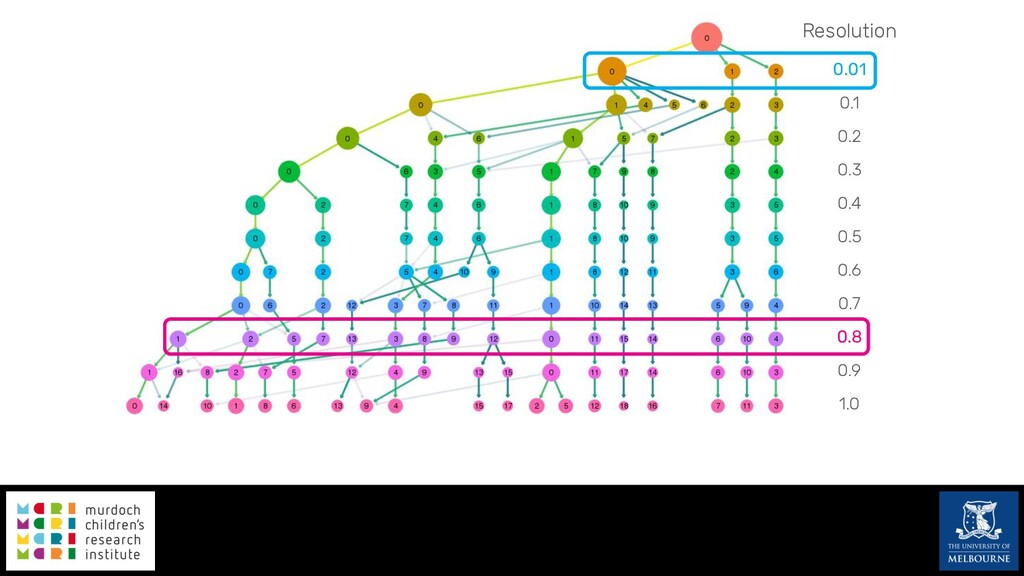
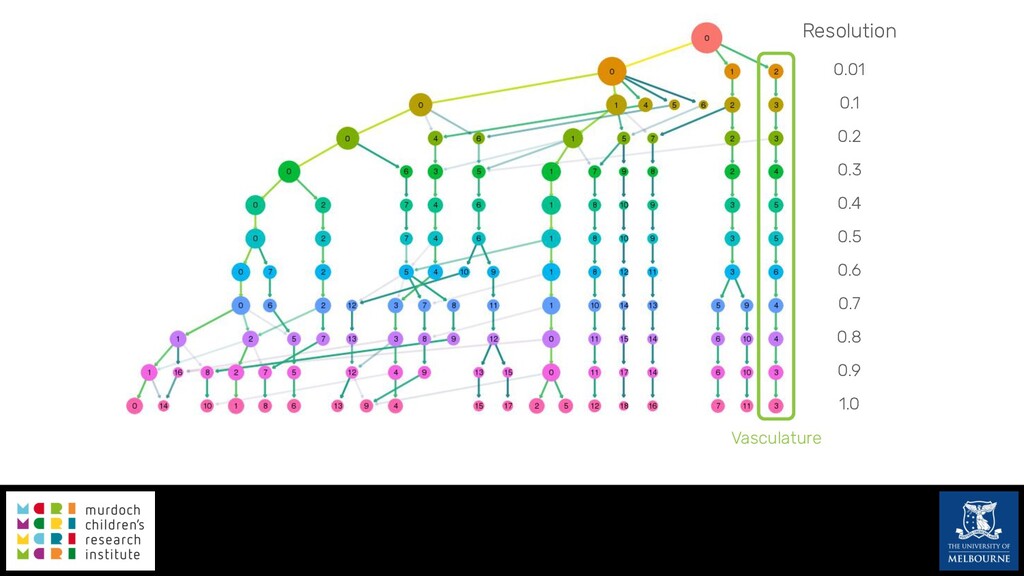
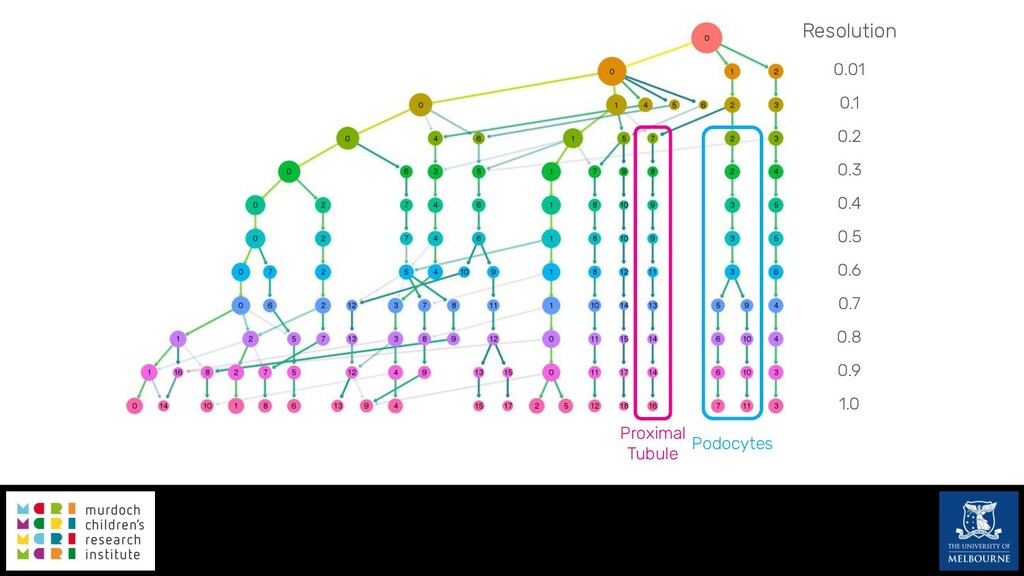
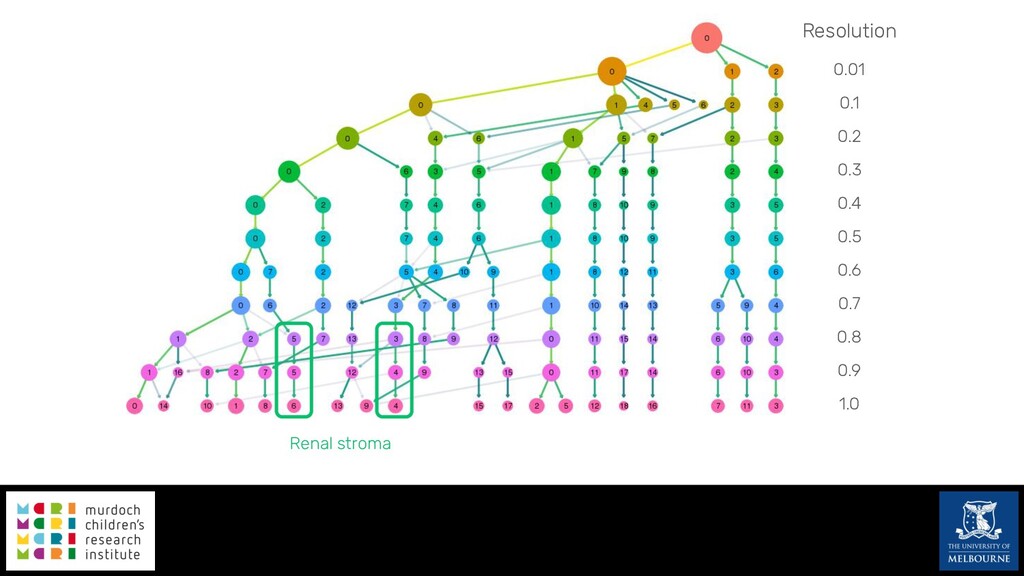
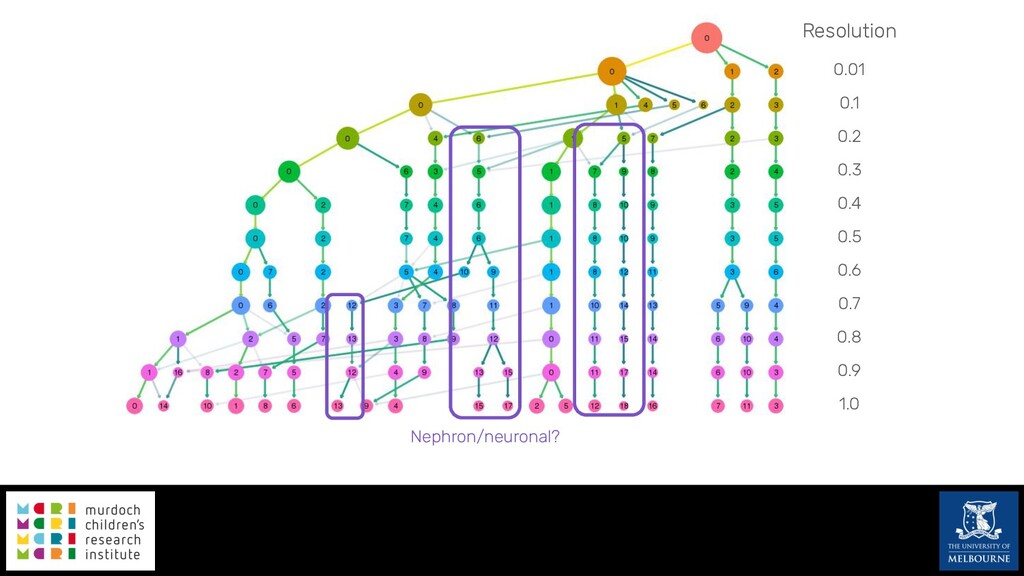
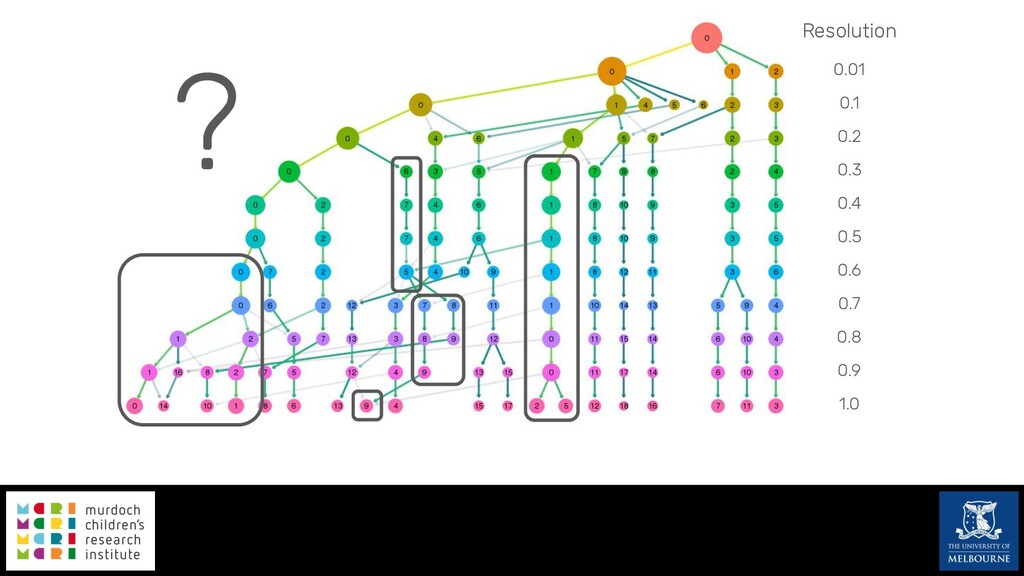
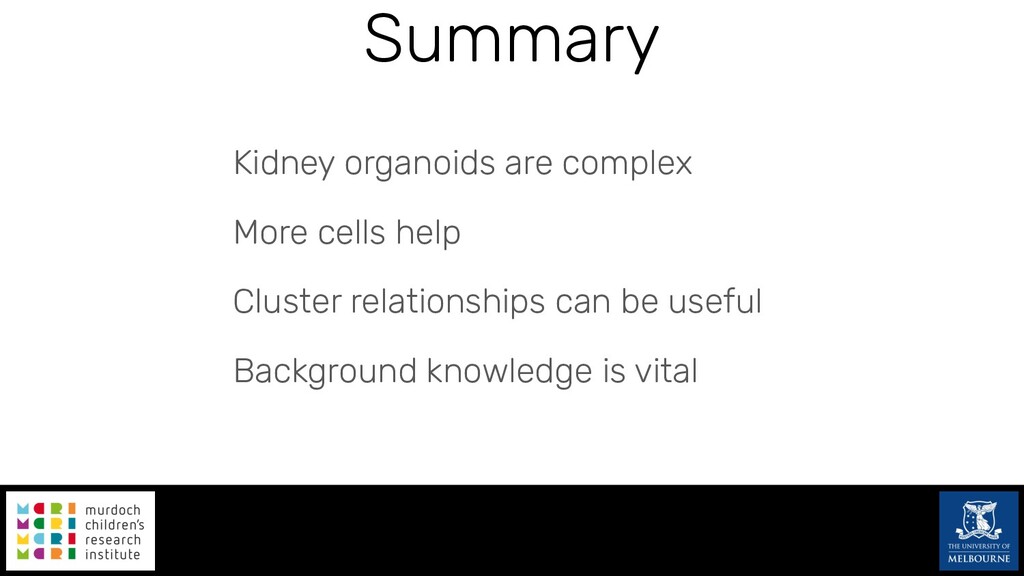
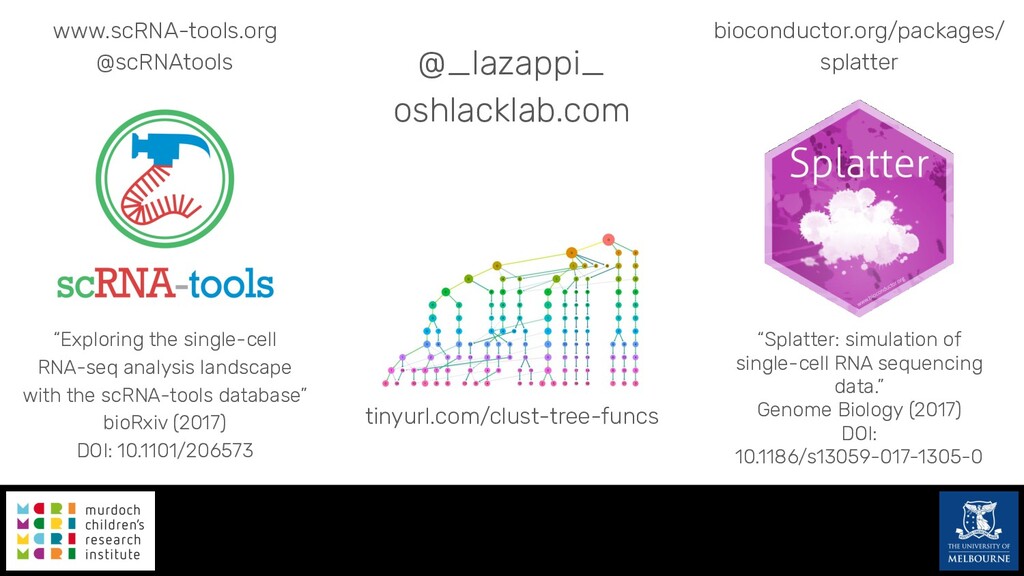
Single-cell RNA sequencing (scRNA-seq) is rapidly becoming a tool of choice for biologists wishing to investigate gene expression at greater resolution, particularly in areas such as development and differentiation. Single-cell data presents an array of bioinformatics challenges, data is sparse (for both biological and technical reasons), quality control is difficult and it is unclear how to replicate measurements. As scRNA-seq datasets have become available so have a plethora of analysis methods. We have catalogued software tools that implement these methods in the scRNA-tools database (www.scRNA-tools.org). Evaluation of analysis methods relies on having a truth to test against or deep biological knowledge to interpret the results. Unfortunately current scRNA-seq simulations are frequently poorly documented, not reproducible and do not demonstrate similarity to real data or experimental designs. In this talk I will present Splatter, a Bioconductor package for simulating scRNA-seq data that is designed to address these issues. Splatter provides a consistent, easy to use interface to several previously published simulations allowing researchers to estimate parameters, produce synthetic datasets and compare how well they replicate real data. Splatter also includes Splat, our own simulation model. Based on a gamma-Poisson hierarchical model, Splat includes additional features often seen in scRNA-Seq data, such as dropout, and can be used to simulate complex experiments including multiple cell types, differentiation lineages and multiple batches. I will also briefly discuss an analysis of a complex kidney organoid dataset, showing how more cells and different levels of clustering help to reveal greater biological insight.
![Unique Molecular Identifiers UMIs 5’ 3’ AAAA (PCR){BC}[UMI]TTTT 5 4](https://files.speakerdeck.com/presentations/6aca214ea13e48d2b04e5658fa7c6ee8/slide_8.jpg)