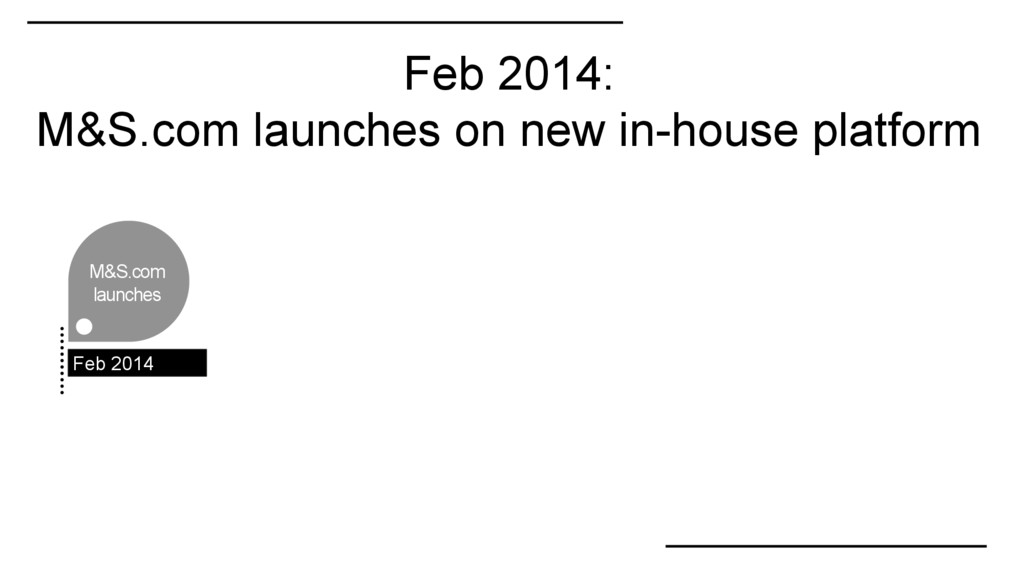
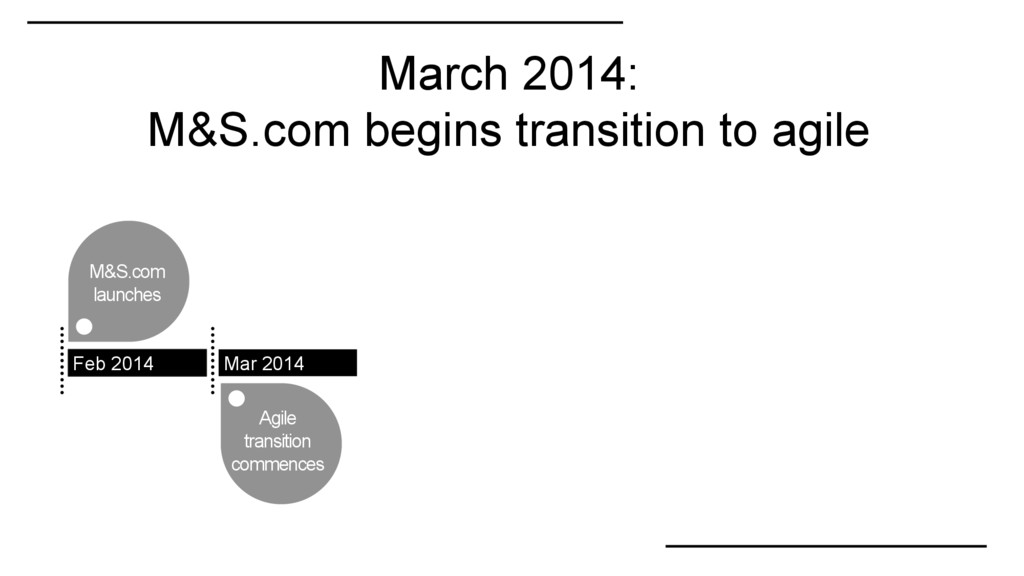
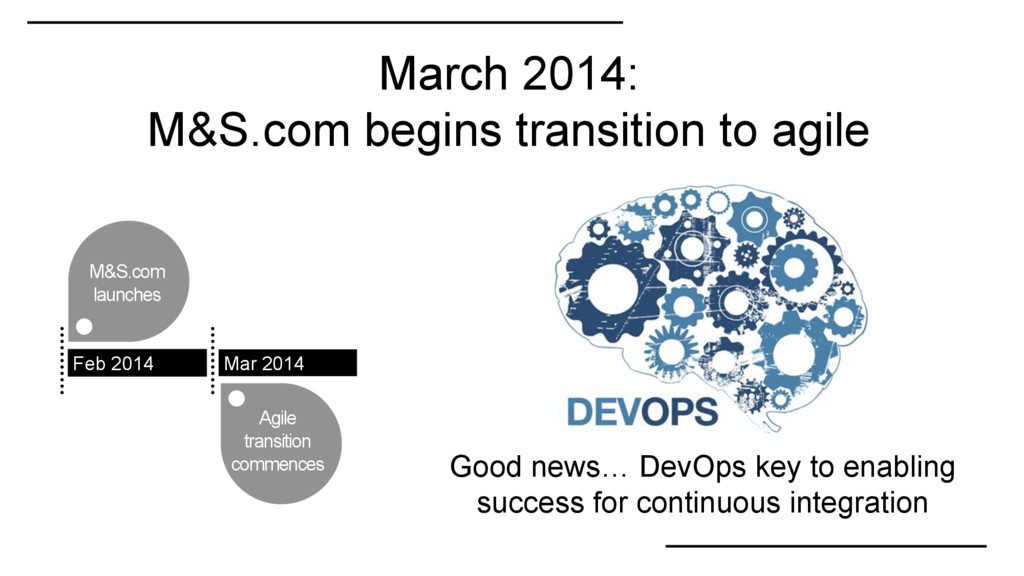
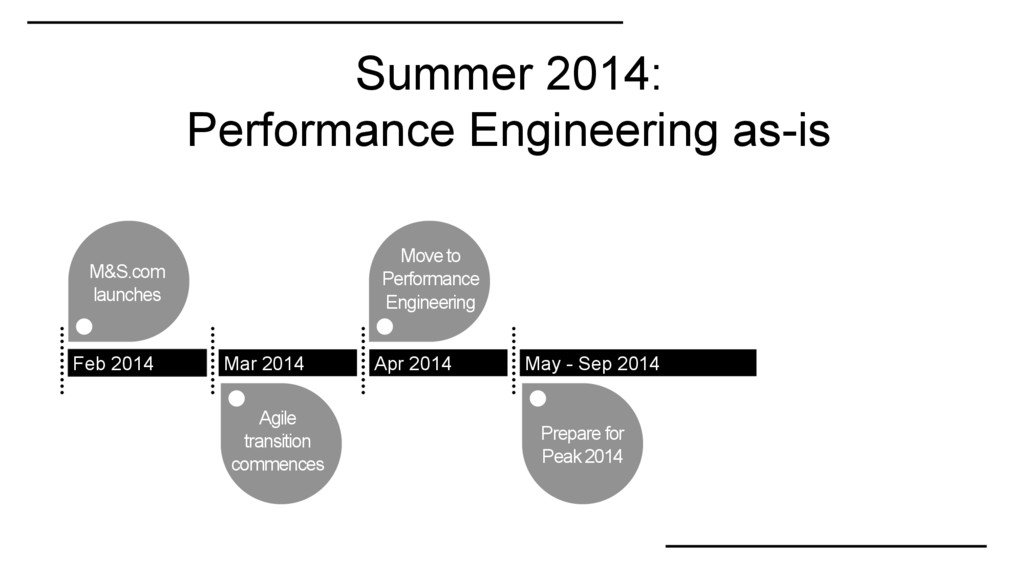
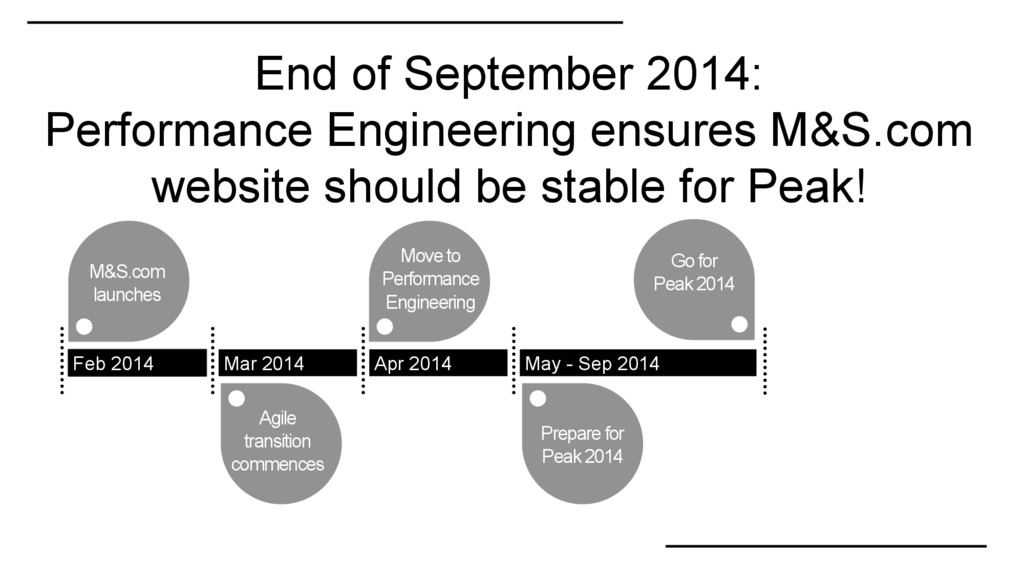
be stable for Peak! M&S.com launches Feb 2014 Mar 2014 Apr 2014 May - Sep 2014 Move to Performance Engineering Prepare for Peak 2014 Agile transition commences Go for Peak 2014
be stable for Peak! M&S.com launches Feb 2014 Mar 2014 Apr 2014 May - Sep 2014 Move to Performance Engineering Prepare for Peak 2014 Agile transition commences Go for Peak 2014 but…
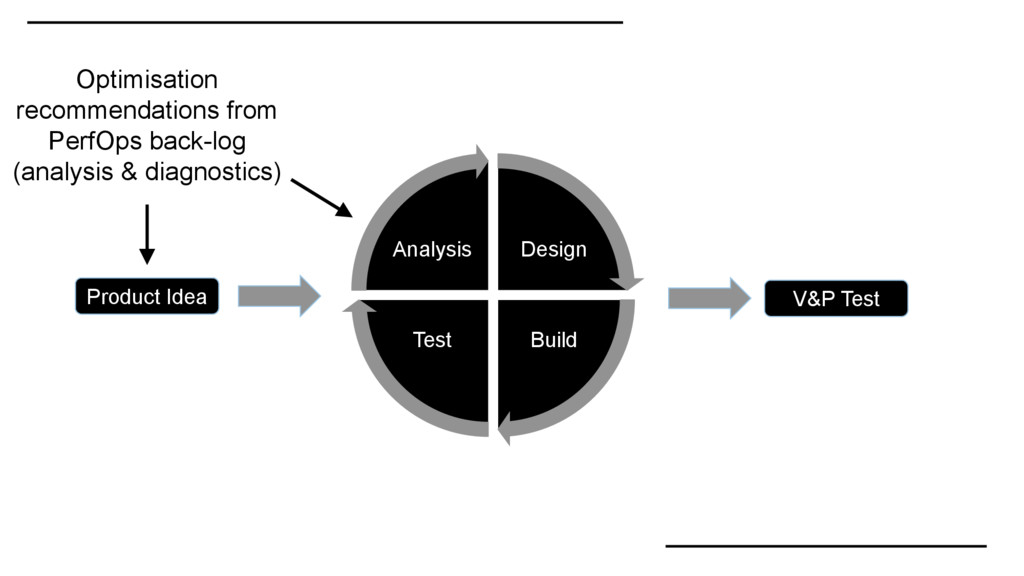
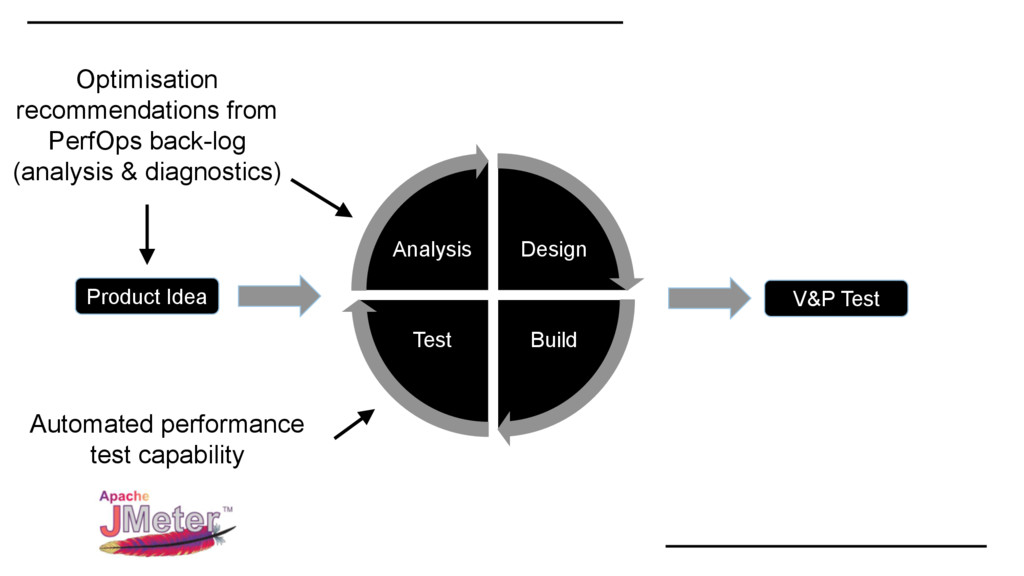
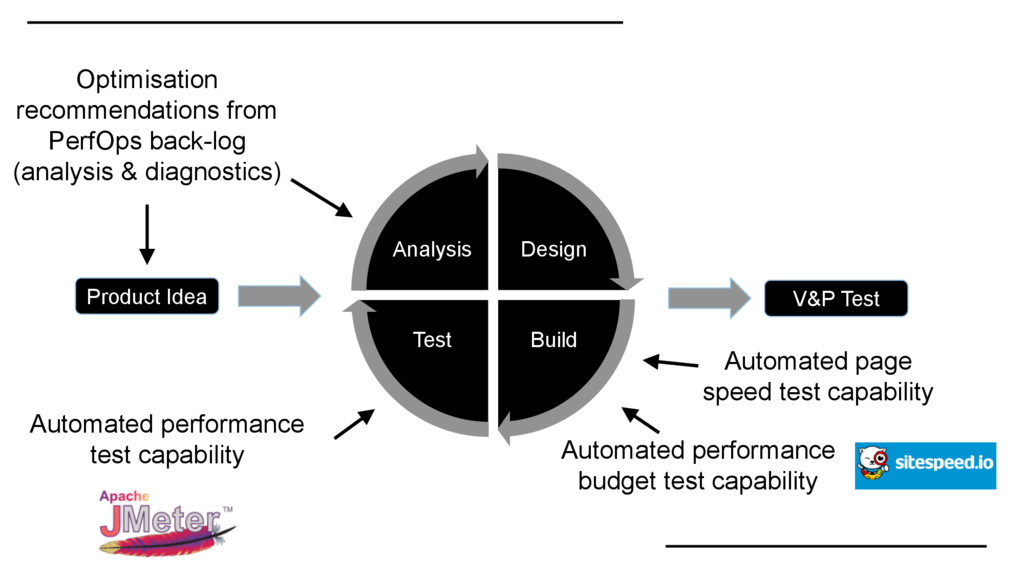
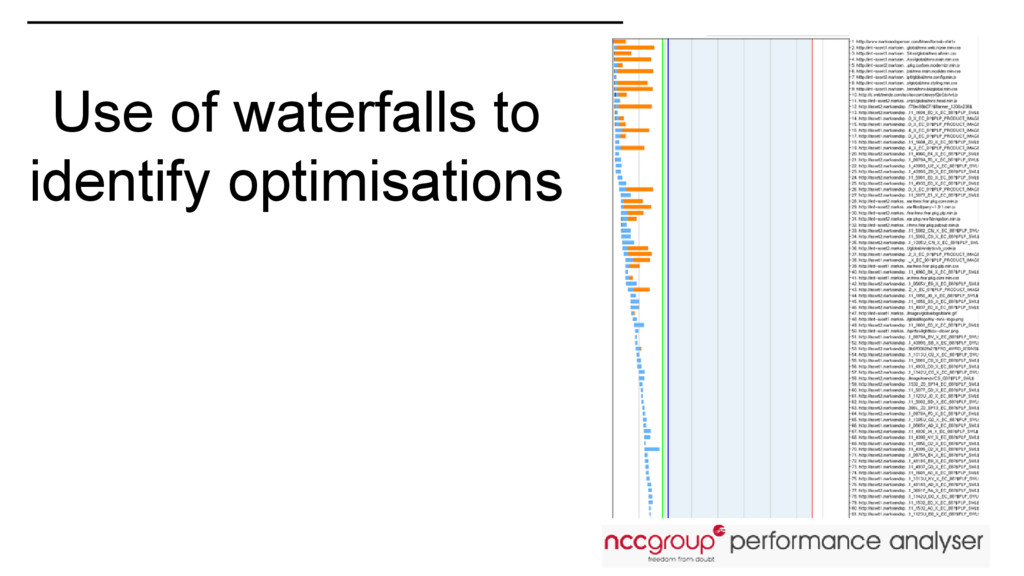
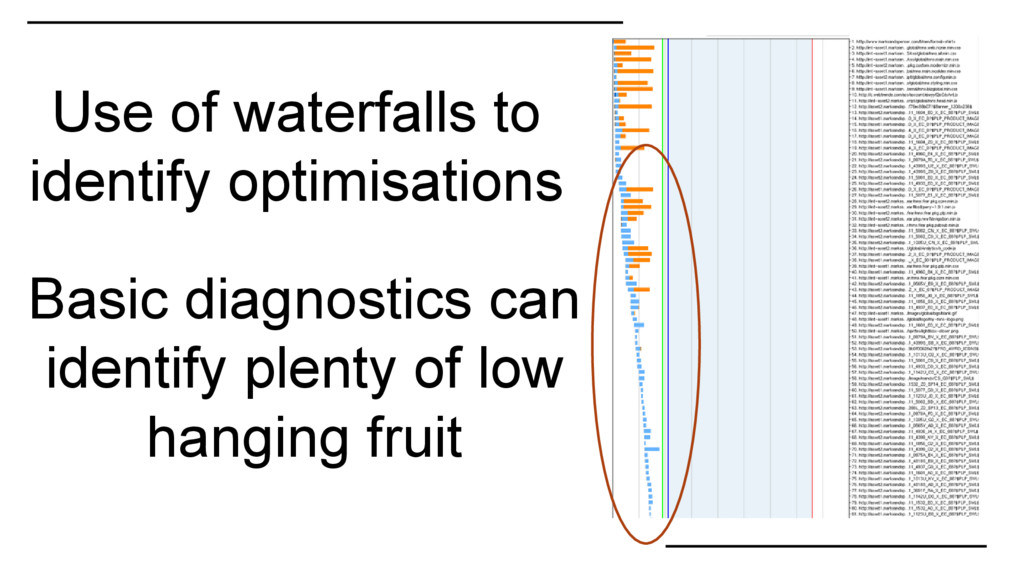
speed test capability Automated performance test capability Automated performance budget test capability Optimisation recommendations from PerfOps back-log (analysis & diagnostics)
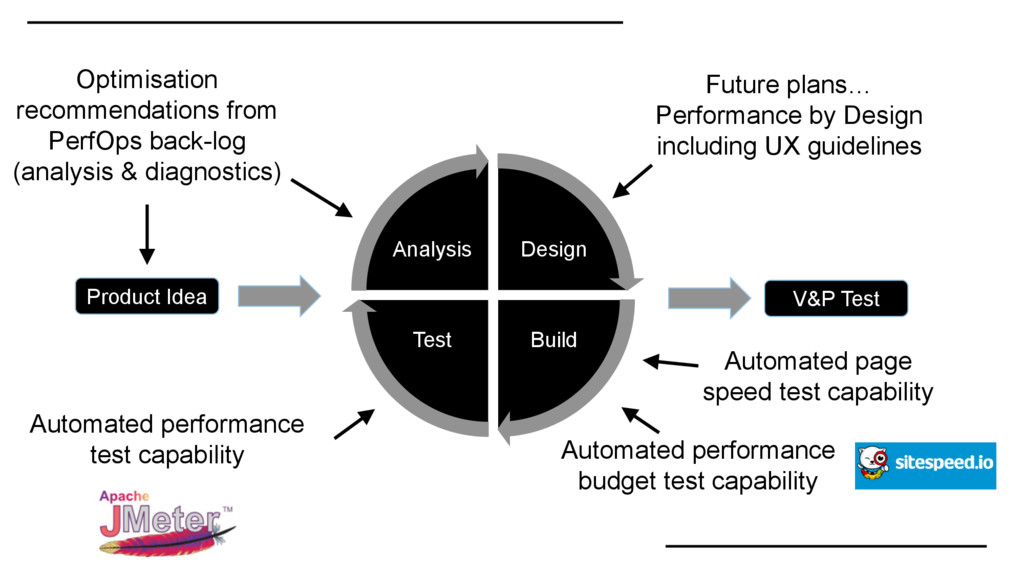
Performance by Design including UX guidelines Automated page speed test capability Automated performance test capability Automated performance budget test capability Optimisation recommendations from PerfOps back-log (analysis & diagnostics)
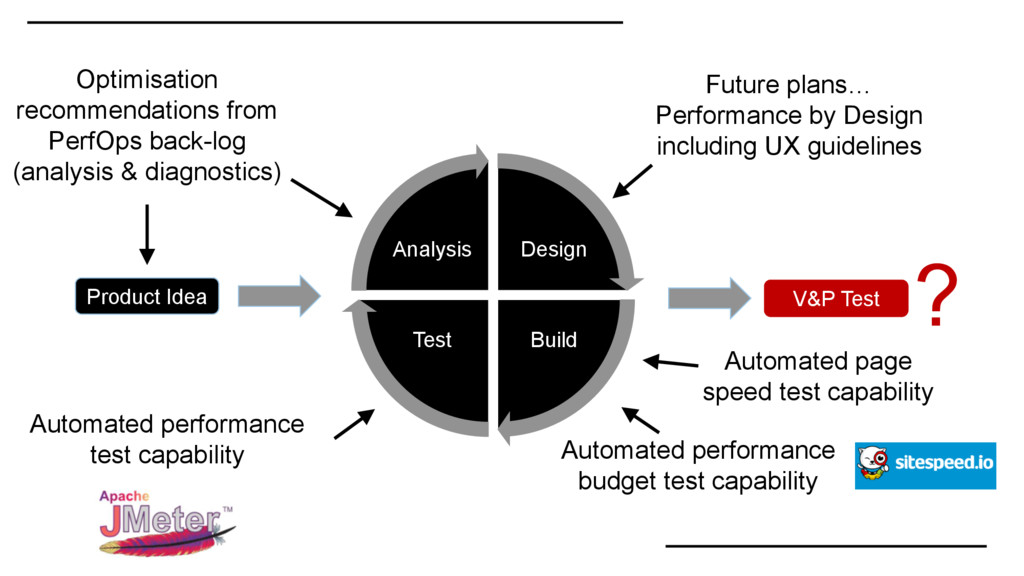
speed test capability Automated performance test capability Automated performance budget test capability ? Future plans… Performance by Design including UX guidelines Optimisation recommendations from PerfOps back-log (analysis & diagnostics)
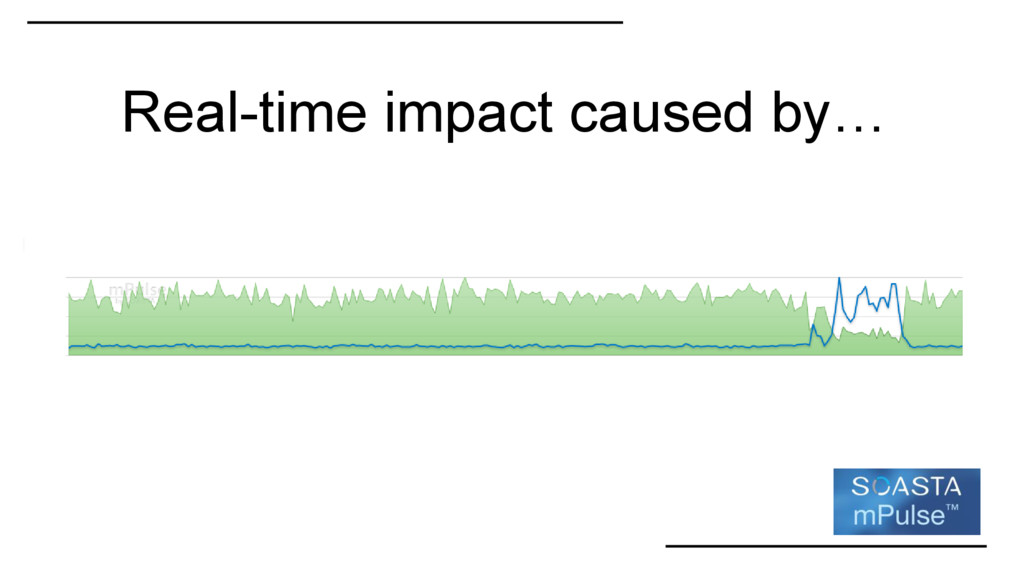
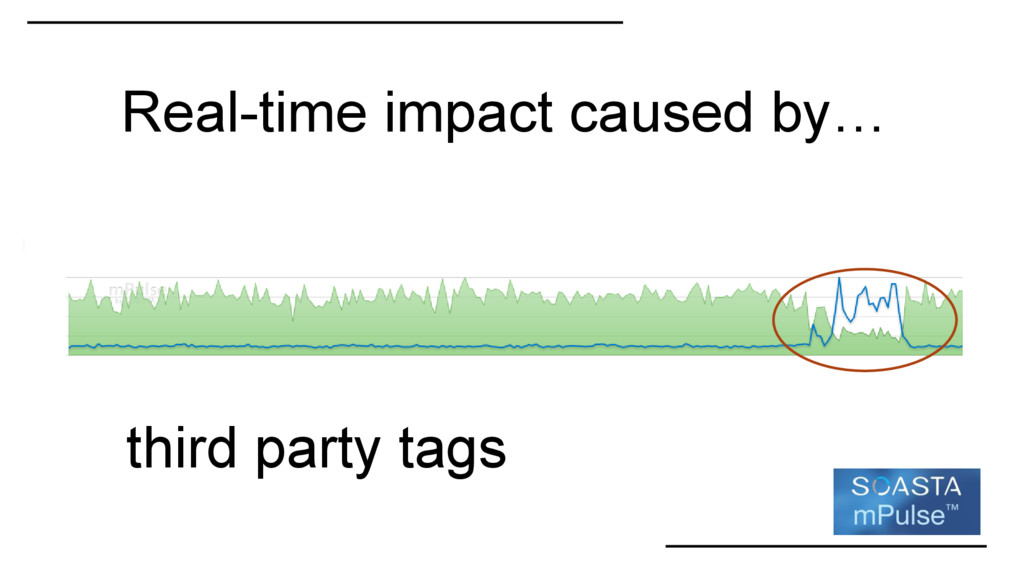
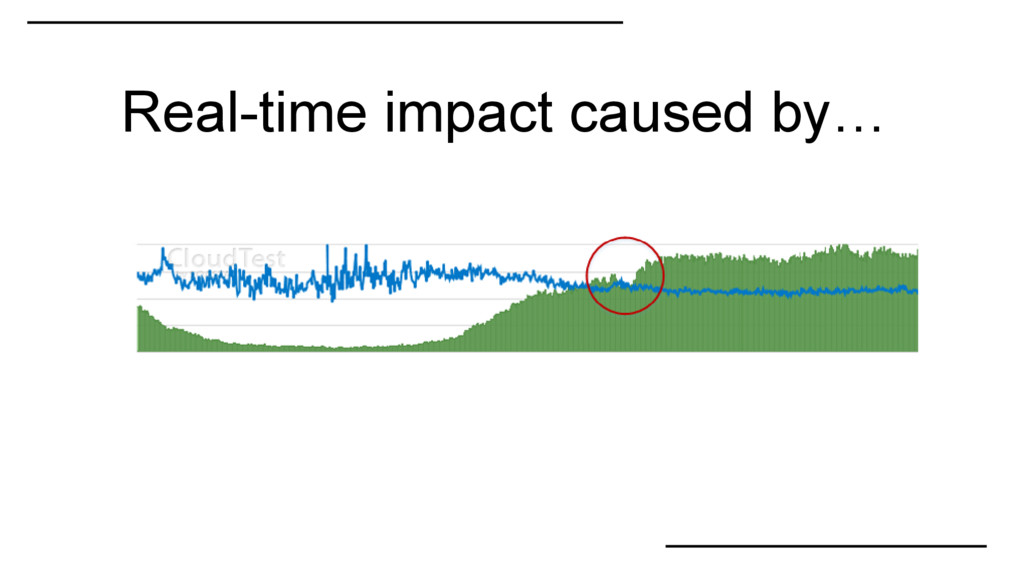
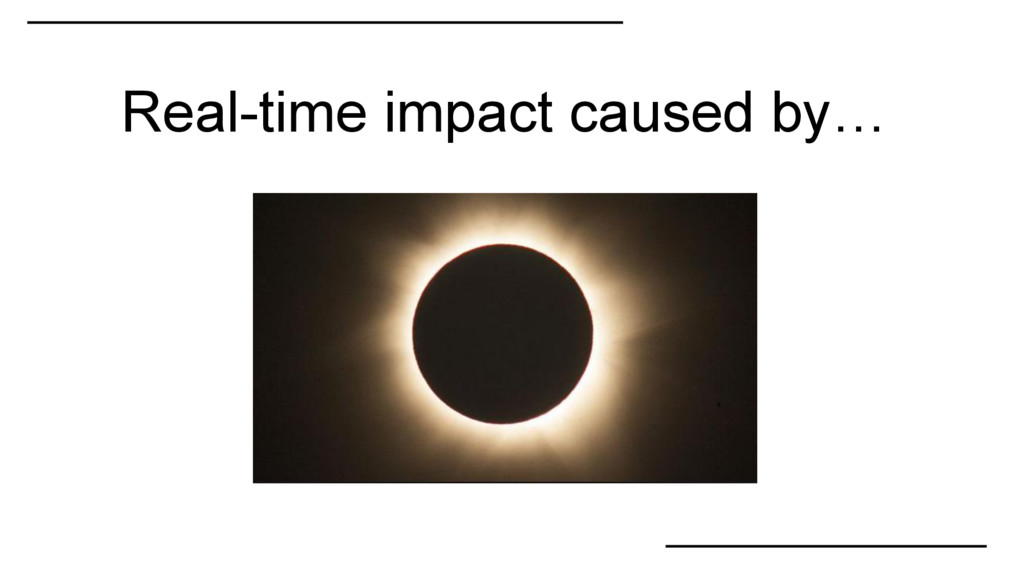
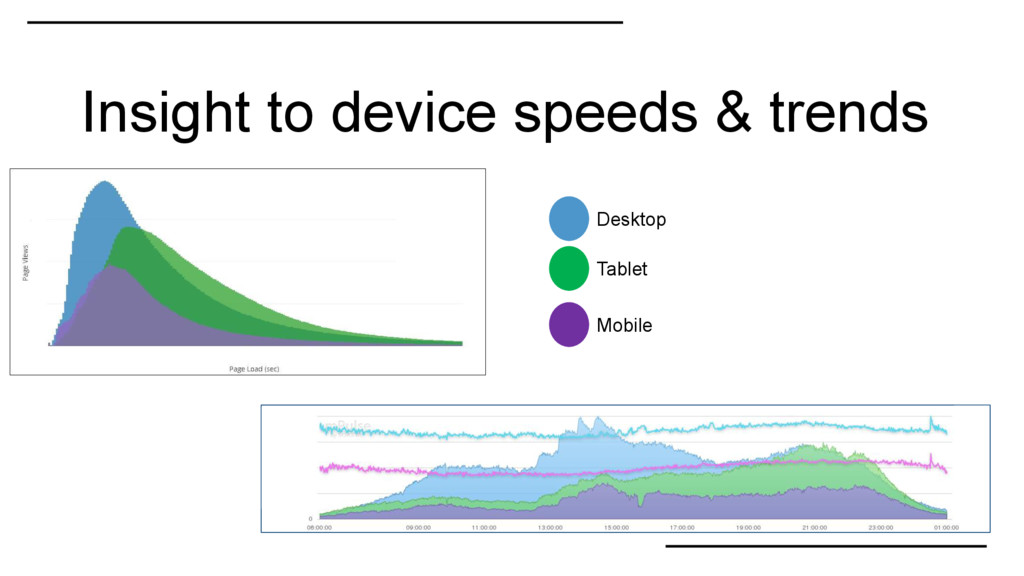
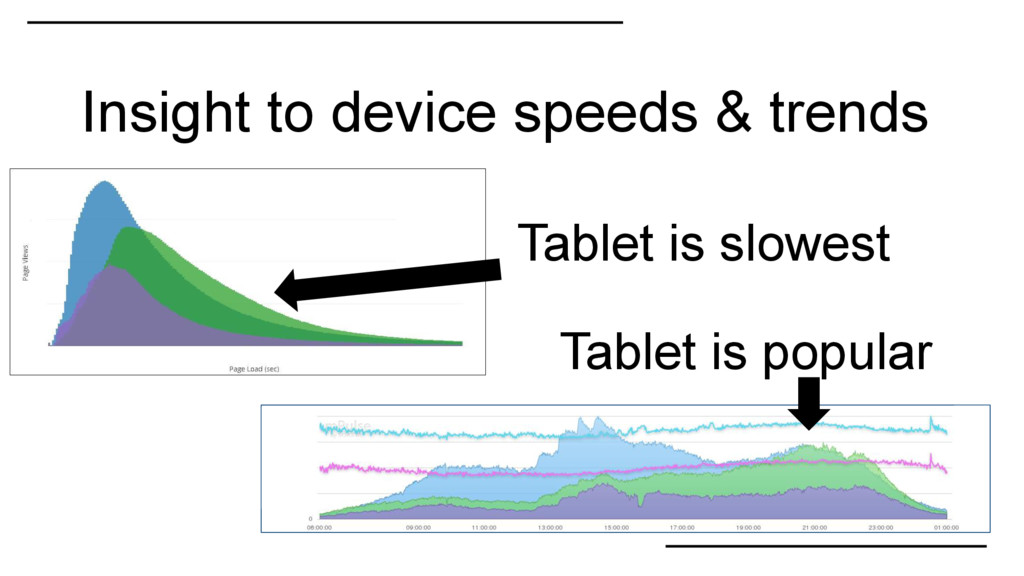
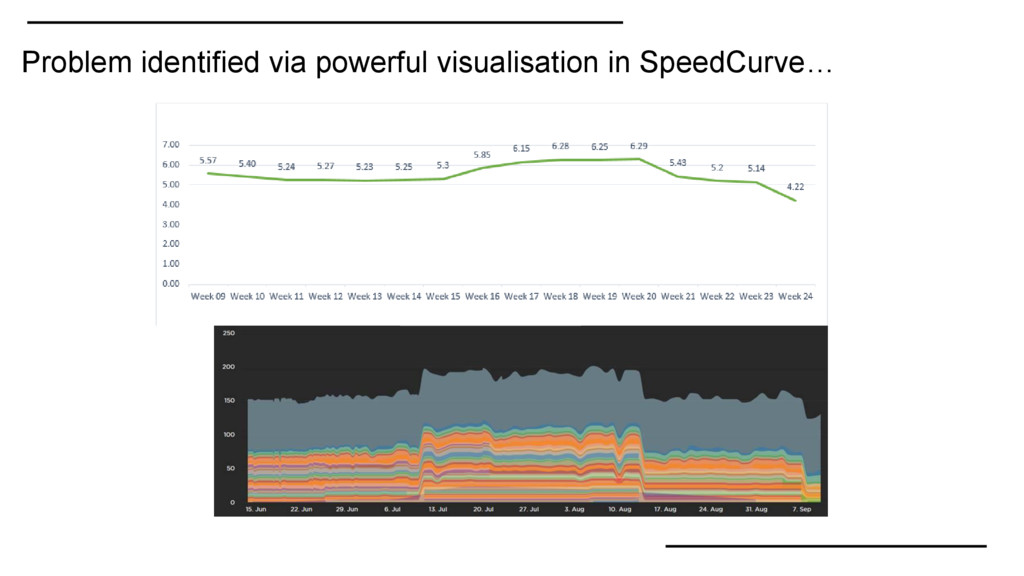
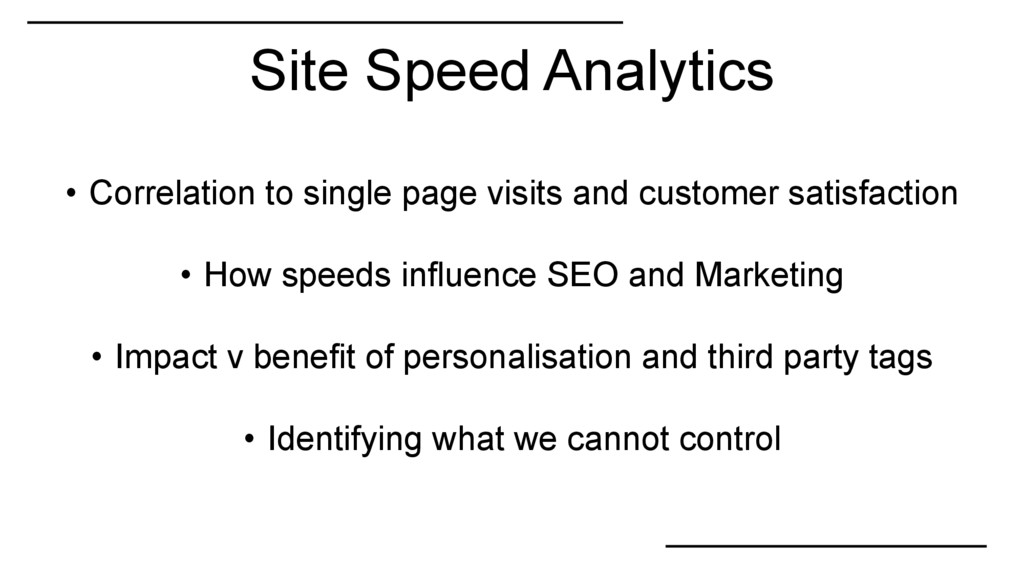
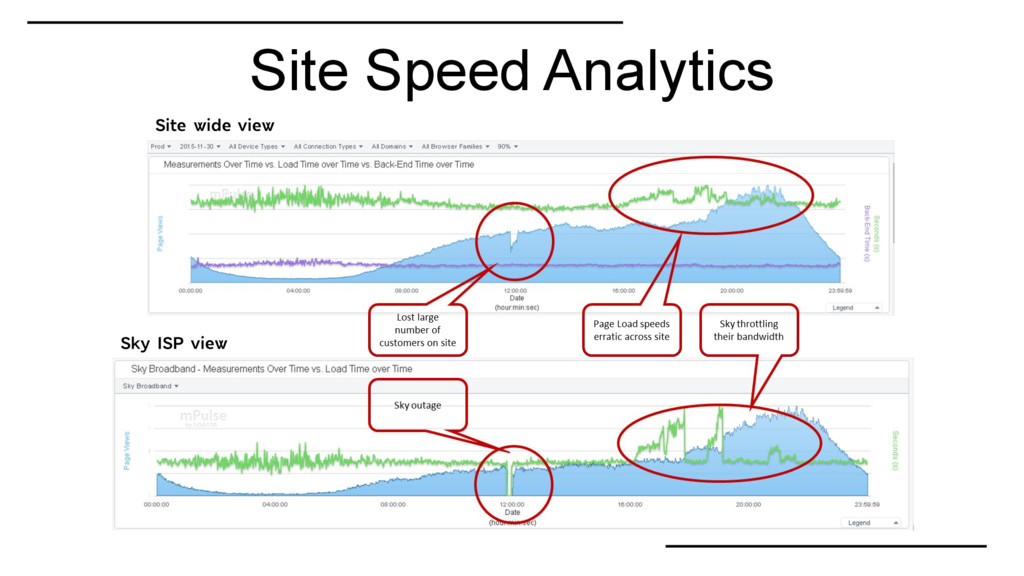
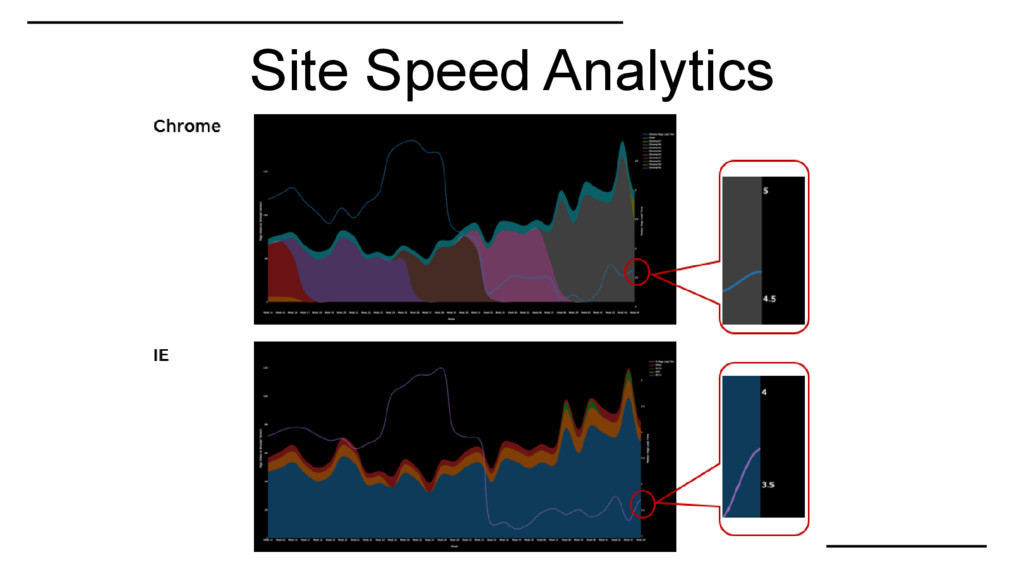
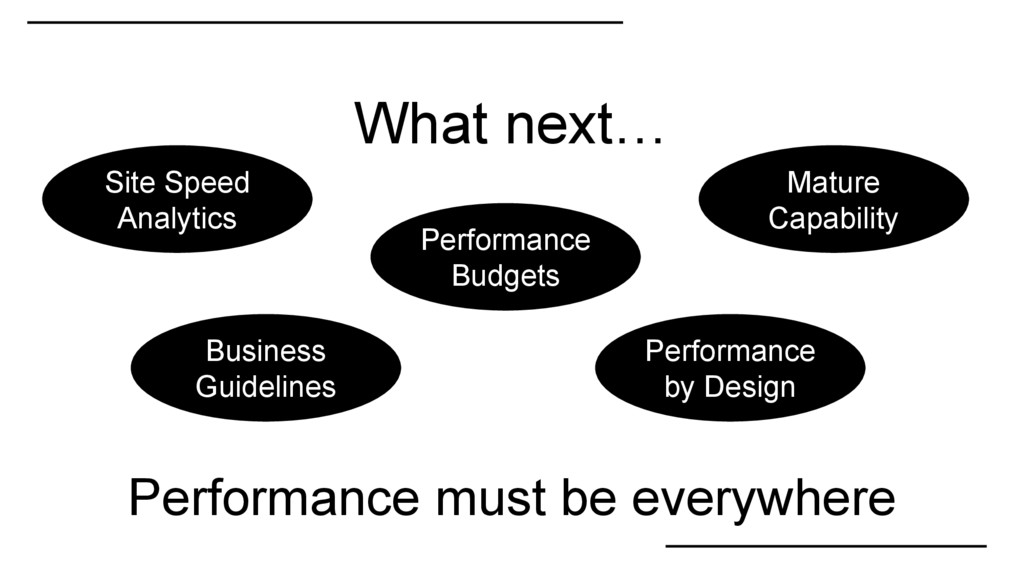
How speeds influence SEO and Marketing • Impact v benefit of personalisation and third party tags • Identifying what we cannot control Site Speed Analytics
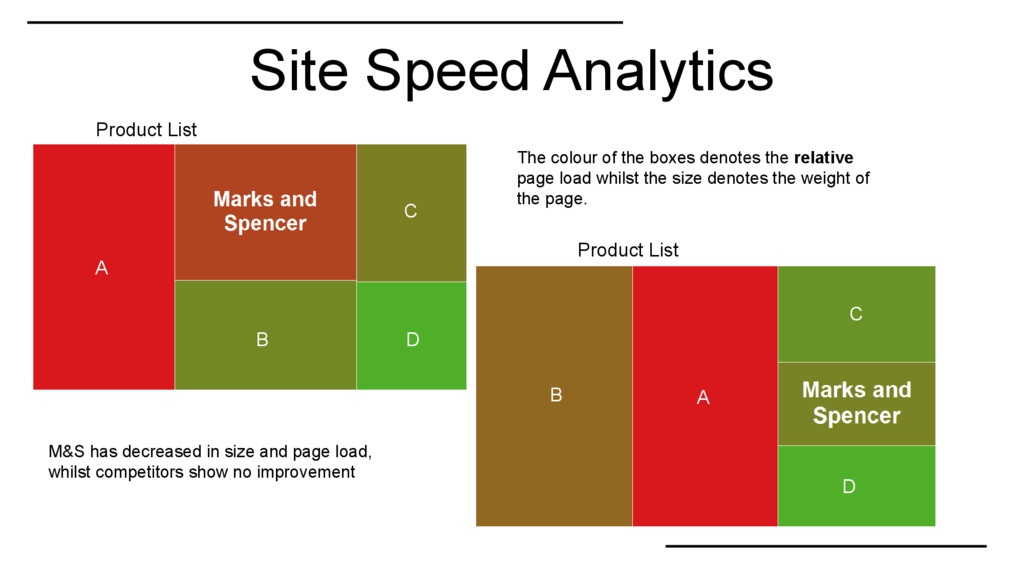
the boxes denotes the relative page load whilst the size denotes the weight of the page. M&S has decreased in size and page load, whilst competitors show no improvement A B C D D C A B
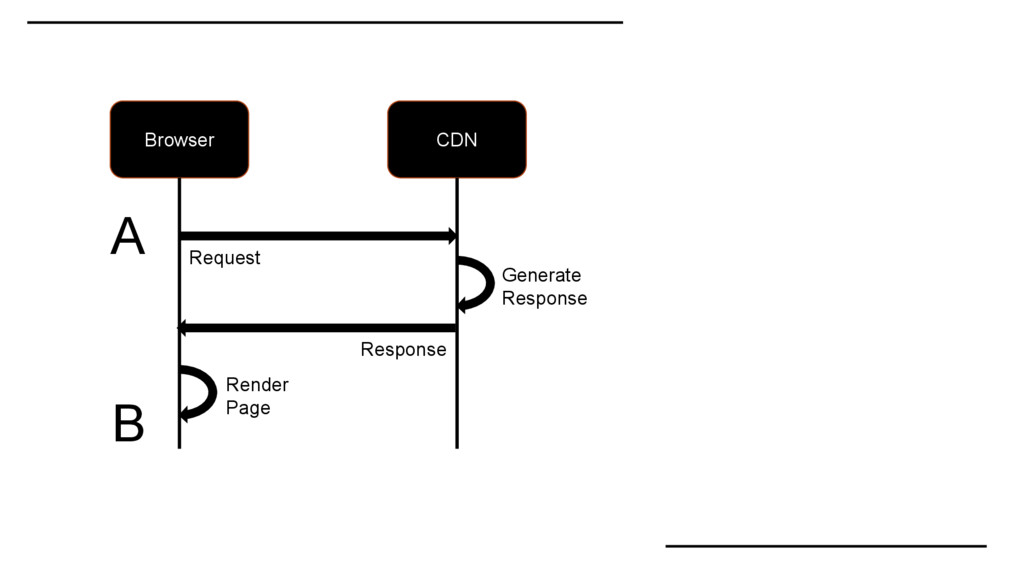
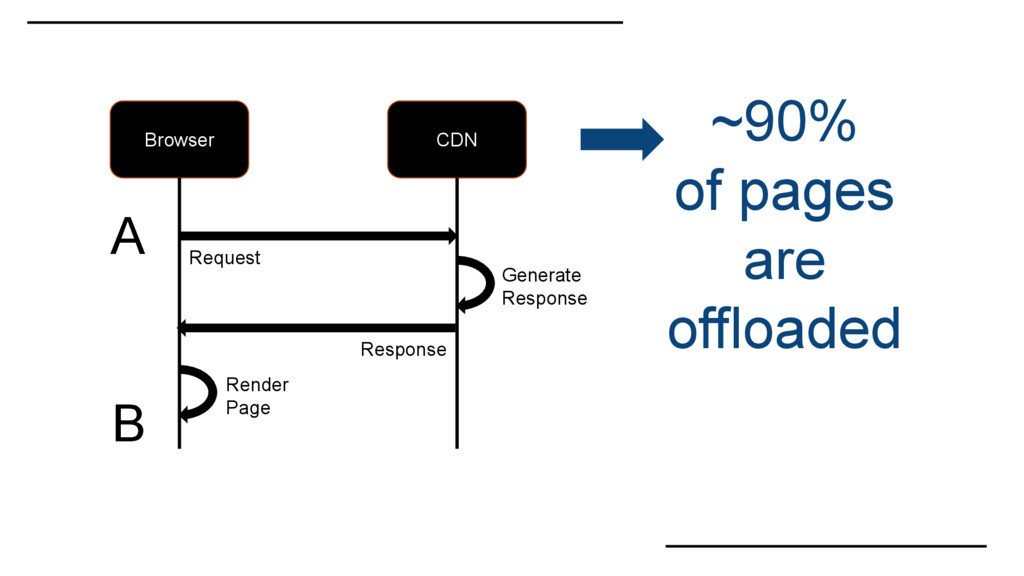
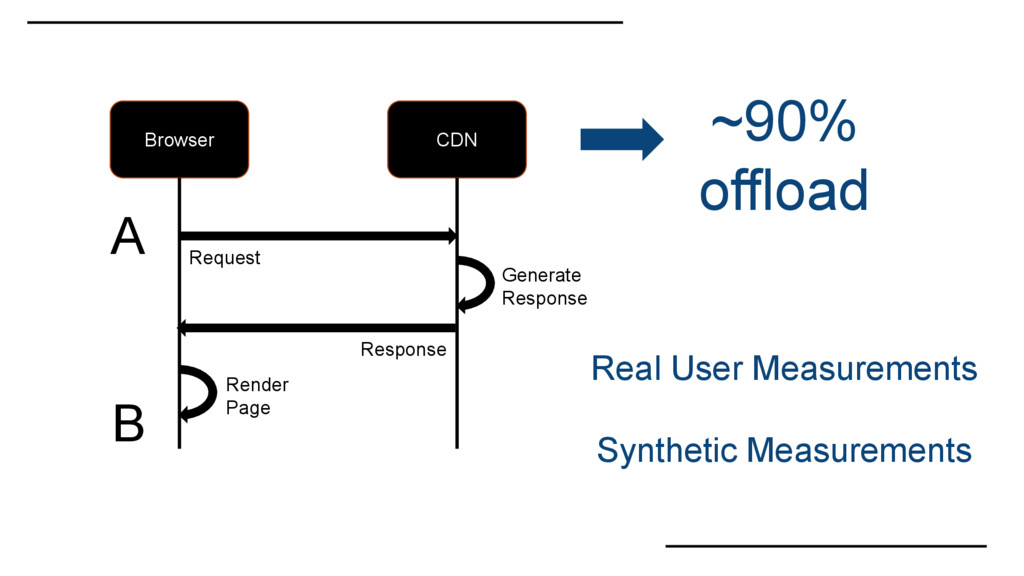
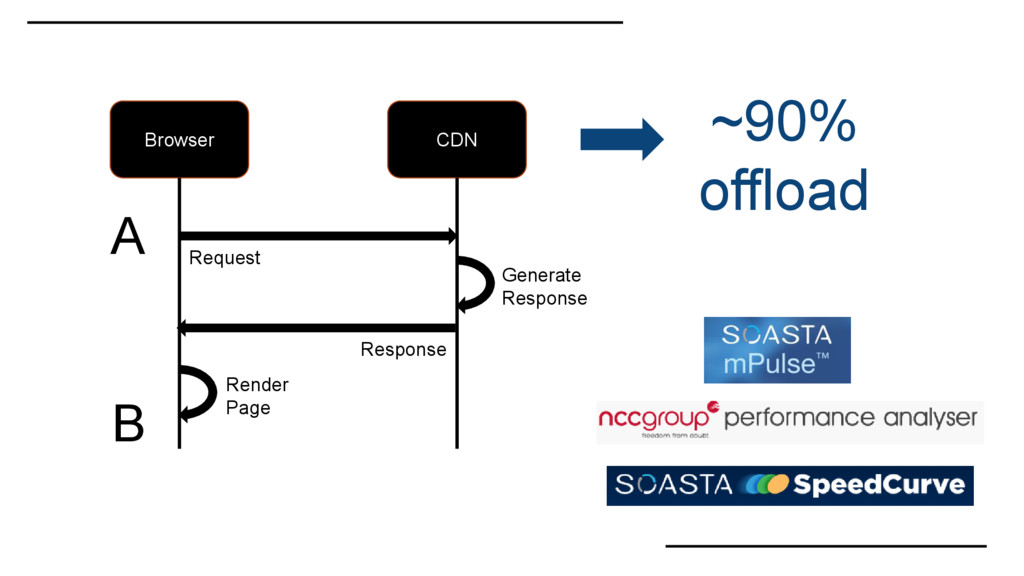
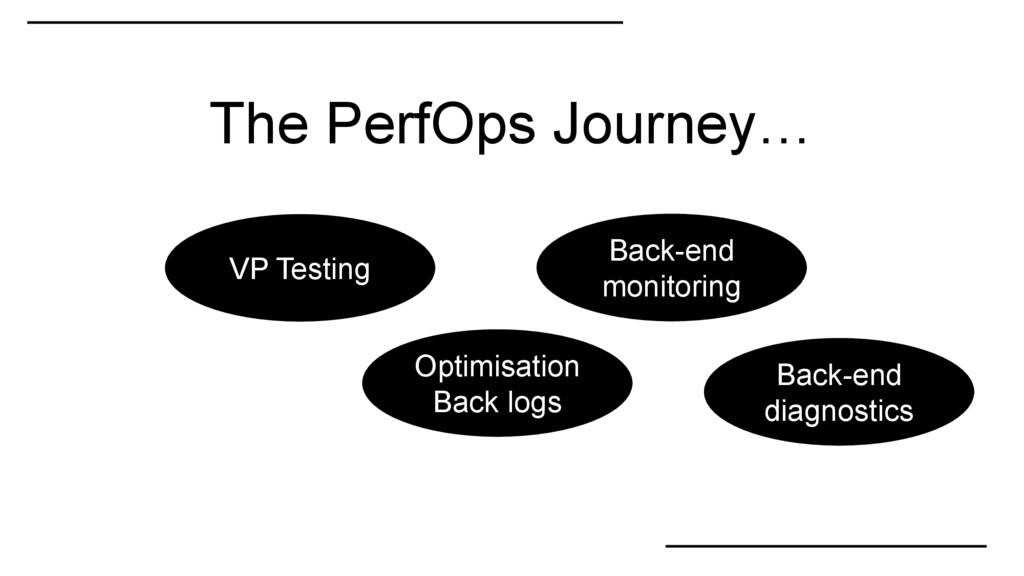
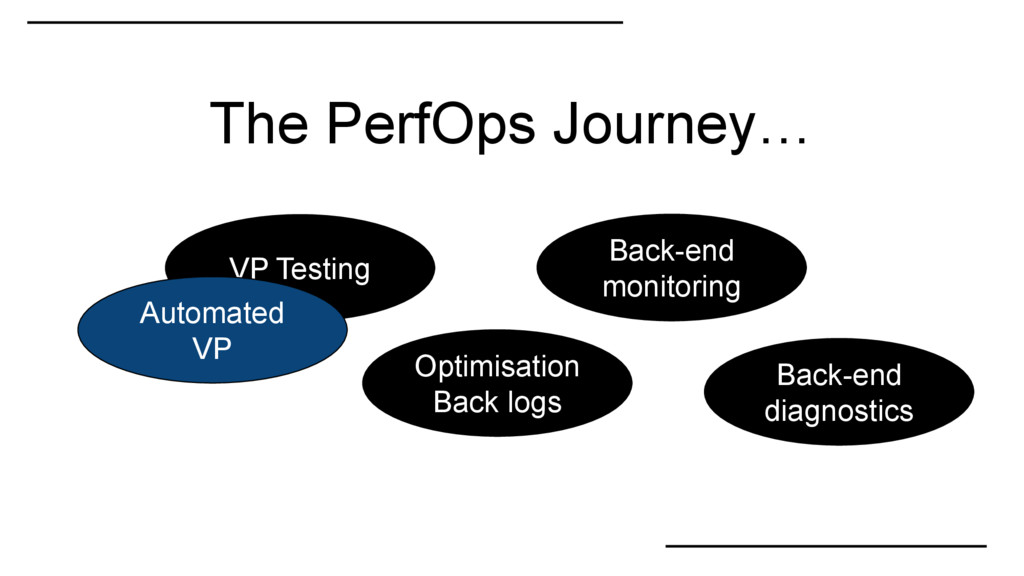
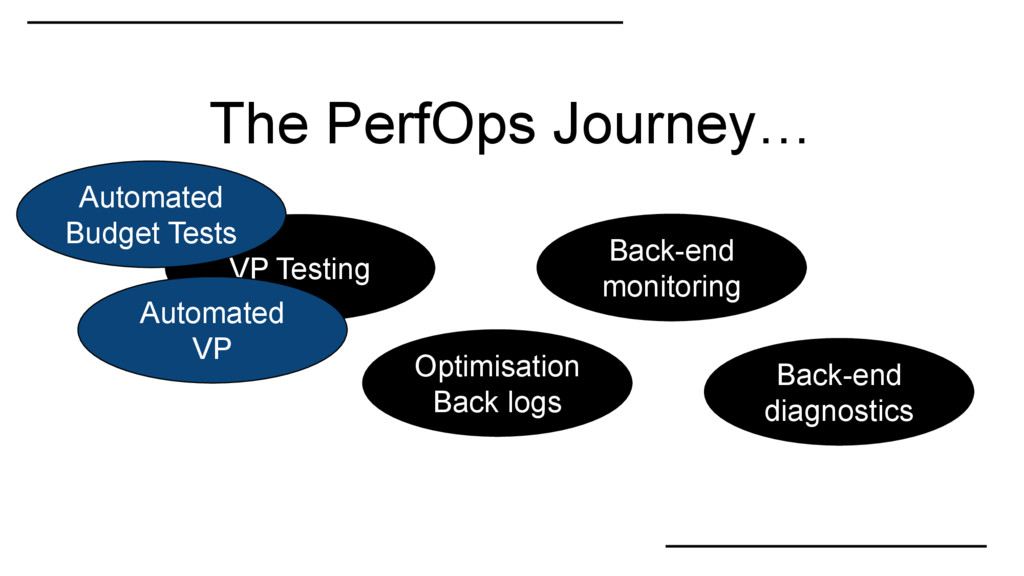
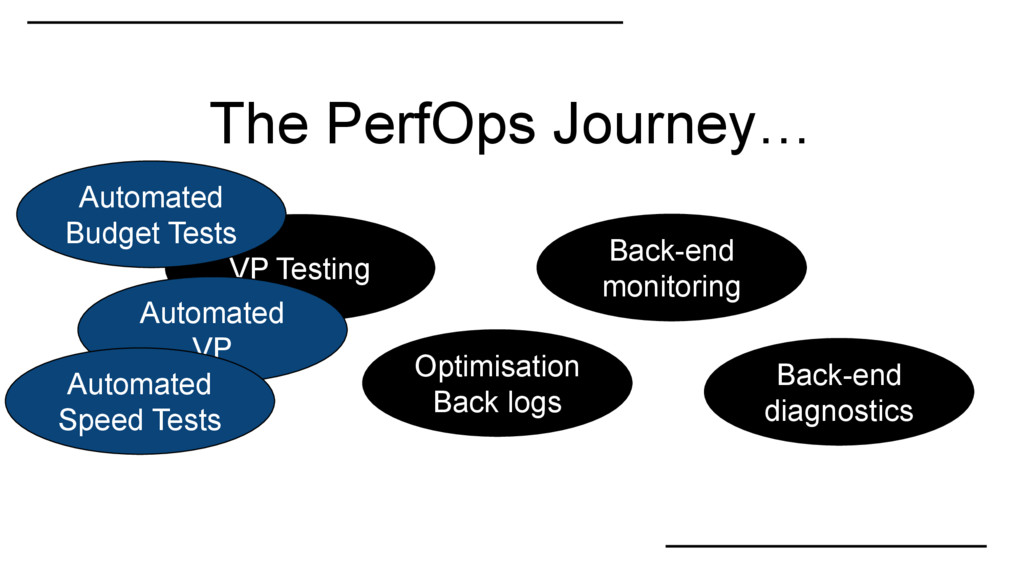
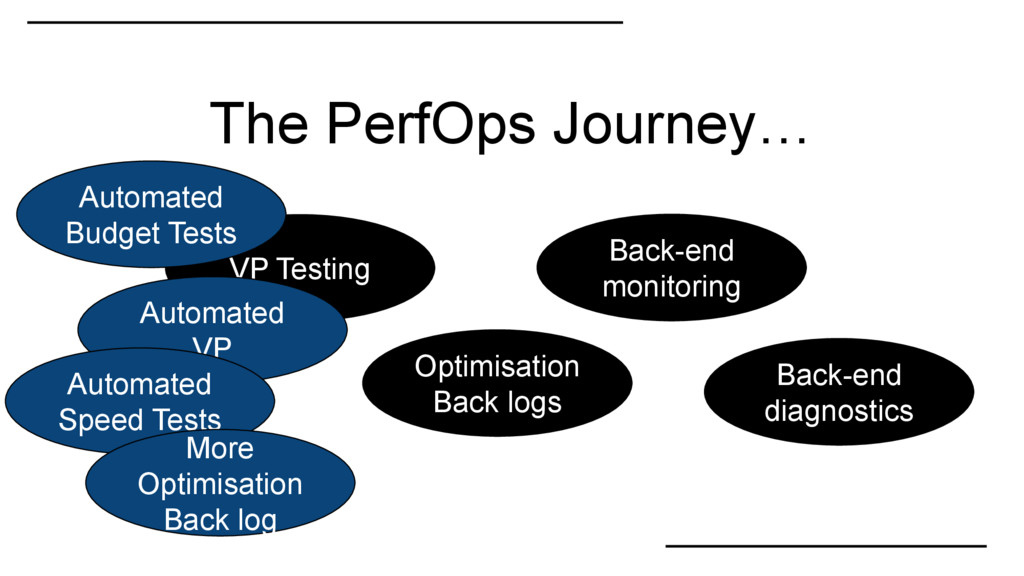
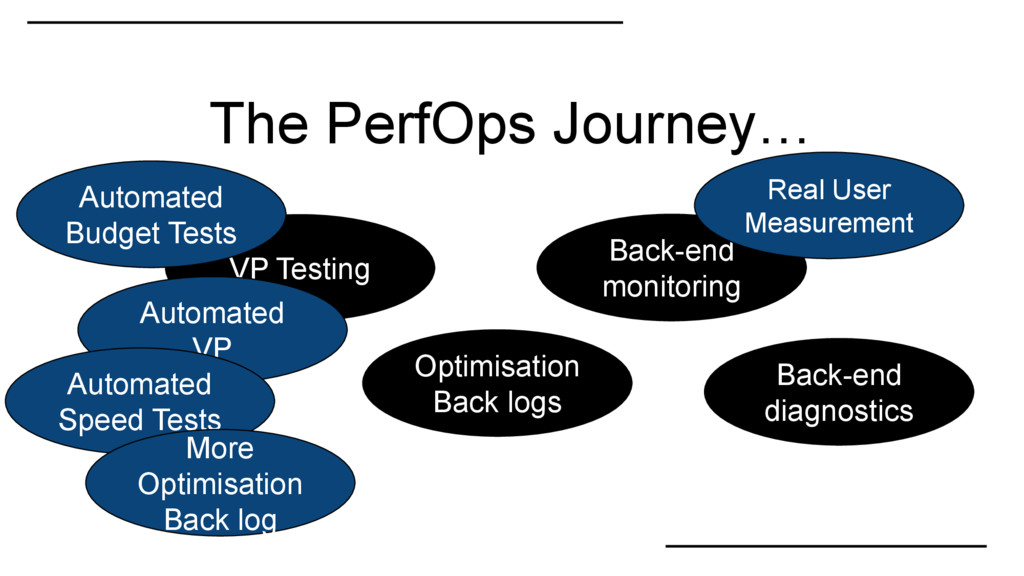
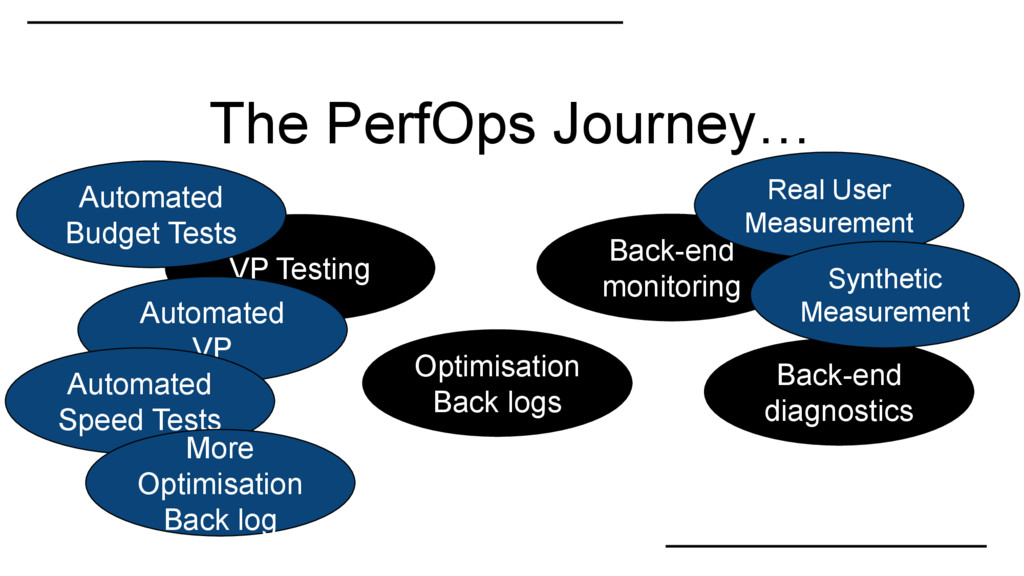
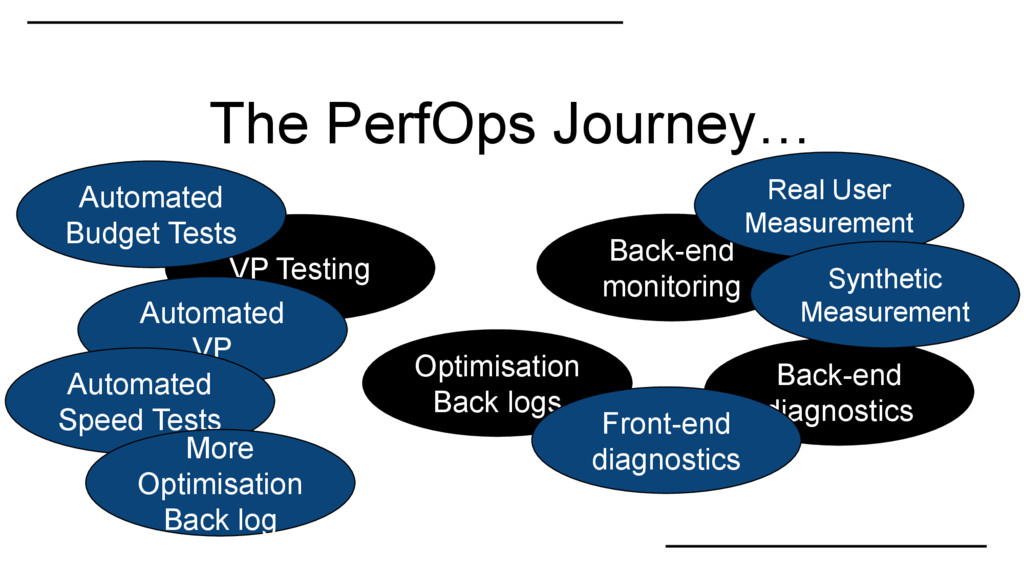
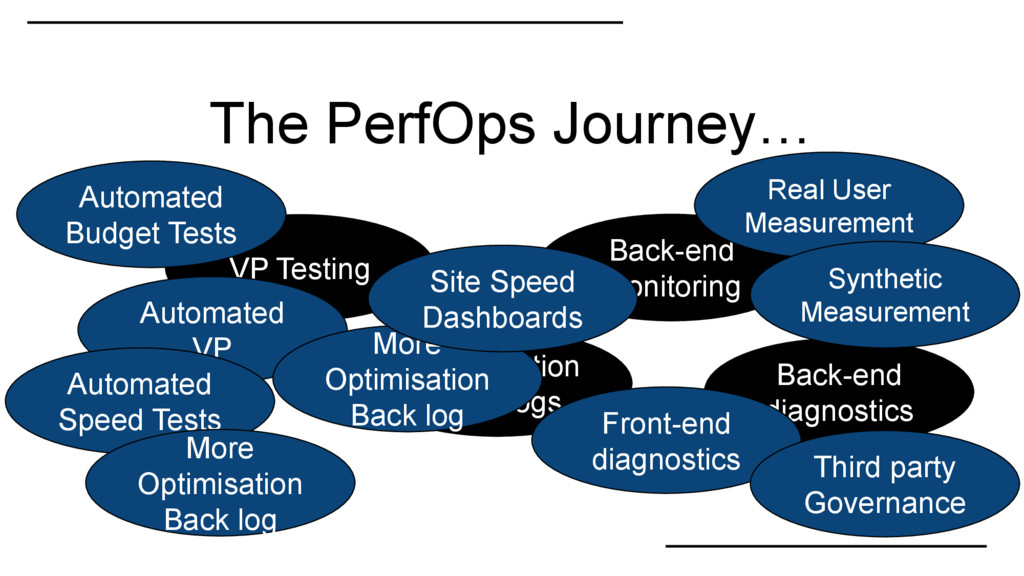
VP Automated Speed Tests Automated Budget Tests More Optimisation Back log Real User Measurement Synthetic Measurement Front-end diagnostics The PerfOps Journey…
VP Automated Speed Tests Automated Budget Tests More Optimisation Back log Real User Measurement Synthetic Measurement Front-end diagnostics More Optimisation Back log The PerfOps Journey…
VP Automated Speed Tests Automated Budget Tests More Optimisation Back log Real User Measurement Synthetic Measurement Front-end diagnostics More Optimisation Back log Site Speed Dashboards The PerfOps Journey…
VP Automated Speed Tests Automated Budget Tests More Optimisation Back log Real User Measurement Synthetic Measurement Front-end diagnostics More Optimisation Back log Site Speed Dashboards Third party Governance The PerfOps Journey…
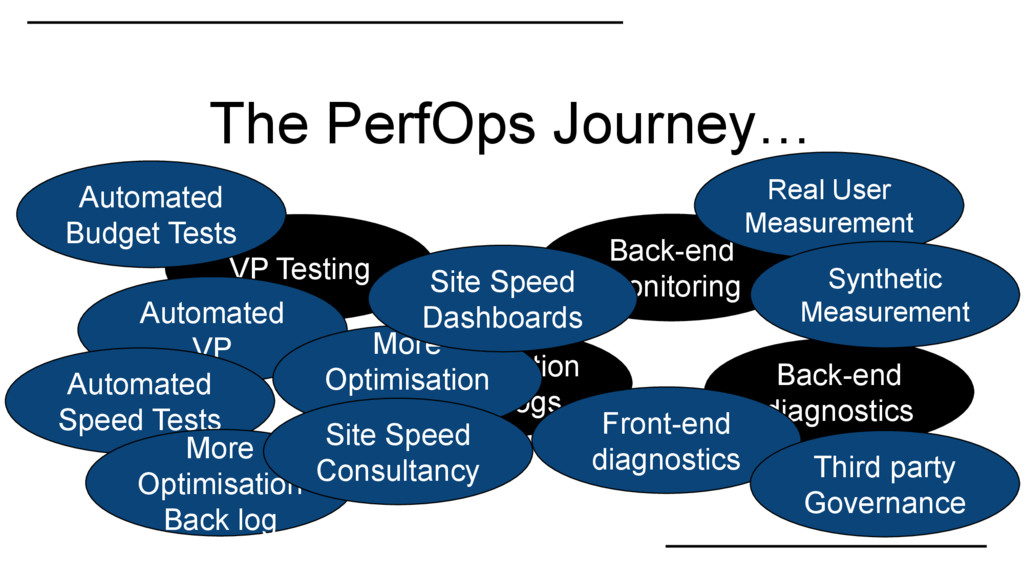
VP Automated Speed Tests Automated Budget Tests More Optimisation Back log Real User Measurement Synthetic Measurement Front-end diagnostics Third party Governance More Optimisation Back log Site Speed Dashboards Site Speed Consultancy The PerfOps Journey…
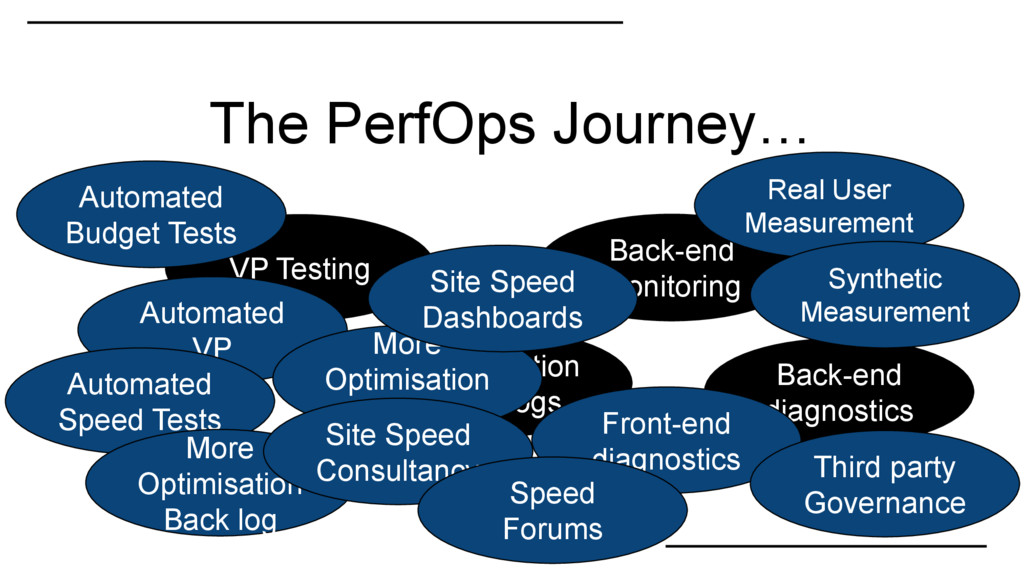
VP Automated Speed Tests Automated Budget Tests More Optimisation Back log Real User Measurement Synthetic Measurement Front-end diagnostics Third party Governance More Optimisation Back log Site Speed Dashboards Site Speed Consultancy Speed Forums The PerfOps Journey…
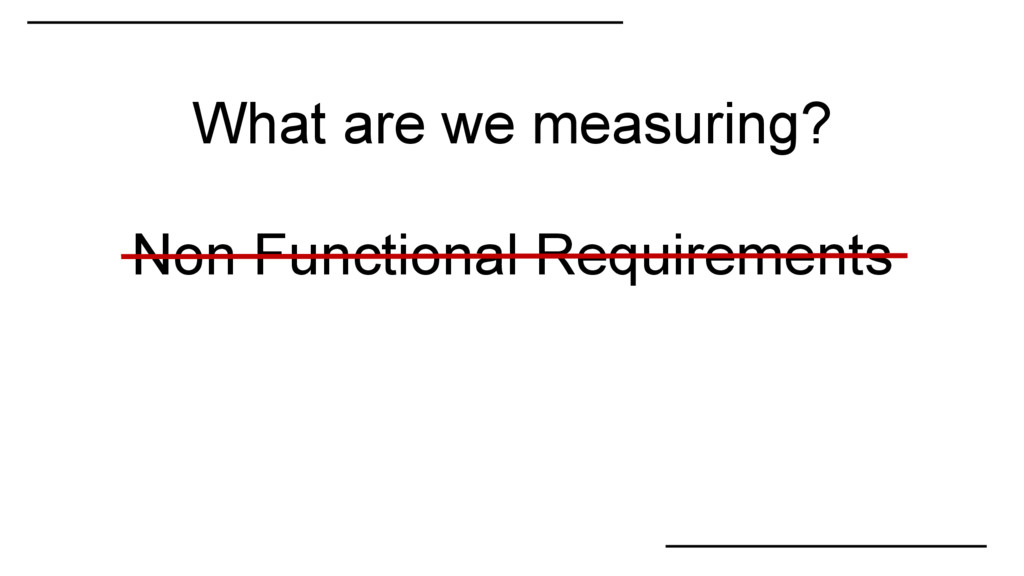
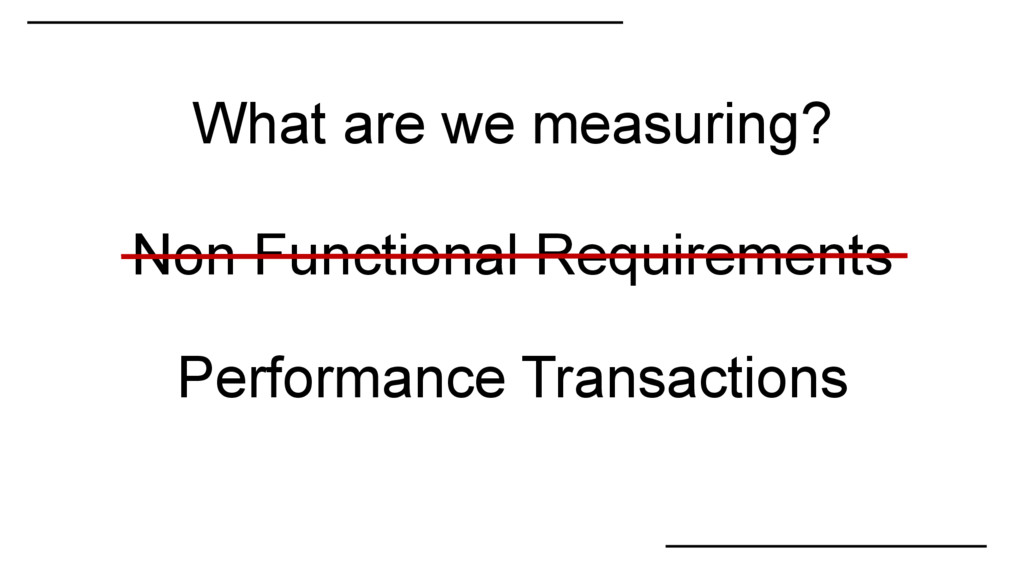
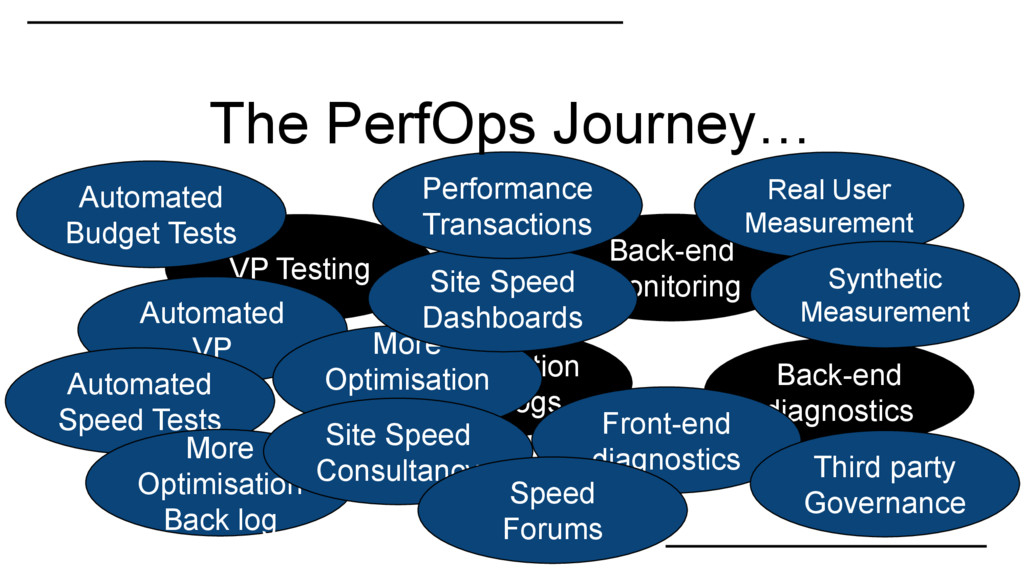
VP Automated Speed Tests Automated Budget Tests More Optimisation Back log Real User Measurement Synthetic Measurement Front-end diagnostics Third party Governance More Optimisation Back log Site Speed Dashboards Site Speed Consultancy Performance Transactions Speed Forums The PerfOps Journey…