Upgrade to Pro — share decks privately, control downloads, hide ads and more …

LDNWebPerf February 2018 - Joel Webber

LDNWebPerf February 2018 - Joel Webber

Beyond Load Times: Performance Analysis for Modern Web Apps
A session presented by Joel Webber

On Tuesday, 6th February 2018

Skill level: Intermediate

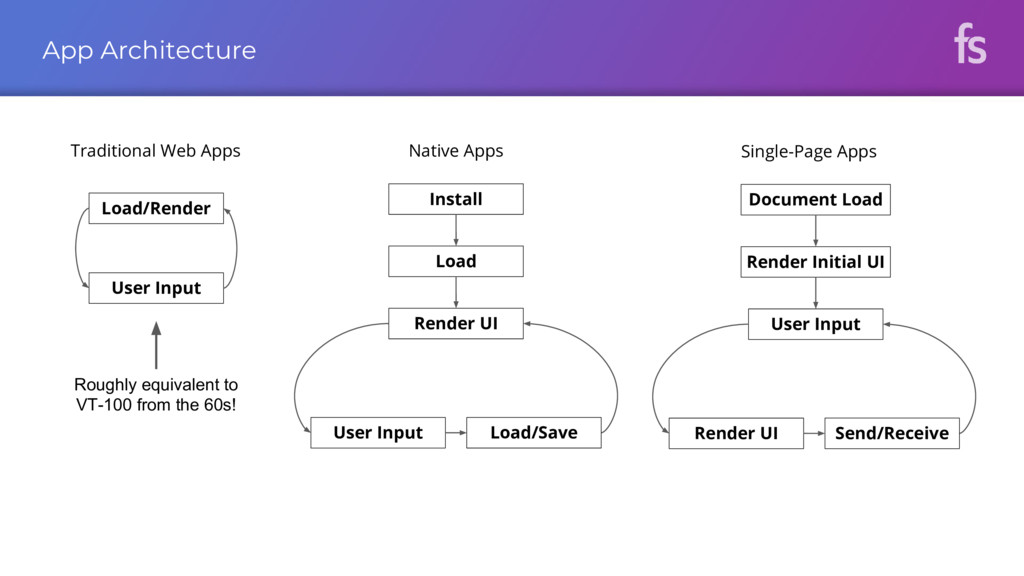
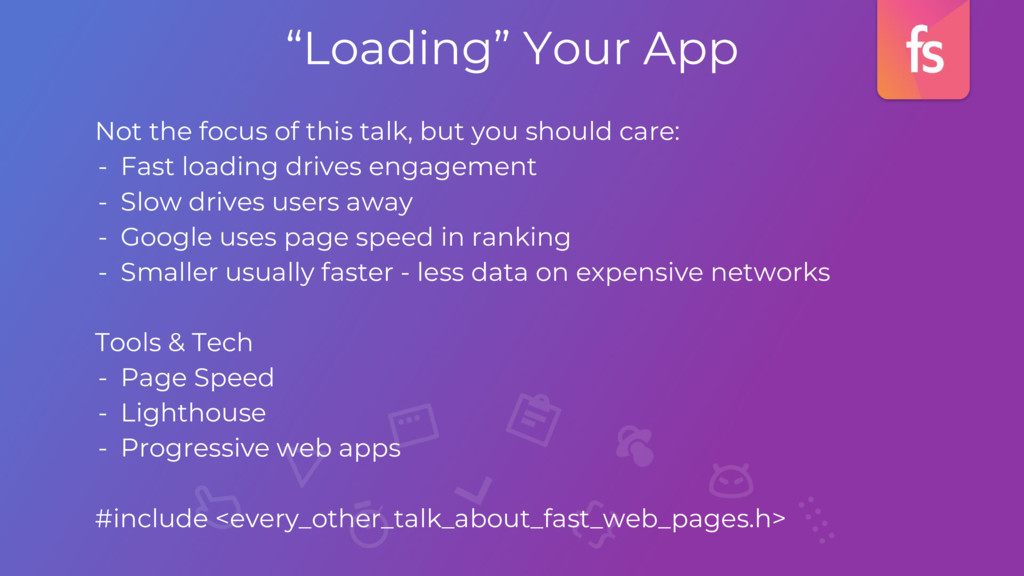
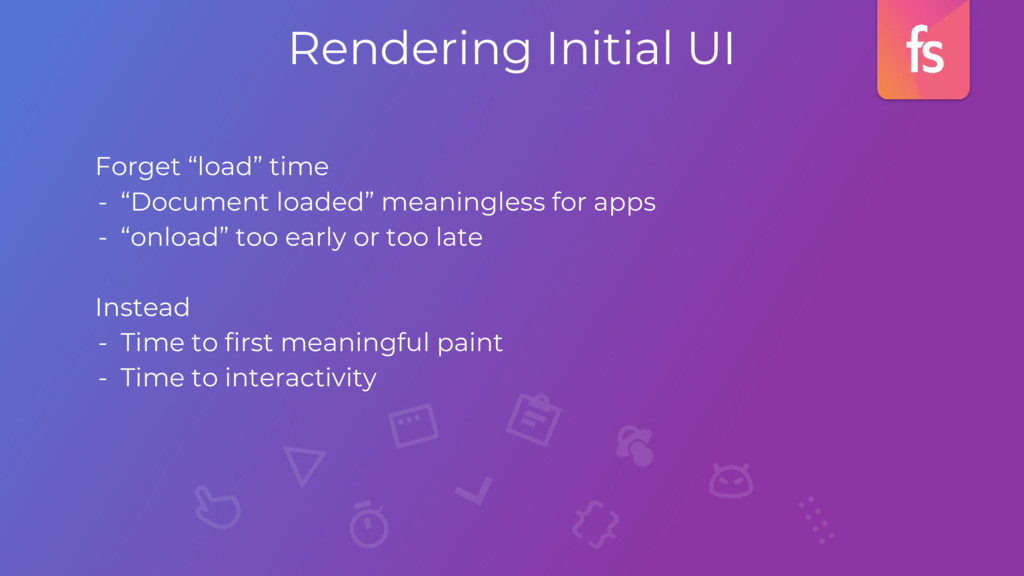
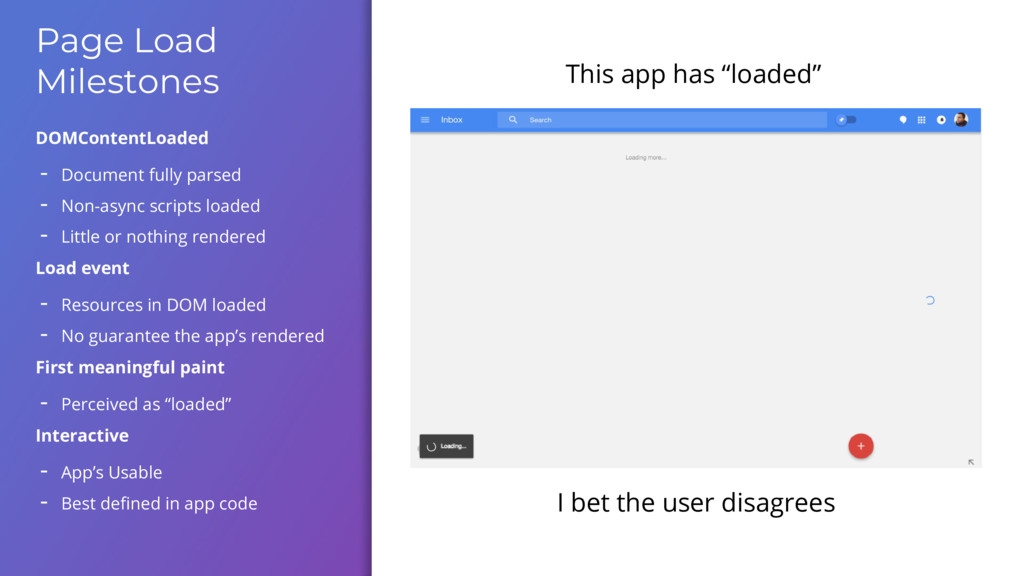
Traditional web performance analysis often focuses on loading metrics -- time to first render, interactivity, onload, etc. This is important as far as it goes but increasingly limited as web "pages" become "apps" in their own right. While loading metrics remain important, it's becoming crucial to understand what's happening after the page is rendered.
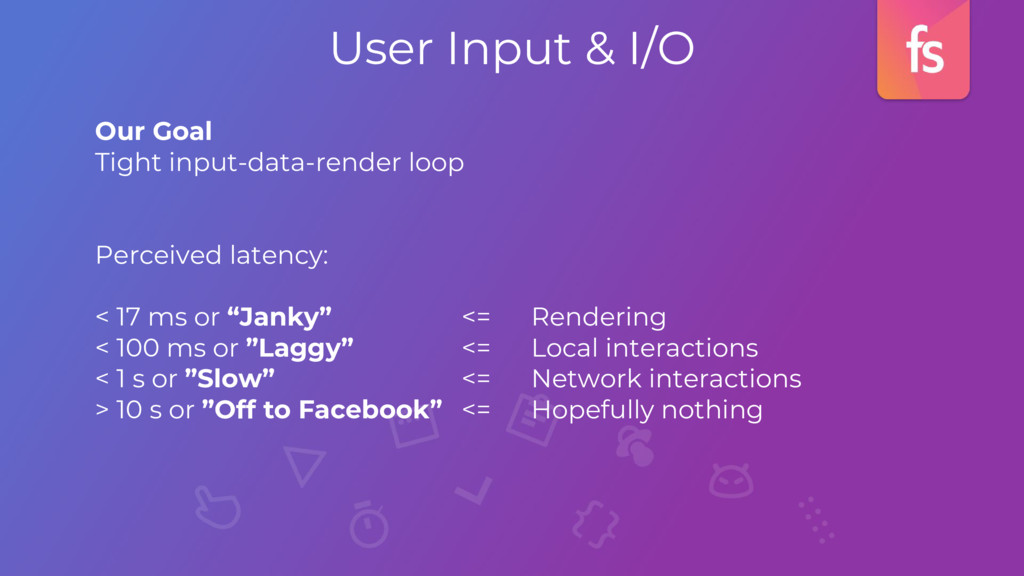
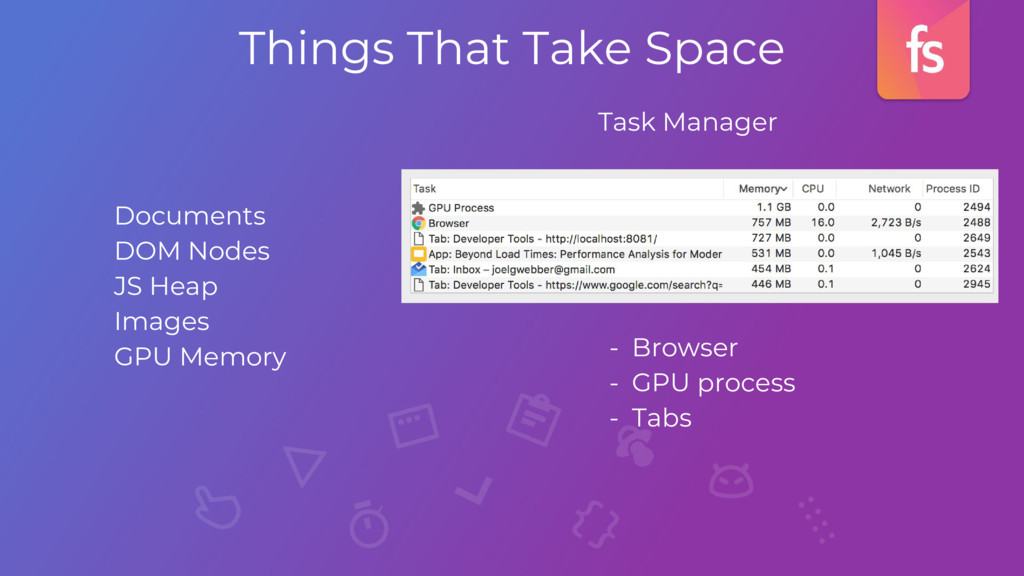
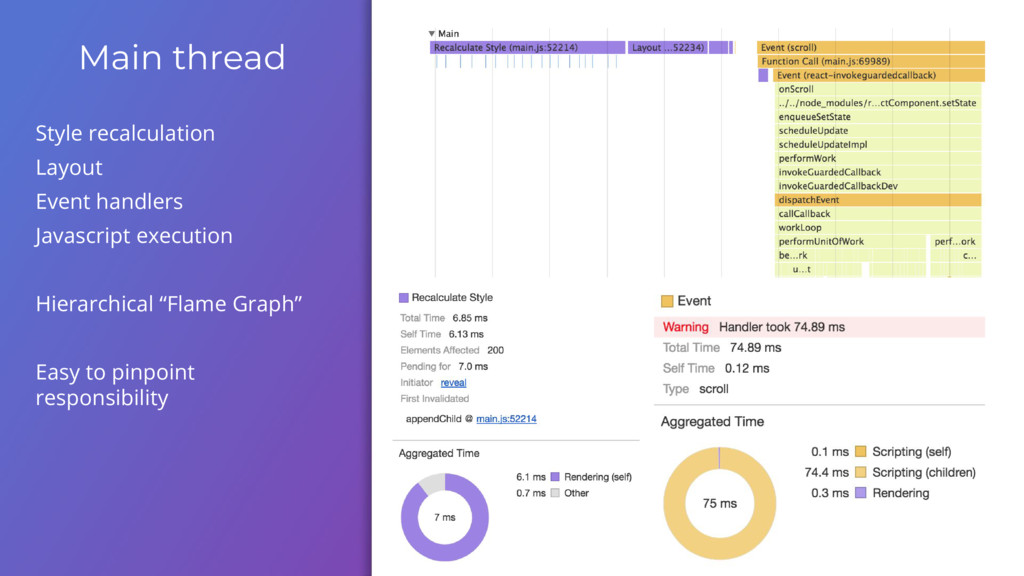
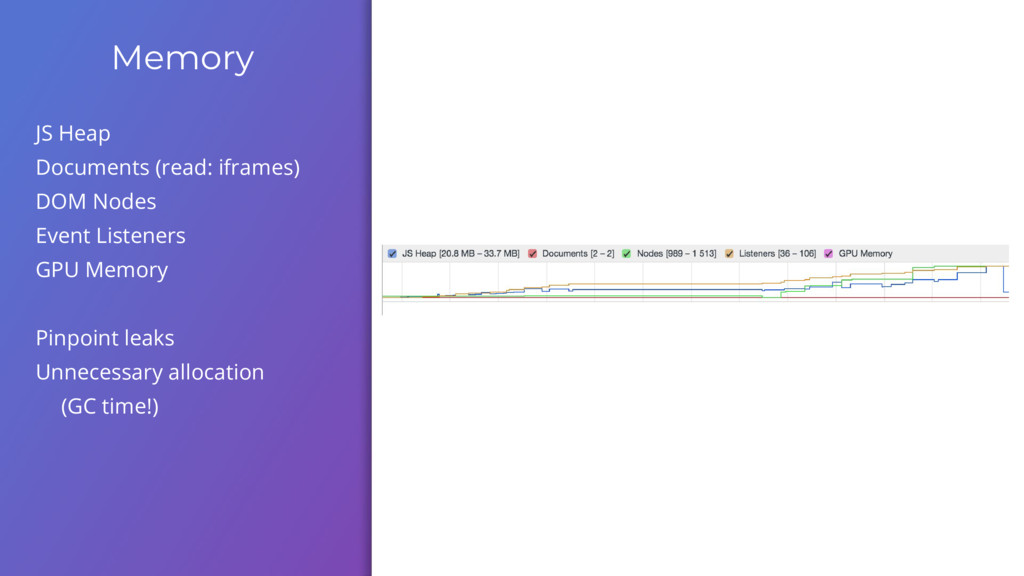
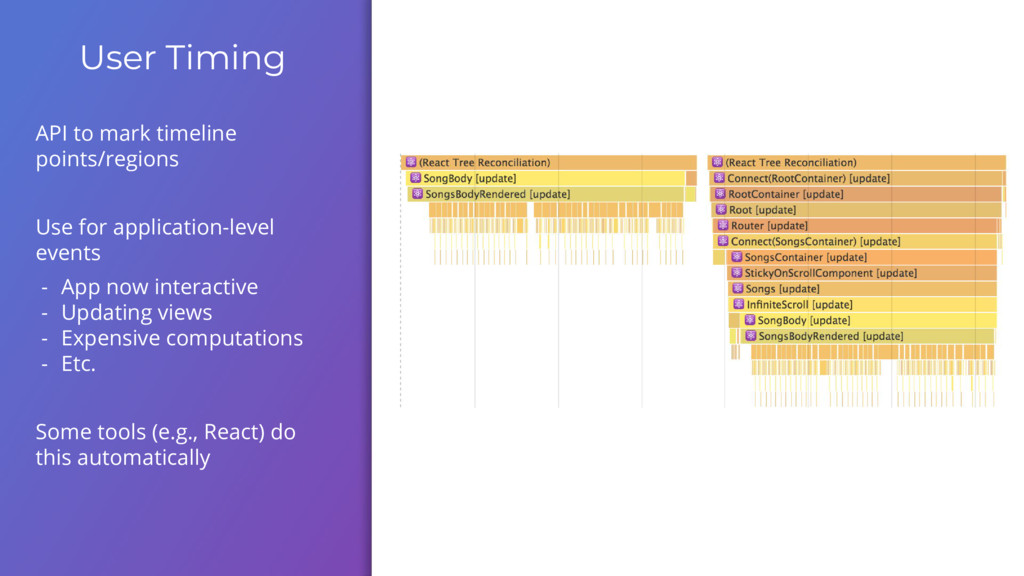
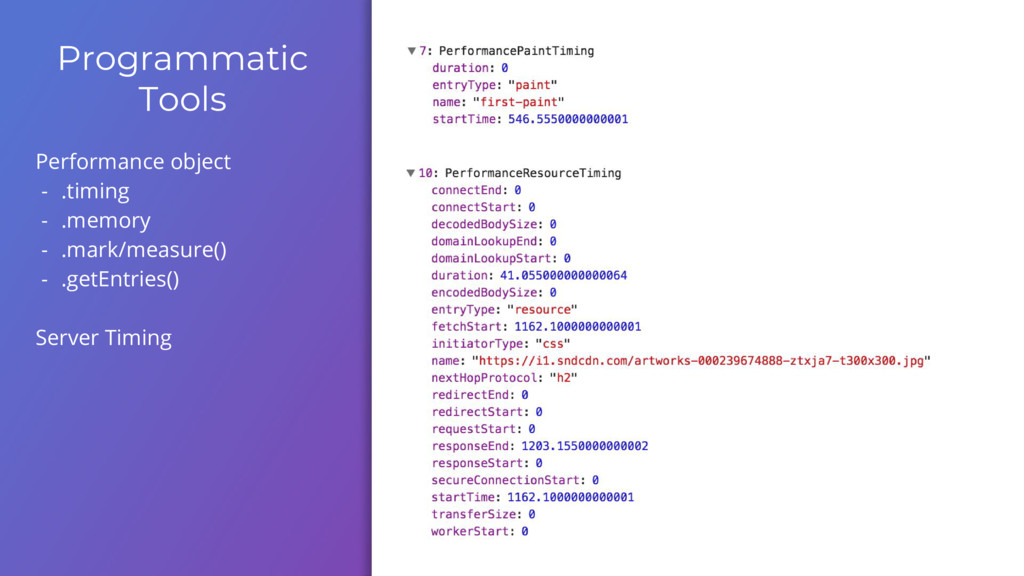
To this end, we'll focus on using Chrome's performance timeline to understand everything that a page does, from the initial page load to ajax requests and client-side rendering. We'll also discuss the tools and techniques at our disposal to eliminate performance bottlenecks, or at least sweep them under the rug when they're unavoidable.

London Web Performance Group

February 06, 2018
Tweet

More Decks by London Web Performance Group

Other Decks in Technology

Transcript

  1. Co-founder, Fullstory Google - Web Toolkit - Chrome Web games

    - Quake - Angry Birds - Minecraft Reformed game developer Who am I?
  2. App: “Single Page App” Plenty of great talks on making

    your pages load quickly. This isn’t one of those. Not all “pages” should be apps. But when they are, you need different tools and metrics. Apps, not Pages
  3. App Architecture Load/Render User Input Traditional Web Apps Render UI

    User Input Native Apps Load/Save Install Load User Input Render UI Single-Page Apps Send/Receive Document Load Render Initial UI Roughly equivalent to VT-100 from the 60s!
  4. “Loading” Your App Not the focus of this talk, but

    you should care: - Fast loading drives engagement - Slow drives users away - Google uses page speed in ranking - Smaller usually faster - less data on expensive networks Tools & Tech - Page Speed - Lighthouse - Progressive web apps #include <every_other_talk_about_fast_web_pages.h>
  5. Rendering Initial UI Forget “load” time - “Document loaded” meaningless

    for apps - “onload” too early or too late Instead - Time to first meaningful paint - Time to interactivity
  6. Page Load Milestones DOMContentLoaded - Document fully parsed - Non-async

    scripts loaded - Little or nothing rendered Load event - Resources in DOM loaded - No guarantee the app’s rendered First meaningful paint - Perceived as “loaded” Interactive - App’s Usable - Best defined in app code This app has “loaded” I bet the user disagrees
  7. <= Rendering <= Local interactions <= Network interactions <= Hopefully

    nothing Our Goal Tight input-data-render loop Perceived latency: < 17 ms or “Janky” < 100 ms or ”Laggy” < 1 s or ”Slow” > 10 s or ”Off to Facebook” User Input & I/O
  8. Loading data & resources Javascript execution Garbage collection Rendering -

    Style recalculation - Layout - Rasterization - Compositing Things That Take Time
  9. Documents DOM Nodes JS Heap Images GPU Memory Things That

    Take Space - Browser - GPU process - Tabs Task Manager
  10. “Browser” process - Process management - Raw user input -

    Network/disk I/O “Compositor” process - Rasterization - Compositing “Render” processes - HTML Parser & DOM - Javascript VM - Style recalculation - Layout Detour: Browser Architecture
  11. Chrome FPS Meter Gives a quick sense of “jank” Frame

    rate timeline and histogram GPU memory use Dig in further with the timeline
  12. Timeline subsumes old profiler Much clearer association of script time

    with other actions Mixes other events (e.g., GC) with script execution Script Execution
  13. Frame rate meter Performance overview Markers for: - DOMContentLoaded -

    First meaningful paint - Load event Timing & Overview First meaningful paint (candidates) First meaningful paint DOMContentLoaded Load event Frame rate
  14. Records each rendered frame With screenshots! Pinpoint the “janky bits”

    … and kill them with fire Frames tab shows layer tree Used in compositing Each consumes GPU memory Frames 60 frames / s = 1000 ms / 60 = 16.7 ms / frame!
  15. JS Heap Documents (read: iframes) DOM Nodes Event Listeners GPU

    Memory Pinpoint leaks Unnecessary allocation (GC time!) Memory
  16. API to mark timeline points/regions Use for application-level events -

    App now interactive - Updating views - Expensive computations - Etc. Some tools (e.g., React) do this automatically User Timing
  17. Measure “in the lab” - Lots of detail - Great

    for debugging - Can synthesize some constraints - But still not “real” Real User Monitoring Measure “in the wild” - Much less detail - Real users, devices, networks - Always more surprising than you expect! Learn from the wild, generate hypotheses, test them in the lab.
  18. Fullstory implementing some perf & error analysis: - Page timing

    metrics - Resource & user-event timing - Javascript & resource errors - Frame rate ("jank detection") Come help us on our mission to make the web suck less! Shameless Plug
  19. Resources First Meaningful Paint Page Speed Insights Lighthouse Progressive Web

    Apps Chrome dev tools Chrome performance tab Layers in Chrome Chrome compositing rasterization Javascript Performance object Scheduling, tasks, and microtasks React perf logging Server-side timing spec Fullstory Feel free to ask questions and request any other links, in the comments!